


 |
市场调查报告书
商品编码
1167122
中国LNG(液化天然气)进口分析(2023-2032)Research Report on China's Liquefied Natural Gas (LNG) Import 2023-2032 |
||||||
液化天然气 (LNG) 的体积约为气体的六分之一,被公认为地球上最清洁的化石能源之一。 随着全球经济逐步走向低碳化和环保化,近年来LNG市场规模迅速扩大。 由于自身的液化天然气储备不足,中国每年不得不进口大量的液化天然气。
示例视图
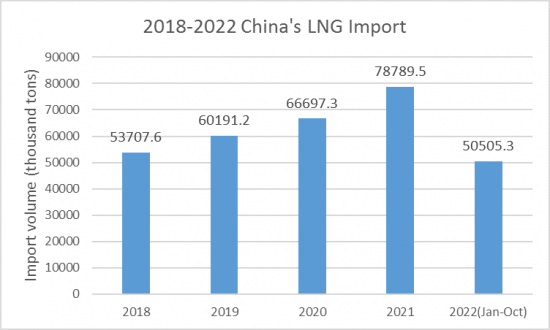
2021年,中国液化天然气进口量将达到787.95万吨(同比增长18.13%),进口额为440.75亿美元(同比增长89.64%)。 受新型冠状病毒病(COVID-19)疫情影响,2022年1-10月,中国液化天然气进口量将下降至5050.53万吨(同比下降21.60%),进口额为408.17亿美元(同比增长34.28%)。
中国的液化天然气进口平均价格持续下降,从 2018 年的 499.09 美元/吨下降到 2020 年的 348.47 美元/吨。 2020-2022年将继续上涨,2021年LNG进口均价为559.41美元/吨(较上年上涨60.53%)。 2022年1-10月,中国LNG进口均价为808.17美元/吨,同比上涨71.26%。
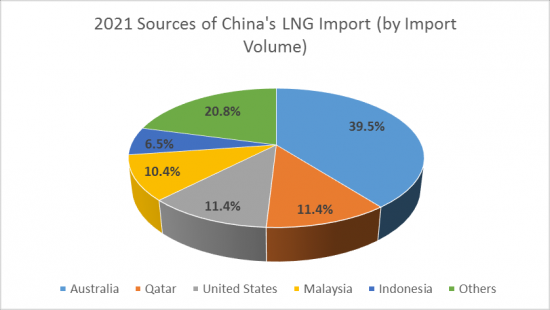
2021年,中国将从27个国家进口液化天然气。 从数量上看,澳大利亚、卡塔尔、美国、马来西亚和印度尼西亚是中国LNG进口的主要来源地。 澳大利亚是中国最大的液化天然气进口来源国,2021年进口3110.24万吨(占进口总量的39.48%),价值163.01亿美元(占进口总量的36.98%)。
由于中国对清洁能源的投资正在增加,而国内液化天然气生产增长潜力有限,预计从 2023 年到 2032 年,中国的液化天然气进口量将继续增加。
本报告分析了中国液化天然气 (LNG) 进口市场,包括总体进口量和进口额、主要进口来源地(2018-2022 年)、按类型分类的详细趋势、进口我们将编制和发布价格趋势、主要进口等信息市场驱动和製约因素,主要公司概况和战略,以及未来进口趋势展望(2023-2032)。
内容
第一章中国LNG进口分析(2018-2022年)
- 中国液化天然气进口规模
- 中国液化天然气进口量
- 中国的液化天然气进口值
- 中国液化天然气进口价格
- 中国液化天然气表观消费量
- 中国对液化天然气进口的依赖
- 中国主要的液化天然气进口商
- 进口量
- 进口价值
第2章中国液化天然气进口分析:长期合同(LTAs)(2018-2022)
- 进口量
- 进口价值
- 进口价格
- 进口商
- 进口量
- 进口价值
第3章中国LNG进口分析:短期合同/现货(2018-2022)
第四章中国主要进口来源地分析(2018-2022年)
- 澳大利亚
- 卡塔尔
- 美国
- 马来西亚
- 印度尼西亚
- 其他进口来源
第5章中国LNG进口展望(2023-2032年)
- 影响中国液化天然气进口的因素
- 有利因素
- 不利因素
- 中国 LNG 进口预测 (2023-2032)
- 进口量预测
- 进口量预测:按主要进口来源
Liquefied Natural Gas (LNG) is recognized as one of the cleanest fossil energy sources on the planet, with a volume of about one six hundredth of its gaseous form. With the global economy gradually moving towards low-carbon and environmental protection, the LNG market size has grown rapidly in recent years. China has insufficient local LNG reserves and therefore needs to import a large amount of LNG every year.
SAMPLE VIEW
In 2021, China's LNG imports reached 78,789,500 tons, up 18.13% year-on-year, with an import value of US$44.075 billion, up 89.64% year-on-year. According to CRI's analysis, from January to October 2022, China imported 50,505,300 tons of LNG, down 21.60% year-on-year, and imported US$40.817 billion, up 34.28% year-on-year, due to the COVID-19 outbreak.
CRI analysis, from 2018-2022, the average price of China's LNG imports generally shows a decreasing trend followed by an increasing trend. From 2018-2020, the average price of China's LNG imports decreases continuously, from US$499.09 per ton in 2018 to US$348.47 per ton in 2020. From 2020-2022, the average price of China's LNG imports increases continuously. In 2021, the average price of China's LNG imports is US$559.41 per ton, an increase of 60.53% y-o-y. In January-October 2022, the average price of China's LNG imports is US$808.17 per ton, an increase of 71.26% y-o-y.
In 2021, China imports LNG from a total of 27 countries. CRI analysis shows that by import volume, Australia, Qatar, the US, Malaysia and Indonesia are the main sources of LNG imports into China. Australia is the largest Chinese LNG importer, and in 2021, China imports 31,102,400 tons of LNG, accounting for 39.48% of total LNG imports in that year, with an import value of US$16,301 million, or 36.98% of total imports.
With China's investment in clean energy on the rise and limited room for growth in domestic LNG production, CRI expects China's LNG imports to continue to rise over the 2023-2032 period.
Topics covered:
- China's LNG Import Status and Major Sources in 2018-2022
- What is the Impact of COVID-19 on China's LNG Import?
- Which Companies are the Major Players in China's LNG Import Market and What are their Competitive Benchmarks?
- Key Drivers and Market Opportunities in China's LNG Import
- What are the Key Drivers, Challenges, and Opportunities for China's LNG Import during 2023-2032?
- What is the Expected Revenue of China's LNG Import during 2023-2032?
- What are the Strategies Adopted by the Key Players in the Market to Increase Their Market Share in the Industry?
- What are the Competitive Advantages of the Major Players in China's LNG Import Market?
- Which Segment of China's LNG Import is Expected to Dominate the Market in 2032?
- What are the Major Adverse Factors Facing China's LNG Import?
Table of Contents
1. 2018-2022 China's LNG Import Analysis
- 1.1. China's LNG Import Scale
- 1.1.1. China's LNG Import Volume
- 1.1.2. China's LNG Import Value
- 1.1.3. China LNG Import Price
- 1.1.4. China's Apparent LNG Consumption
- 1.1.5. China's LNG Import Dependence
- 1.2. China's Main Sources of LNG Imports
- 1.2.1. By Import Volume
- 1.2.2. By Import Value
2. 2018-2022 China LNG Import Analysis by LTA
- 2.1. Import Volume
- 2.2 Import Value
- 2.3. Import Price
- 2.4. Import Sources
- 2.4.1. By Import Volume
- 2.4.2. By Import Value
3. 2018-2022 China Short Contract/Spot LNG Import Analysis
- 3.1. Import Volume
- 3.2. Import Value
- 3.3. Import Price
- 3.4 Import Sources
- 3.4.1. By Import Volume
- 3.4.2. By Import Value
4. 2018-2022 China's Main Import Sources Analysis
- 4.1. Australia
- 4.2. Qatar
- 4.3. United States
- 4.4. Malaysia
- 4.5. Indonesia
- 4.6. Other Import Sources
5. China's LNG Import Outlook 2023-2032
- 5.1 Factors Affecting China's LNG Imports
- 5.1.1 Favorable Factors
- 5.1.2. Unfavorable Factors
- 5.2. China's LNG Import Forecast, 2023-2032
- 5.2.1 Import Volume Forecast
- 5.2.2. Forecast of Major Import Sources
 亚太生物液化天然气市场:分析与预测(2023-2032)
 欧洲生物液化天然气市场-分析与预测(2023-2032)
 2024年液化天然气压缩机全球市场报告
 生物液化天然气市场:按来源类型、应用划分 - 2024-2030 年全球预测
 液化天然气市场:按类型、应用分类 - 2024-2030 年全球预测
 2024 年液化天然气全球市场报告
 液化天然气卡车的全球市场(2024年版):金额、数量、卡车类型、重量类型、应用、地区、国家、市场分析、考察进行分析(2019-2029)
 LNG长期契约动向的检讨分析:各地区,各契约,各企业,2022年
 全球生物液化天然气市场 2023-2030
 液化天然气产业展望:按产能和资本投资划分 - 到 2027 年所有营运和计画接收站的详细信息