


 |
市场调查报告书
商品编码
1438262
菌根:市场占有率分析、产业趋势与统计、成长预测(2024-2029)Mycorrhiza - Market Share Analysis, Industry Trends & Statistics, Growth Forecasts (2024 - 2029) |
||||||
价格
※ 本网页内容可能与最新版本有所差异。详细情况请与我们联繫。
简介目录
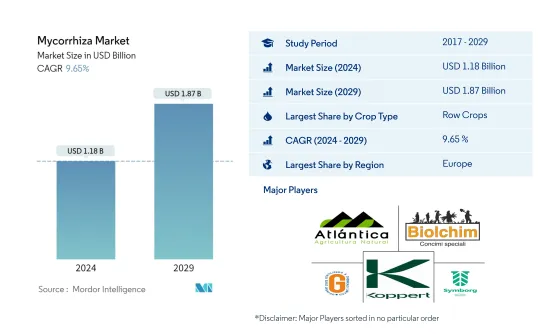
预计2024年菌根市场规模为11.8亿美元,预计到2029年将达到18.7亿美元,在预测期内(2024-2029年)复合年增长率为9.65%。
主要亮点
- 中耕作物是最大的作物类型。大麦、玉米、小麦、油菜籽、黑麦、向日葵、大豆和米遍布世界各地。菌根有助于植物的多种固定和移动元素。
- 园艺作物是生长最快的作物类型。有机农产品消费量的增加以及有机水果和蔬菜作物种植面积的增加,增加了园艺作物中菌根真菌的消费。
- 欧洲是最大的地区。法国和义大利国家主导菌根市场。这是由于中耕作物有机种植的增加和化学肥料使用的减少。
- 法国是最大的国家。捲心菜、扁豆、南瓜、小麦、玉米、大麦和马铃薯是该国生产的有机作物。菌根散布减少了化学肥料的使用量。
菌根生物肥料市场趋势
中耕作物是最大的作物类型
- 菌根真菌是与植物根系形成共生关係的真菌。它增加了植物根系的表面积,有利于植物对养分的吸收。中耕作物占据菌根市场的大部分,到2022年该领域约占市场价值的76.0%。大麦、玉米、小麦、油菜籽、黑麦、向日葵、大豆和稻米是世界各地种植的主要蜡质作物。
- 园艺作物占全球菌根市场的19.2%,2022年价值1.919亿美元,其中欧洲是主导市场,同年占52.6%的份额。该地区对有机水果和蔬菜的需求不断增加,德国和法国是有机食品消费的主要市场。
- 2022年,咖啡、茶叶、可可、棉花、甘蔗等经济作物占全球菌根市场的4.7%。北美地区主导经济作物菌根生物肥料市场。 2022年该领域占总销售量的59.2%,其中美国以47.0%的市场占有率成为主导市场。美国广阔的耕地面积以及大约 16 个州存在缺磷土壤是促成这一优势的主要因素。
- 菌根在农业中的使用提供了一种永续且环保的方法来改善植物生长和生产力。随着越来越多的农民和生产者采用这项技术来提高产量并减少对环境的影响,预计菌根市场在未来几年将会成长。
欧洲是最大的地区
- 菌根真菌是全球消费量最大的生物肥料,2022年市价为9.953亿美元,数量为9.66万吨,占36.3%。菌根真菌是与植物根系形成共生关係的真菌。它增加了植物根系的表面积,有利于植物对养分的吸收。
- 2022年,欧洲以55.2%的份额主导全球生物肥料市场。 2022年欧洲地区菌根生物肥料市场价值为3,980万美元,同年销售量为1,100吨。预计欧洲市场在预测期内(2023-2029 年)复合年增长率为 9.3%。
- 2022年,北美占全球菌根市场的25.4%。原厂作物主导北美菌根生物肥料市场,2022 年约占市场价值的 68.1%。这主要是由于对磷的要求更高的谷物,例如:玉米和玉米以及该国大作物作物种植区的存在。
- 菌根,也称为丛枝菌根真菌(AMF),已被证明可显着提高作物产量。四年来,欧洲进行了约 231 次田间试验,试验条件是在理想条件下在田间种植马铃薯,结果显示马铃薯的适销产量平均增加了 9.5%。菌根对植物营养,尤其是磷的吸收有显着贡献。这些有助于选择性吸收固定元素(P、Zn、Cu)和移动元素(S、Ca、K、Fe、Mn、Cl、Br、N)以及从植物中吸收水分。
其他福利
- Excel 格式的市场预测 (ME) 表
- 3 个月分析师支持
目录
第一章执行摘要和主要发现
第二章 提供报告
第三章简介
- 研究假设和市场定义
- 调查范围
- 调查方法
第四章 产业主要趋势
- 有机种植面积
- 人均有机产品支出
- 法律规范
- 价值炼和通路分析
第五章市场区隔
- 作物类型
- 经济作物
- 园艺作物
- 中耕作物
- 地区
- 非洲
- 按国家/地区
- 埃及
- 奈及利亚
- 南非
- 其他非洲
- 亚太地区
- 按国家/地区
- 澳洲
- 中国
- 印度
- 印尼
- 日本
- 菲律宾
- 泰国
- 越南
- 其他亚太地区
- 欧洲
- 按国家/地区
- 法国
- 德国
- 义大利
- 荷兰
- 俄罗斯
- 西班牙
- 土耳其
- 英国
- 其他欧洲国家
- 中东
- 按国家/地区
- 伊朗
- 沙乌地阿拉伯
- 其他中东地区
- 北美洲
- 按国家/地区
- 加拿大
- 墨西哥
- 美国
- 北美其他地区
- 南美洲
- 按国家/地区
- 阿根廷
- 巴西
- 南美洲其他地区
- 非洲
第六章 竞争形势
- 重大策略倡议
- 市场占有率分析
- 公司形势
- 公司简介
- Atlantica Agricola
- Biolchim SPA
- Biostadt India Limited
- Gujarat State Fertilizers &Chemicals Ltd
- Indogulf BioAg LLC(Biotech Division of Indogulf Company)
- Koppert Biological Systems Inc.
- Sustane Natural Fertilizer Inc.
- Symborg, Inc.
- T.Stanes and Company Limited
- Valent Biosciences LLC
第七章 CEO 面临的关键策略问题
第8章附录
- 全球概览
- 概述
- 波特的五力框架
- 全球价值链分析
- 市场动态(DRO)
- 来源和参考文献
- 表格和图形列表
- 重要见解
- 资料包
- 词彙表
简介目录
Product Code: 64677
The Mycorrhiza Market size is estimated at USD 1.18 billion in 2024, and is expected to reach USD 1.87 billion by 2029, growing at a CAGR of 9.65% during the forecast period (2024-2029).
Key Highlights
- Row Crops is the Largest Crop Type. Barley, corn, wheat, rapeseed, rye, sunflower, soybean, and rice are produced globally. Mycorrhiza contributes to several immobile and mobile elements from plants.
- Horticultural Crops is the Fastest-growing Crop Type. The growing consumption of organic produce and the rising acreage under the organic fruits and vegetable crops resulted in more mycorrhiza consumption in horticultural crops.
- Europe is the Largest Region. France and Italy countries are dominating the mycorrhiza market, this is due to the increased organic cultivation of row crops and the reduction in chemical fertilizers use.
- France is the Largest Country. Cabbage, lentils, pumpkins, wheat, maize, barley, and potatoes are the organic crops produce in the country. Mycorrhiza application reduce the chemical fertilizer consumption.
Mycorrhiza Biofertilizers Market Trends
Row Crops is the largest Crop Type
- Mycorrhiza is a fungus that establishes a symbiotic relationship with the plant root system. It increases the root surface area of the plants, which in turn enhances the nutrient uptake of the plants. Row crops dominate the mycorrhiza market, and the segment accounted for about 76.0% of the market value in 2022. Barley, corn, wheat, rapeseed, rye, sunflower, soybean, and rice are the major row crops grown globally.
- Horticultural crops represent 19.2% of the global mycorrhiza market, valued at USD 191.9 million in 2022, with Europe being the dominant market with a share of 52.6% in the same year. The demand for organic fruits and vegetables in the region is growing, with Germany and France being the major markets for organic food consumption.
- Cash crops, including coffee, tea, cocoa, cotton, and sugarcane, accounted for 4.7% of the global mycorrhiza market in 2022. The North American region dominates the mycorrhiza biofertilizer market for cash crops. The segment accounted for 59.2% of the total value in 2022, with the United States being the dominant market, accounting for 47.0% of the market share. The large cultivation area in the United States and the presence of phosphorous-deficient soils in about 16 states are the main factors contributing to this dominance.
- The use of mycorrhiza in agriculture provides a sustainable and eco-friendly approach to improving plant growth and productivity. The mycorrhiza market is expected to grow in the coming years as more farmers and growers adopt this technology to improve their yields and reduce their environmental footprint.
Europe is the largest Region
- Mycorrhiza is the most consumed biofertilizer globally, and it accounted for a share of 36.3% in 2022, with a market value of USD 995.3 million and a volume of 96.6 thousand metric tons. Mycorrhiza is a fungus that establishes a symbiotic relationship with the plant root system. It increases the root surface area of the plants, which in turn enhances the nutrient uptake of the plants.
- Europe dominated the global biofertilizers market with a share of 55.2% in 2022. Mycorrhiza biofertilizer in the European region accounted for a market value of USD 39.8 million in 2022 and a volume of 1.1 thousand metric tons in the same year. The European market is estimated to grow and register a CAGR of 9.3% during the forecast period (2023-2029).
- North America accounted for 25.4% of the global mycorrhiza market in 2022. Row crops dominated the North American mycorrhiza biofertilizer market, accounting for about 68.1% of the market value in 2022. This is mainly due to the more phosphorous-demanding cereal crops, like corn and maize, and the presence of large-row crop cultivation areas in the country
- Mycorrhiza, also referred to as arbuscular mycorrhizal fungi (AMF), was proven to increase crop yields significantly. About 231 field trials conducted over four years in Europe in potato filed under ideal conditions increased the yield of marketable potatoes by 9.5% on average. Mycorrhizae contribute significantly to plant nutrition, particularly to phosphorus uptake. They contribute to the selective absorption of immobile (P, Zn, and Cu) and mobile (S, Ca, K, Fe, Mn, Cl, Br, and N) elements from plants and water uptake.
Mycorrhiza Biofertilizers Industry Overview
The Mycorrhiza Market is fragmented, with the top five companies occupying 2%. The major players in this market are Atlantica Agricola, Biolchim SPA, Gujarat State Fertilizers & Chemicals Ltd, Koppert Biological Systems Inc. and Symborg, Inc. (sorted alphabetically).
Additional Benefits:
- The market estimate (ME) sheet in Excel format
- 3 months of analyst support
TABLE OF CONTENTS
1 EXECUTIVE SUMMARY & KEY FINDINGS
2 REPORT OFFERS
3 INTRODUCTION
- 3.1 Study Assumptions & Market Definition
- 3.2 Scope of the Study
- 3.3 Research Methodology
4 KEY INDUSTRY TRENDS
- 4.1 Area Under Organic Cultivation
- 4.2 Per Capita Spending On Organic Products
- 4.3 Regulatory Framework
- 4.4 Value Chain & Distribution Channel Analysis
5 MARKET SEGMENTATION
- 5.1 Crop Type
- 5.1.1 Cash Crops
- 5.1.2 Horticultural Crops
- 5.1.3 Row Crops
- 5.2 Region
- 5.2.1 Africa
- 5.2.1.1 By Country
- 5.2.1.1.1 Egypt
- 5.2.1.1.2 Nigeria
- 5.2.1.1.3 South Africa
- 5.2.1.1.4 Rest of Africa
- 5.2.2 Asia-Pacific
- 5.2.2.1 By Country
- 5.2.2.1.1 Australia
- 5.2.2.1.2 China
- 5.2.2.1.3 India
- 5.2.2.1.4 Indonesia
- 5.2.2.1.5 Japan
- 5.2.2.1.6 Philippines
- 5.2.2.1.7 Thailand
- 5.2.2.1.8 Vietnam
- 5.2.2.1.9 Rest of Asia-Pacific
- 5.2.3 Europe
- 5.2.3.1 By Country
- 5.2.3.1.1 France
- 5.2.3.1.2 Germany
- 5.2.3.1.3 Italy
- 5.2.3.1.4 Netherlands
- 5.2.3.1.5 Russia
- 5.2.3.1.6 Spain
- 5.2.3.1.7 Turkey
- 5.2.3.1.8 United Kingdom
- 5.2.3.1.9 Rest of Europe
- 5.2.4 Middle East
- 5.2.4.1 By Country
- 5.2.4.1.1 Iran
- 5.2.4.1.2 Saudi Arabia
- 5.2.4.1.3 Rest of Middle East
- 5.2.5 North America
- 5.2.5.1 By Country
- 5.2.5.1.1 Canada
- 5.2.5.1.2 Mexico
- 5.2.5.1.3 United States
- 5.2.5.1.4 Rest of North America
- 5.2.6 South America
- 5.2.6.1 By Country
- 5.2.6.1.1 Argentina
- 5.2.6.1.2 Brazil
- 5.2.6.1.3 Rest of South America
- 5.2.1 Africa
6 COMPETITIVE LANDSCAPE
- 6.1 Key Strategic Moves
- 6.2 Market Share Analysis
- 6.3 Company Landscape
- 6.4 Company Profiles
- 6.4.1 Atlantica Agricola
- 6.4.2 Biolchim SPA
- 6.4.3 Biostadt India Limited
- 6.4.4 Gujarat State Fertilizers & Chemicals Ltd
- 6.4.5 Indogulf BioAg LLC (Biotech Division of Indogulf Company)
- 6.4.6 Koppert Biological Systems Inc.
- 6.4.7 Sustane Natural Fertilizer Inc.
- 6.4.8 Symborg, Inc.
- 6.4.9 T.Stanes and Company Limited
- 6.4.10 Valent Biosciences LLC
7 KEY STRATEGIC QUESTIONS FOR AGRICULTURAL BIOLOGICALS CEOS
8 APPENDIX
- 8.1 Global Overview
- 8.1.1 Overview
- 8.1.2 Porter's Five Forces Framework
- 8.1.3 Global Value Chain Analysis
- 8.1.4 Market Dynamics (DROs)
- 8.2 Sources & References
- 8.3 List of Tables & Figures
- 8.4 Primary Insights
- 8.5 Data Pack
- 8.6 Glossary of Terms
02-2729-4219
+886-2-2729-4219
 菌根真菌生物肥料市场:按类型、型态、应用分类 - 全球预测 2023-2030
 基于菌根的生物肥料市场 - 全球产业规模、份额、趋势、机会和预测,2018-2028F 按类型、形式、应用模式、按应用、地区和竞争细分
 到 2030 年菌根真菌生物肥料市场预测 - 按类型、型态、应用型态、用途和地区进行的全球分析
 菌根菌生物肥料的全球市场 (2019-2029年):各形态、类型、适用方式、用途、地区的市场规模、占有率、趋势分析、机会、预测
 菌根为基础的生物肥料的全球市场(2022年~2028年):COVID-19影响分析,各类型,不同形态,各用途,各地区 - 产业分析,市场规模,市场占有率,预测
 菌根为基础的生物肥料的全球市场(2023年~2032年):市场占有率,规模,趋势,产业分析,适用模式别,各用途,不同形态,各类型,各地区,市场区隔预测
 全球菌根生物肥料市场-2022-2029