


 |
市场调查报告书
商品编码
1851034
OTT( Over-the-Top):市场份额分析、行业趋势、统计数据和成长预测(2025-2030 年)Over The Top (OTT) - Market Share Analysis, Industry Trends & Statistics, Growth Forecasts (2025 - 2030) |
||||||
※ 本网页内容可能与最新版本有所差异。详细情况请与我们联繫。
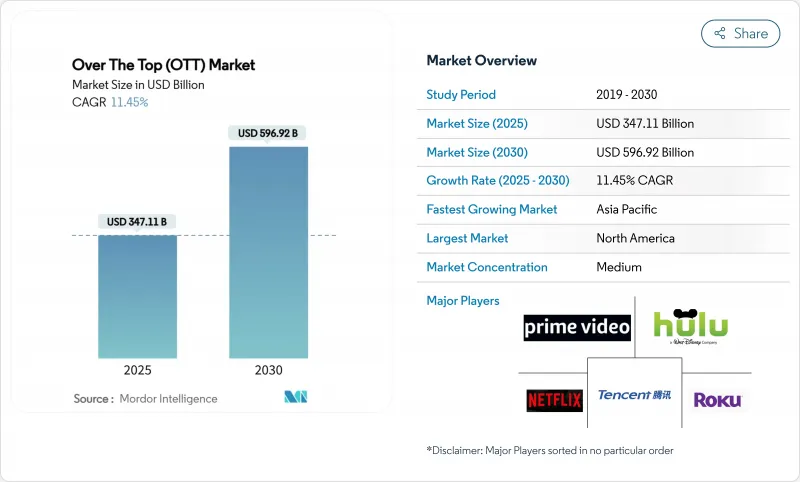
预计到 2025 年,OTT 市场规模将达到 3,471.1 亿美元,到 2030 年将达到 5,969.2 亿美元。
这是因为不断增强的网路连线、装置普及和广告迁移持续推动线上影片成为全球娱乐的中心。
成长动能取决于宽频升级,它将全高清和4K串流带入主流家庭,而智慧型手机的普及则增加了人们在通勤和休息时间的观看时长。广告主受到精准定位和效果指标的吸引,正在重新分配传统电视预算,并扩大跨平台收入派饼。竞争对手的崛起推动了将体育赛事直播、优质剧集和用户原创视讯整合到单一介面的服务的发展,这既提高了用户的期望,也实现了盈利模式的多元化。现有广播公司正在加速推出直接面向消费者(DTC)的服务,利用其丰富的节目库,有效地消除了传统电视和串流媒体之间的历史隔阂。同时,介面在地化、配音和字幕等措施正在悄悄提升用户留存率,让内容更具文化共鸣。
全球OTT(Over-the-Top)市场趋势与洞察
通讯业者和OTT捆绑套餐:新兴市场成长的关键
行动电话商与串流媒体服务供应商的合作正在透过将娱乐内容捆绑到预付数据包中来拓展OTT市场,从而降低双方的获客成本。印尼Telkomsel与Catchplay+的合作利用了4G网路的广泛覆盖,绕过了固网覆盖范围有限的问题,扩大了串流媒体服务的初始渗透率,同时增加了通讯业者的数据使用量。行动储值套餐的整合定价降低了用户流失率,并将交易数据回馈给建议,使其能够快速适应本地用户的偏好。通讯业者的收入增加弥补了语音传输利润率下降的局面,而平台则在价格敏感型用户群中实现了快速成长。
体育版权价格上涨:重塑高端经济
NBA与ESPN、NBC环球和亚马逊签署的为期11年、价值760亿美元的媒体协议,凸显了实况活动日益增长的战略价值。像ESPN、FOX和华纳兄弟探索频道这样的合资企业,既能扩展业务范围,又能分散风险。不断攀升的估值也带动了人们对区域性和小众体育赛事的兴趣,这些赛事即使在较低的版权溢价下也能保持观众群,从而在不损害利润的情况下实现内容丰富的播出安排。分级提供的赛季通行证、按次付费和旗舰套餐,既能满足铁桿粉丝的需求,又能为普通观众提供丰富的节目选择。
内容获取成本:盈利的挑战
激烈的竞标战正在挤压净利率,尤其是对中型游戏开发商而言。如今,游戏工作室在评估计划,包括系列潜力、週边产品潜力以及跨平台游戏玩法,以确保首发串流媒体播放之外的持续收益。他们也会利用人工智慧驱动的需求预测,在开发初期就辨识出反响不佳的项目,进而降低沉没成本风险。投资者越来越重视营运利润率而非用户数量,这促使经营团队在资本配置方面更加谨慎。
细分市场分析
到2024年,AVOD和FAST将占OTT市场规模的13%。预计到2030年,该细分市场将以13.4%的复合年增长率成长,显着高于OTT市场的整体成长速度。 Netflix的广告层级在推出的第一年就吸引了大量新订阅用户。改进后的指标将增强广告主的信心,并提高广告填充率,从而为更广泛的原创内容提供资金,同时又不影响高端SVOD套餐的获利。该平台受益于双重收入来源:广告提高了每位用户平均收入,而订阅则确保了基础收入。同时,FAST频道透过将其庞大的内容库重新剪辑成精简的线性节目,降低了内容摊销成本,这种节目形式更能吸引那些已经养成固定频道观看习惯的用户。
随着新兴市场用户可支配收入有限,纯订阅模式难以普及,AVOD模式的持续成长对整个OTT产业至关重要。 AVOD模式的成熟将推动用户群的拓展,尤其是在新兴市场,其用户群规模不断扩大。随着混合获利模式的日趋成熟,分层式的入门级服务模式将会出现,包括面向普通用户的免费广告支援模式、预算有限用户的折扣广告支援精简版模式,以及针对追求极致便利的家庭用户的无广告高级版模式。预计广告支援串流媒体将以13.4%的速度成长,未来将在内容投资中占据更大份额,并在竞争中扮演越来越重要的套件。
区域分析
北美地区将占2024年总收入的37%,这主要得益于宽频普及和用户逐渐形成的「剪线族」习惯。如今,成长的驱动力更多来自平均每用户收入(ARPU)的提升,而非新增用户的增长,这促使平台推出密码共用额外费用、价格上涨以及配套服务,以提升用户感知价值。合资企业面临美国反垄断审查,这可能会延缓大型併购案的发生,但内容授权将得到战术性加强,从而在共用生态系统中维护各个品牌的独立性。来自NFL、NBA和MLB等体育赛事的转播权费用确保了平台的持续稳健发展,儘管利润率压力不断增加,需要拓展多元化的收入来源,例如商品行销和电影票房。
2025年至2030年间,亚太地区将以10.3%的复合年增长率成为成长最快的地区,智慧型手机的普及和低成本资料通讯的增加将推动用户观看时长的成长。印度本土平台JioCinema和腾讯投资的WeTV等正在建构以本地语言和微支付选项为基础的介面,以加深不同收入群体的用户参与度。国际巨头将推出针对特定地区的原创节目,通常采用短季或单元剧的形式。通讯业者、储值卡套餐和现金券将有助于缩小信用卡普及率差距,并扩大潜在用户群。
到2024年,拉丁美洲和中东及非洲地区的总收入将占全球OTT市场收入的不到15%,但随着宏观经济经济状况趋于稳定,年轻人口步入消费年龄,这些地区仍有庞大的成长空间。像Televisa和MBC这样的区域性广播公司将透过混合型AVOD模式对其传统内容库进行现代化改造,从而将广告商的资金留在国内市场生态系统内。涵盖行动钱包、现金充值和通讯业者计费等支付创新将进一步扩大覆盖范围。随着光纤和5G部署的加速推进,这些地区预计在未来十年内显着提升其对全球OTT市场收费的贡献。
其他福利:
- Excel格式的市场预测(ME)表
- 3个月的分析师支持
目录
第一章 引言
- 研究假设和市场定义
- 调查范围
第二章调查方法
第三章执行摘要
第四章 市场情势
- 市场概览
- 市场驱动因素
- 通讯业者与OTT捆绑伙伴关係加速了南亚和东南亚低ARPU用户成长
- 创纪录的体育赛事直播版权价格上涨推高了北美和欧洲D2C OTT服务的溢价。
- 联网电视广告需求的转变推动了美国和英国AVOD和FAST的收入成长
- 政府对国产产品含量设定配额(例如欧盟的30%规则)会刺激对本地原创产品的消费。
- 市场限制
- 内容获取成本不断上涨,削弱了成熟的SVOD市场的盈利。
- 北美订阅迭加模式的高解约率
- 产业生态系分析
- 监理展望
- 波特五力分析
- 新进入者的威胁
- 买方的议价能力
- 供应商的议价能力
- 替代品的威胁
- 竞争对手之间的竞争
- 影响OTT和电视产业的宏观经济因素
第五章 市场规模与成长预测
- 按服务类型
- SVOD
- AVOD
- TVOD
- 混合模式(订阅+广告)
- 按设备平台
- 智慧型手机和平板电脑
- 智慧连网电视
- 笔记型电脑和桌上型电脑
- 串流媒体播放器
- 其他的
- 按内容类型
- 娱乐与电影
- 运动的
- 新闻资讯
- 教学与学习
- 其他(纪录片、真人秀)
- 按地区
- 北美洲
- 美国
- 加拿大
- 墨西哥
- 南美洲
- 巴西
- 阿根廷
- 其他南美洲
- 欧洲
- 德国
- 英国
- 法国
- 义大利
- 西班牙
- 其他欧洲地区
- 亚太地区
- 中国
- 日本
- 韩国
- 印度
- 澳洲
- 纽西兰
- 亚太其他地区
- 中东和非洲
- 阿拉伯聯合大公国
- 沙乌地阿拉伯
- 南非
- 其他中东和非洲地区
- 北美洲
第六章 竞争情势
- Strategic Developments
- Vendor Positioning Analysis
- 公司简介
- Netflix Inc.
- Google LLC(YouTube)
- Amazon.com Inc.(Prime Video)
- The Walt Disney Company(Disney+& Hulu)
- Tencent Holdings Ltd(Tencent Video)
- Apple Inc.(Apple TV+)
- Warner Bros. Discovery(Max)
- Comcast Corp.(Peacock)
- Paramount Global(Paramount+)
- DAZN Group Ltd.
- Roku Inc.
- PCCW Media Group(Viu)
- Baidu Inc.(iQIYI)
- Alibaba Pictures(Youku Tudou)
- Zee Entertainment(ZEE5)
- Viacom18 Media(JioCinema)
- MBC Group(Shahid)
- Canal+Group(myCanal)
- Rakuten Group(Rakuten TV)
- NHK World-Japan
第七章 市场机会与未来展望
The OTT market size is estimated at USD 347.11 billion in 2025 and is projected to reach USD 596.92 billion by 2030, expanding at an 11.45% CAGR as richer connectivity, device proliferation, and escalating advertising migration keep propelling online video toward the core of global entertainment.
Growth momentum rests on broadband upgrades that bring full-HD and 4K streaming to mainstream households, while ubiquitous smartphones unlock incremental viewing hours during commutes and breaks. Advertisers, lured by addressable targeting and outcome-based metrics, are re-allocating linear TV budgets, widening the overall revenue pie for platforms. Heightened rivalries are pushing services to combine live sports, premium scripted franchises, and user-generated clips in a single interface, simultaneously raising customer expectations and diversifying monetization. Established broadcasters are accelerating direct-to-consumer (DTC) launches that leverage deep program libraries, effectively erasing the historical wall between linear and streaming, while localization of interfaces, dubbing, and subtitles quietly improves retention by making content culturally resonant.
Global Over The Top (OTT) Market Trends and Insights
Telco-OTT Bundling: Unlocking Growth in Emerging Markets
Partnerships between mobile operators and streaming providers are widening the OTT market by embedding entertainment in prepaid data packs, lowering acquisition costs for both parties. Telkomsel's alliance with Catchplay+ in Indonesia taps ubiquitous 4G coverage to bypass limited fixed-line reach, expanding first-time streamer penetration while boosting data usage for the carrier. Integrated pricing within mobile top-ups reduces involuntary churn and feeds transaction insights into recommendation engines that quickly adapt to local tastes. Operators benefit from incremental revenue that cushions shrinking voice margins, while platforms gain swift scale among price-sensitive users.
Sports Rights Inflation: Reshaping Premium Economics
The NBA's 11-year USD 76 billion media pact with ESPN, NBCUniversal, and Amazon signposts the growing strategic value of live events. Expensive rights forge a defensive moat that few services can finance alone, spurring joint ventures such as the ESPN-FOX-Warner Bros. Discovery consortium to spread risk yet maintain portfolio breadth. Rising valuations intensify interest in regional or niche sports whose rights carry lower premiums but still retain audiences, thereby filling content calendars without denting margins. Tiered offers-season passes, pay-per-view, and bundled flagship tiers-monetize superfans while preserving broader packages for casual viewers.
Content Acquisition Costs: The Profitability Challenge
Escalating bidding wars for marquee titles have compressed margins, especially for mid-scale players. Studios now enforce stricter green-light criteria that rate projects on franchise potential, merchandise viability, and cross-platform game adaptations, ensuring returns extend beyond first-window streaming. Shorter exclusivity periods allow second-window syndication that offsets cash burn, while AI-driven demand forecasts trim sunk-cost risk by flagging low-resonance concepts earlier in development. Investors increasingly focus on blended operating margins rather than raw subscriber adds, nudging management to favor disciplined capital allocation.
Other drivers and restraints analyzed in the detailed report include:
- AVOD and FAST Growth: Advertising's Streaming Renaissance
- Content Quotas: Regulatory Catalysts for Local Production
- Subscription Stacking: The Churn Challenge
For complete list of drivers and restraints, kindly check the Table Of Contents.
Segment Analysis
AVOD and FAST constituted 13% of the OTT market size in 2024. This cohort is forecast to rise at 13.4% CAGR through 2030, notably faster than the overall OTT market path, as inflation pressures heighten price sensitivity while advertisers chase addressable audiences. Netflix's ad tier captured a sizable slice of new sign-ups within its debut year . Enhanced measurement standards raise advertiser confidence, driving higher fill rates that fund broader original slates without eroding premium SVOD bundles. Platforms benefit from a dual revenue stream in which advertising uplifts average revenue per user while subscriptions secure base income. In parallel, FAST channels recycle deep libraries into lean, linear-style programming that appeals to habitual channel surfers, helping reduce content amortization costs.
Continued AVOD traction proves decisive for the broader OTT industry because it widens the accessible user base in emerging markets where disposable income constrains pure subscription adoption. As hybrid monetization matures, tiered entry points emerge: free-with-ads for casual viewers, discounted ad-lite models for budget watchers, and premium ad-free tiers for households demanding maximal convenience. Given its 13.4% forecast cadence, ad-supported streaming is positioned to shoulder a larger share of future content investments, reinforcing its importance in the competitive toolkit.
The OTT Market is Segmented by Service Type (SVOD, AVOD, TVOD, Hybrid (Subscription + Ads)), Device Platform (Smartphones and Tablets, Smart and Connected TVs, Laptops and Desktops, Streaming Media Players, and More), Content Genre (Entertainment and Movies, Sports, News and Information, Education and Learning, and More), Geography. The Market Forecasts are Provided in Terms of Value (USD).
Geography Analysis
North America held 37% of 2024 revenue, benefiting from near-universal broadband and entrenched cord-cutting habits. Growth now hinges more on ARPU lifts than fresh subscriber gains, pushing platforms to introduce password-sharing surcharges, price rises, and bundled offerings that stretch perceived value. Joint ventures face U.S. antitrust scrutiny that may slow mega-mergers but tactically tighten content licensing, preserving individual brand identities even within shared ecosystems. Robust sports rights expenditures-NFL, NBA, MLB-ensure continued stickiness, though they heighten margin pressures that necessitate diversified income streams such as merchandising or theatrical windows.
Asia-Pacific posts the fastest regional CAGR at 10.3% for 2025-2030 as smartphone affordability and low-cost data unlock incremental viewing hours. Indigenous platforms like India's JioCinema and Tencent-backed WeTV craft interfaces around local languages and micro-payment options, deepening engagement across varied income brackets. International giants respond with region-specific originals-short seasons, anthology formats-that fit local budgets yet carry global export potential. Telco partnerships, bundled prepaid plans, and cash vouchers mitigate credit-card penetration gaps, broadening the bankable audience.
Latin America and the Middle East & Africa together accounted for under 15% of 2024 revenue but present meaningful headroom as macroeconomic conditions stabilize and young populations enter consumption age. Regional broadcasters such as Televisa and MBC modernize legacy libraries through hybrid AVOD models that keep advertiser funds within domestic ecosystems. Payment innovation spanning mobile wallets, cash top-ups, and telco billing further expands reach. As fiber and 5G deployments gain momentum, these regions could stretch their contribution to global OTT market revenue in the next decade.
- Netflix Inc.
- Google LLC (YouTube)
- Amazon.com Inc. (Prime Video)
- The Walt Disney Company (Disney+ & Hulu)
- Tencent Holdings Ltd (Tencent Video)
- Apple Inc. (Apple TV+)
- Warner Bros. Discovery (Max)
- Comcast Corp. (Peacock)
- Paramount Global (Paramount+)
- DAZN Group Ltd.
- Roku Inc.
- PCCW Media Group (Viu)
- Baidu Inc. (iQIYI)
- Alibaba Pictures (Youku Tudou)
- Zee Entertainment (ZEE5)
- Viacom18 Media (JioCinema)
- MBC Group (Shahid)
- Canal+ Group (myCanal)
- Rakuten Group (Rakuten TV)
- NHK World-Japan
Additional Benefits:
- The market estimate (ME) sheet in Excel format
- 3 months of analyst support
TABLE OF CONTENTS
1 INTRODUCTION
- 1.1 Study Assumptions and Market Definition
- 1.2 Scope of the Study
2 RESEARCH METHODOLOGY
3 EXECUTIVE SUMMARY
4 MARKET LANDSCAPE
- 4.1 Market Overview
- 4.2 Market Drivers
- 4.2.1 Bundled telco-OTT partnerships accelerating low-ARPU subscriber uptake in South & Southeast Asia
- 4.2.2 Record live-sports media rights inflation driving premium pricing for D2C OTT in North America & Europe
- 4.2.3 Connected-TV advertising demand shift fueling AVOD & FAST revenue growth in US & UK
- 4.2.4 Government domestic-content quotas (EU 30% rule, etc.) stimulating local originals spend
- 4.3 Market Restraints
- 4.3.1 Escalating content-acquisition costs eroding profitability in mature SVOD markets
- 4.3.2 High churn amid subscription stacking in North America
- 4.4 Industry Ecosystem Analysis
- 4.5 Regulatory Outlook
- 4.6 Porter's Five Forces Analysis
- 4.6.1 Threat of New Entrants
- 4.6.2 Bargaining Power of Buyers
- 4.6.3 Bargaining Power of Suppliers
- 4.6.4 Threat of Substitutes
- 4.6.5 Intensity of Competitive Rivalry
- 4.7 Impact of Macro-Economic Factors on the OTT and TV Industry
5 MARKET SIZE AND GROWTH FORECASTS (VALUE)
- 5.1 By Service Type
- 5.1.1 SVOD
- 5.1.2 AVOD
- 5.1.3 TVOD
- 5.1.4 Hybrid (Subscription + Ads)
- 5.2 By Device Platform
- 5.2.1 Smartphones and Tablets
- 5.2.2 Smart and Connected TVs
- 5.2.3 Laptops and Desktops
- 5.2.4 Streaming Media Players
- 5.2.5 Others
- 5.3 By Content Genre
- 5.3.1 Entertainment and Movies
- 5.3.2 Sports
- 5.3.3 News and Information
- 5.3.4 Education and Learning
- 5.3.5 Others (Documentary, Reality)
- 5.4 By Geography
- 5.4.1 North America
- 5.4.1.1 United States
- 5.4.1.2 Canada
- 5.4.1.3 Mexico
- 5.4.2 South America
- 5.4.2.1 Brazil
- 5.4.2.2 Argentina
- 5.4.2.3 Rest of South America
- 5.4.3 Europe
- 5.4.3.1 Germany
- 5.4.3.2 United Kingdom
- 5.4.3.3 France
- 5.4.3.4 Italy
- 5.4.3.5 Spain
- 5.4.3.6 Rest of Europe
- 5.4.4 Asia-Pacific
- 5.4.4.1 China
- 5.4.4.2 Japan
- 5.4.4.3 South Korea
- 5.4.4.4 India
- 5.4.4.5 Australia
- 5.4.4.6 New Zealand
- 5.4.4.7 Rest of Asia-Pacific
- 5.4.5 Middle East and Africa
- 5.4.5.1 United Arab Emirates
- 5.4.5.2 Saudi Arabia
- 5.4.5.3 South Africa
- 5.4.5.4 Rest of Middle East and Africa
- 5.4.1 North America
6 COMPETITIVE LANDSCAPE
- 6.1 Strategic Developments
- 6.2 Vendor Positioning Analysis
- 6.3 Company Profiles (includes Global level Overview, Market level overview, Core Segments, Financials as available, Strategic Information, Products & Services, and Recent Developments)
- 6.3.1 Netflix Inc.
- 6.3.2 Google LLC (YouTube)
- 6.3.3 Amazon.com Inc. (Prime Video)
- 6.3.4 The Walt Disney Company (Disney+ & Hulu)
- 6.3.5 Tencent Holdings Ltd (Tencent Video)
- 6.3.6 Apple Inc. (Apple TV+)
- 6.3.7 Warner Bros. Discovery (Max)
- 6.3.8 Comcast Corp. (Peacock)
- 6.3.9 Paramount Global (Paramount+)
- 6.3.10 DAZN Group Ltd.
- 6.3.11 Roku Inc.
- 6.3.12 PCCW Media Group (Viu)
- 6.3.13 Baidu Inc. (iQIYI)
- 6.3.14 Alibaba Pictures (Youku Tudou)
- 6.3.15 Zee Entertainment (ZEE5)
- 6.3.16 Viacom18 Media (JioCinema)
- 6.3.17 MBC Group (Shahid)
- 6.3.18 Canal+ Group (myCanal)
- 6.3.19 Rakuten Group (Rakuten TV)
- 6.3.20 NHK World-Japan
7 MARKET OPPORTUNITIES AND FUTURE OUTLOOK
- 7.1 White-Space and Unmet-Need Assessment
 OTT设备和服务市场按设备类型、服务类型、内容类型、收益来源和最终用户划分-2025-2032年全球预测Over-the-Top通讯市场(按内容、设备类型、服务类型、应用和产业)预测 2025-2032
 2025年OTT设备与服务全球市场报告2025年全球OTT串流媒体市场报告
 OTT媒体服务的全球市场
 2025 年至 2033 年按组件、平台类型、部署类型、内容类型、收入模式、服务类型、垂直行业和地区分類的 Over-Top 市场报告Over-the-Top设备和服务市场规模、份额和趋势分析报告:按类型、设备、服务类型、OTT经营模式、平台、地区和细分市场进行预测全球OTT内容市场2025 年至 2033 年日本 Over the Top 市场报告(按组件、平台类型、部署类型、内容类型、收入模式、垂直行业和地区划分)
 全球Over-the-Top(OTT)服务市场:市场规模、份额、趋势分析(按平台、收益模式、服务区域、类型、串流媒体设备和地区)、展望和未来预测(2025-2032 年)