


|
年间契约型资讯服务
商品编码
1765469
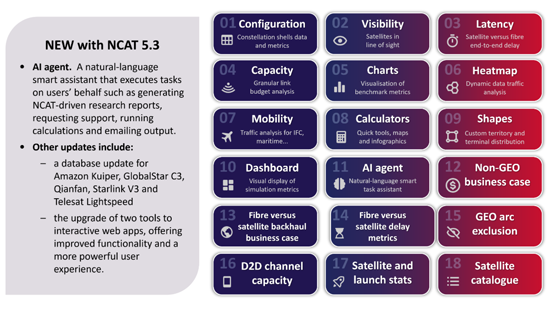
非GEO卫星星系分析Toolkit 5.3Non-GEO Constellations Analysis Toolkit 5.3 |
|||||||
非地球静止轨道 (GEO) 卫星星座分析工具包 (NCAT) 将严谨的资料驱动分析与直觉的使用者体验结合,对低地球轨道 (LEO) 和中地球轨道 (MEO) 卫星星座进行客观评估。
NCAT 透过整合多样化资料集、进阶分析、互动式视觉化和人工智慧 (AI) 功能,为策略家、商业领袖和技术专业人士提供有关非地球静止轨道 (non-GEO) 卫星星座能力和影响的可靠洞察。
NCAT 是一款用户友好的线上 Web 应用程序,可让您直观地了解频宽供需趋势、评估市场可寻址性并验证业务案例敏感性。它还可以对卫星相关数据和发射统计数据进行详细分析。
NCAT 自动计算关键效能指标,并根据卫星星座之间以及与地面网路之间的差异进行基准测试。所有这一切都无需任何技术专业知识。
覆盖范围
基于数万行原始程式码和数百万笔可查询资料库记录,18 个整合工具可提供客观的、资料驱动的卫星星座效能多层次评估。数百万次动态计算透过直觉的介面进行处理,该介面具有可配置的过滤器、可视化控制项和使用者定义的输入。所有输出资料(资料表、图表、视觉化)均可轻鬆下载,以便进一步分析和报告。
特征
- 严谨的编码演算法提供基于事实的分析和视觉化。
- 全面且定期更新的资料库。运行最新的模拟。
- 每日更新:在轨卫星数量和轨道观测数据
- 每週更新(週日):卫星目录
- 每月更新:卫星和发射统计数据
- 季度更新:核心软体与资料库增强功能
- 点击式互动:轻鬆导航互动式地图和控制项(图层、筛选器、按钮、设定等),只需点击几下即可放大和缩小、定位装置以及执行动态计算和视觉化。
- 多轨道、多频段分析:可跨越一个或多个系统的轨道层组合设定模拟,从而同时计算不同频段的数千颗卫星。
- 动态动画显示:显示关键条件的即时传播,包括卫星位置、覆盖范围、可见卫星、天线视角、链路延迟变化以及供需热图。
- 时空控制:NCAT5 支援全球、区域和本地尺度的即时和加速延时分析。模拟速度最高可提高 300 倍,可在约 5 分钟内分析一天的星座表现。
- 六边形地面网格:NCAT5 采用动态六边形网格,精度达到国家级,解析度可配置至城市级(蜂巢半径 9 公里)。 Shapes 工具可让您自订区域,范围超出 NCAT 资料库中预先註册的 250 多个国家和地区。
- 同步 IP 吞吐量运算:NCAT5 会同时对所有使用者和闸道波束执行连结预算吞吐量分析,同时考虑使用者终端和闸道视角的组合。
- 灵活的需求模型:您可以从预先定义的需求标准中进行选择,也可以定义自订需求参数(包括使用者终端分布和频宽需求的功能推动因素),以便根据特定用例自订模拟。
- 需求驱动的供应:NCAT 根据可选的公平性标准模拟可控波束容量的动态重新配置,以使可行的供应与不断变化的需求条件最佳匹配。
- 行动工具:NCAT 透过使用者定义的时间表支援各种行动应用(例如机上 Wi-Fi、铁路、海事、连网汽车)。此外,NCAT 整合了涵盖数万条航线、航空公司和机场的即时商业航班数据,以评估机上连接 (IFC) 的供需动态。
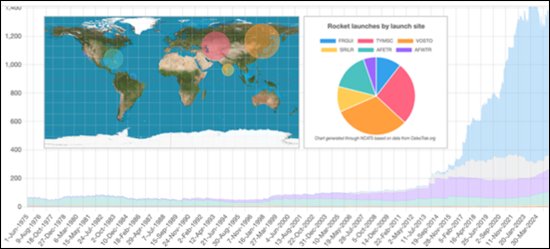
- 统计数据:NCAT5 存取并处理全面的目录数据和卫星发射统计数据,为用户提供可配置的筛选器,用于搜寻自 1957 年以来发射到太空的超过 61,000 个未分类物体的数据。
- 报告:AI 代理工具使用自然语言与 NCAT 内部的工具和资料集无缝交互,以回答查询、建立专业报告并解释模拟结果。
- 可下载的图表和资料:所有图表、地图和资讯图表均可下载为 PDF 或 PNG 格式。输出资料以表格 CSV 格式提供,以便在平台外部进行进一步分析。可下载的内容包括表格、图表资料、地图、基准指标、带有时间戳记的样本、包含供需资料的地面网格、评估摘要、飞行路线、视角统计资料、波束利用率等。
应用 |
NCAT 专注于卫星通讯 (satcom),但也具备评估地球观测 (EO) 和全球导航卫星系统 (GNSS) 的能力。 |
工具 |
18 种可设定工具可进行多维分析和基准测试,例如:
|
星座框架: |
100 多个已运作、已规划和已提交的系统,使用者可编辑和扩展 |
网关: |
超过 370 个已勘测的网关位置(使用者可编辑和扩充) |
地理区域: |
涵盖超过 250 个国家、地区、区域和子区域(使用者可编辑和扩展) |
常见问题
- 覆盖范围、容量和波束是多少当前和未来 NGSO 架构的地面和卫星基准是什么?
- 每个网关、用户波束和卫星的前向和反向链路容量(频谱、频宽、IP 吞吐量)是多少?
- 每个国家可以支援多少个并髮用户?
- 如何决定每兆位元每秒的资本成本?
- 商业案例对太空船製造和发射成本的敏感度如何?
- 在哪些情况下,卫星星座在服务不足地区的表现会优于光纤?
- 回程资本支出与固定成本如何影响商业案例?
- 如何根据可设定的服务计画评估频宽供需?拥塞热点在哪里?
- 不同纬度和轨道层的最大、平均和最小卫星数量是多少?
- 考虑到POP、光学星间链路 (OISL) 和链路中继,光纤延迟与LEO系统相比如何?
- 非GEO系统应采用哪些排除角来避免GEO干扰?
此工具的目标使用者:
- 卫星营运商(GEO、非GEO、FSS、MSS/D2D)
- 卫星製造商和组件供应商
- 地面/无线网路营运商(电信营运商、行动网路营运商、网际网路服务供应商、铁塔营运商、云端服务供应商等)
- 地面系统供应商(终端、天线、集线器/数据机、SD-WAN)
- 电信港营运商、卫星服务供应商、GEO-非GEO整合商
- 主要非GEO容量使用者(政府、国防、航空公司、能源公司等)
- 产业协会、研究机构与研究组织
- 开发虚拟星座软体的IT公司
- 监管机构与频率研究组织
- 金融机构、投资公司
包含的卫星系统(案例)
|
|
NCAT 是一款可在线配置的工具集,包含无限制使用,并预装了主要许可、运营和计划中的非地球静止轨道卫星系统的数据集。
The 'Non-GEO Constellations Analysis Toolkit (NCAT)' combines rigorous, data-driven analysis with an intuitive user experience to deliver objective assessments of low-Earth orbit (LEO) and medium-Earth orbit (MEO) satellite constellations.
NCAT equips strategists, business leaders and technical professionals with reliable insights into the capabilities and impact of non-geostationary (non-GEO) constellations by integrating diverse datasets, advanced analytics, interactive visualisations and AI capabilities.
NCAT is delivered as a user-friendly online web app, and empowers users to seamlessly explore bandwidth supply and demand dynamics, assess market addressability, evaluate business case sensitivities and delve into satellite data and launch statistics. The platform automatically calculates key performance metrics and benchmarks the competitiveness of satellite constellations (both against each other and relative to terrestrial networks), all without requiring deep technical expertise.
Toolkit coverage
18 integrated tools, driven by tens of thousands of lines of original code and millions of queryable database records, provide objective, data-driven assessments of constellation performance at multiple levels. Millions of dynamic calculations are processed via an intuitive interface with configurable filters, visualisation controls and user-defined inputs. All outputs (data tables, charts and visualisations) are easily downloadable for further analysis or reporting.
Features included:
- Rigorously coded algorithms that drive factual analytics and visualisations.
- A comprehensive, regularly updated database. This enables users to run up-to-date simulations.
- Daily: in-orbit satellite counts and orbital observations are updated automatically every day.
- Weekly: the satellite catalogue is updated automatically each Sunday.
- Monthly: satellite and launch statistics are refreshed automatically every month.
- quarterly: core software and database enhancements are deployed every quarter.
- Point-and-click interactivity. Users can easily navigate interactive maps and controls (such as layers, filters, buttons and settings) to zoom in and out, set user terminal locations and drive dynamic calculations and visualisations with just a few clicks.
- Multi-orbit, multi-band analysis. Simulations can be configured across combinations of orbital shells from one or multiple systems, thus enabling concurrent calculations for thousands of satellites across different frequency bands.
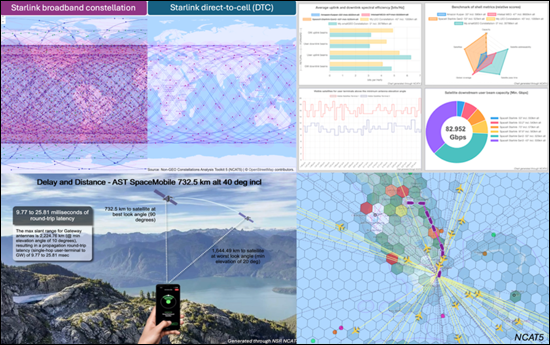
- Dynamic, animated visualisations. Users can view real-time propagation of key conditions, including satellite positions, coverage footprints, visible satellites, antenna look angles, link latency variations and supply-demand heatmaps.
- Space-time controls. NCAT5 supports both real-time and accelerated time-lapse analysis at global, regional or local scales. Simulations can be sped up by up to 300x, enabling users to analyse a full day of constellation performance in around 5 minutes.
- Hexagonal ground grid. NCAT5 employs a dynamic hexagonal grid with country-level precision, configurable down to city-scale resolution (~9 km cell radius). The 'Shapes' tool enables users to define custom geographical areas beyond the 250+ countries and regions preloaded in the NCAT database.
- Concurrent IP throughput computations. NCAT5 performs concurrent link-budget throughput analysis across all user and gateway beams, accounting for combinations of user-terminal and gateway look angles.
- Flexible demand models. The toolset enables users to choose from pre-set demand criteria or define custom demand parameters (including user terminal distribution and functional drivers of bandwidth demand) to tailor simulations to specific use cases.
- Demand-driven supply. NCAT simulates dynamic reconfigurations of steerable beam capacity based on selectable fairness criteria to optimally match feasible supply with changing demand conditions.
- Mobility tool. NCAT supports a wide range of mobility applications (such as in-flight Wi-Fi, rail, maritime and connected vehicles) through user-defined schedules. Additionally, NCAT integrates real-time commercial flight data, covering tens of thousands of routes, airlines and airports, to assess in-flight connectivity (IFC) supply and demand dynamics.
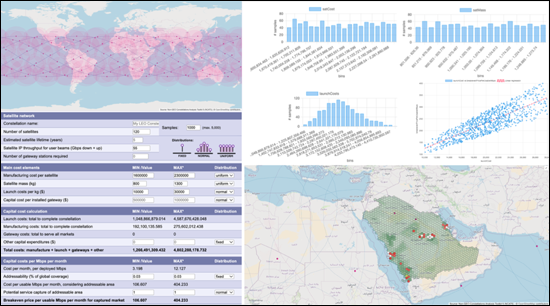
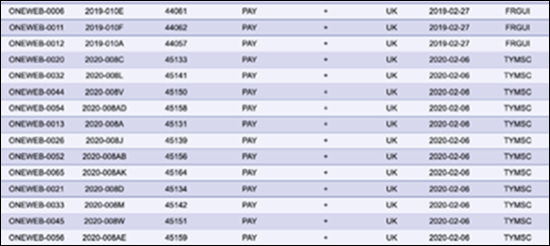
- Statistics. NCAT5 accesses and processes comprehensive catalogued data and satellite launch statistics, presenting users with configurable filters to explore data for over 61 000 unclassified objects launched into space since 1957.
- Report generation. The AI Agent tool uses natural language to interact seamlessly with internal NCAT tools and datasets, enabling it to answer queries, generate professional reports and interpret simulation results.
- Downloadable charts and data. All charts, maps and infographics can be downloaded in PDF or PNG format. Output data is available in tabular CSV format, enabling further analysis outside the platform. Downloadable content includes tables, chart data, maps, benchmark metrics, time-stamped samples, terrestrial grids with supply and demand data, assessment summaries, flight routes, look angle statistics, beam utilisation and more.
Applications: |
NCAT is focused on satellite communications (satcom) but includes features to assess Earth observation (EO) and global navigation satellite systems (GNSS). |
Tools: |
18 configurable tools to analyse and benchmark systems from multiple angles, including:
|
Constellation shells: |
100+ operational, planned and filed systems included (user editable and expandable). |
Gateways: |
370+ surveyed gateway locations (user editable and expandable). |
Geographical regions: |
250+ countries, territories, regions and subregions included (user editable and expandable). |
Questions answered:
- How do current and future NGSO architectures benchmark across coverage, capacity, beam, and satellites?
- What is the forward and return link capacity (spectrum, bandwidth and IP throughput) per gateway, user beam and satellite?
- How many users can constellations support simultaneously, by country or territory?
- How can the capital cost per usable megabits per second be determined?
- What is the business-case sensitivity to spacecraft manufacturing and launch costs?
- When can satcom constellations outperform fibre-optics in underserved communities?
- How does backhaul capex and opex affect the business case?
- How can bandwidth supply and demand be assessed, based on configurable service plans, and where are the congestion hotspots?
- What is the maximum, average and minimum number of satellites in view or line of sight at different latitudes and orbital shells?
- How does fibre latency compare with that of LEO systems, factoring in POPs, optical inter-satellite links (OISLs) and link relays?
- What are the regulatory exclusion angles for non-GEO systems to avoid GEO interference?
Who should use this toolbox:
- Satellite operators (GEO, non-GEO, FSS and MSS/D2D)
- Spacecraft manufacturers and component vendors
- Terrestrial/wireless network operators (telecoms operators, MNOs, ISPs, towercos, cloud services providers and so on)
- Ground system vendors (terminals, antennas, hub/modems and SD-WAN)
- Teleport operators, satellite service providers and GEO-non-GEO integrators
- Major non-GEO capacity users (such as governments, defence players, airlines and energy companies)
- Industry associations, research labs and institutions
- IT companies developing virtualised constellation software
- Regulators and spectrum research agencies
- Financial institutions and investment firms
Satellite systems included (examples):
|
|
As an online configurable toolset, NCAT has unlimited usability and is delivered pre-populated with datasets for leading non-GEO systems, including granted, operating and proposed systems.
