


 |
市场调查报告书
商品编码
1298213
自由空间光通信市场:按平台、按组件、按应用:2021-2031 年全球机会分析和行业预测Free Space Optic Communication Market By Platform, By Component, By Application : Global Opportunity Analysis and Industry Forecast, 2021-2031 |
||||||
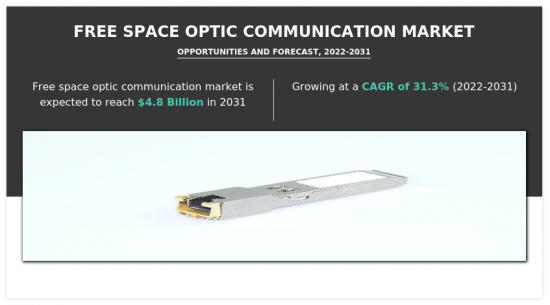
预计2021年自由空间光通信市场规模将达到3.4754亿美元,2031年将达到47.8796亿美元,复合年增长率为31.26%。
自由空间光学 (FSO) 通信是一种无线数据传输,可通过自由空间投射调製光束,而无需使用光纤或其他光学系统引导光。 这种类型的通信系统在陆地和非陆地网络中实现快速、安全的连接方面具有独特的价值。 自由空间光学的总体思想依赖于光束的不可见且安全的传输。 该光束由激光发射并聚焦在高灵敏度光子探测器上,该探测器充当带有长焦镜头的接收器。 FSO链路的结构非常简单,通常由两个相同的头组成,允许双数据传输。 这些头要么通过接口直接连接到计算机,要么连接到通信网络。
本报告的研究范围讨论了主要参与者进入自由空间光通信市场的潜在机会。 此外,它还提供了对市场的深入分析,概述了当前趋势、关键驱动因素和关键投资领域。 该报告包括波特的五力分析,以了解行业的竞争场景以及价值链中每个利益相关者的角色。 此外,它还包括主要市场参与者为维持市场立足点而采取的策略。
内容
第一章简介
第 2 章执行摘要
第三章市场概述
- 市场定义和范围
- 主要发现
- 影响因素
- 主要投资机会
- 波特五力分析
- 供应商的议价能力
- 买家的议价能力
- 替代品的威胁
- 新进入者的威胁
- 竞争强度
- 市场动态
- 协调员
- 通过增加军事应用中自由空间光通信技术的采用来激活市场
- 更多地采用自由空间光通信系统进行数据传输
- 制约因素
- 二氧化碳和水分子造成的大气损失
- 机会
- 出色的数据传输安全性促进了 FSO 通信在 IT 和电信行业的采用
- 协调员
- COVID-19 对市场的影响分析
第 4 章自由空间光通信市场:按平台
- 概述
- 市场规模和预测
- 外太空
- 主要市场趋势、增长因素和增长机会
- 市场规模和预测:按地区划分
- 市场份额分析:按国家/地区划分
- 飞机
- 主要市场趋势、增长因素和机遇
- 市场规模和预测:按地区划分
- 市场份额分析:按国家/地区划分
- 地面
- 主要市场趋势、增长因素和机遇
- 市场规模和预测:按地区划分
- 市场份额分析:按国家/地区划分
第 5 章自由空间光通信市场:按组成部分
- 概述
- 市场规模和预测
- 发射器
- 主要市场趋势、增长因素、增长机会
- 市场规模和预测:按地区划分
- 市场份额分析:按国家/地区划分
- 收发器
- 主要市场趋势、增长动力和机遇
- 市场规模和预测:按地区划分
- 市场份额分析:按国家/地区划分
- 接收器
- 主要市场趋势、增长因素和机遇
- 市场规模和预测:按地区划分
- 市场份额分析:按国家/地区划分
- 其他
- 主要市场趋势、增长因素和机遇
- 市场规模和预测:按地区划分
- 市场份额分析:按国家/地区划分
第 6 章自由空间光通信市场:按应用分类
- 概述
- 市场规模和预测
- 移动回程
- 主要市场趋势、增长因素、增长机会
- 市场规模和预测:按地区划分
- 市场份额分析:按国家/地区划分
- 灾难恢復
- 主要市场趋势、增长因素和机遇
- 市场规模和预测:按地区划分
- 市场份额分析:按国家/地区划分
- 企业联繫
- 主要市场趋势、增长因素和机遇
- 市场规模和预测:按地区划分
- 市场份额分析:按国家/地区划分
- 防御
- 主要市场趋势、增长因素和机遇
- 市场规模和预测:按地区划分
- 市场份额分析:按国家/地区划分
- 卫星
- 主要市场趋势、增长因素和机遇
- 市场规模和预测:按地区划分
- 市场份额分析:按国家/地区划分
- 其他
- 主要市场趋势、增长因素和机遇
- 市场规模和预测:按地区划分
- 市场份额分析:按国家/地区划分
第 7 章:自由空间光通信市场:按地区
- 概述
- 市场规模和预测:按地区划分
- 北美
- 主要趋势和机遇
- 市场规模和预测:按平台划分
- 市场规模和预测:按组成部分
- 市场规模和预测:按应用分类
- 市场规模/预测:按国家/地区划分
- 美国
- 主要市场趋势、增长因素和增长机会
- 市场规模和预测:按平台划分
- 市场规模和预测:按组成部分
- 市场规模和预测:按应用分类
- 加拿大
- 主要市场趋势、增长动力和机遇
- 市场规模和预测:按平台划分
- 市场规模和预测:按组成部分
- 市场规模和预测:按应用分类
- 墨西哥
- 主要市场趋势、增长动力和机遇
- 市场规模和预测:按平台划分
- 市场规模和预测:按组成部分
- 市场规模和预测:按应用分类
- 欧洲
- 主要趋势和机遇
- 市场规模和预测:按平台划分
- 市场规模和预测:按组成部分
- 市场规模和预测:按应用分类
- 市场规模/预测:按国家/地区划分
- 英国
- 主要市场趋势、增长因素、增长机会
- 市场规模和预测:按平台划分
- 市场规模和预测:按组成部分
- 市场规模和预测:按应用分类
- 德国
- 主要市场趋势、增长动力和机遇
- 市场规模和预测:按平台划分
- 市场规模和预测:按组成部分
- 市场规模和预测:按应用分类
- 法国
- 主要市场趋势、增长动力和机遇
- 市场规模和预测:按平台划分
- 市场规模和预测:按组成部分
- 市场规模和预测:按应用分类
- 欧洲其他地区
- 主要市场趋势、增长动力和机遇
- 市场规模和预测:按平台划分
- 市场规模和预测:按组成部分
- 市场规模和预测:按应用分类
- 亚太地区
- 主要趋势和机遇
- 市场规模和预测:按平台划分
- 市场规模和预测:按组成部分
- 市场规模和预测:按应用分类
- 市场规模/预测:按国家/地区划分
- 中国
- 主要市场趋势、增长因素、增长机会
- 市场规模和预测:按平台划分
- 市场规模和预测:按组成部分
- 市场规模和预测:按应用分类
- 日本
- 主要市场趋势、增长因素、增长机会
- 市场规模和预测:按平台划分
- 市场规模和预测:按组成部分
- 市场规模和预测:按应用分类
- 印度
- 主要市场趋势、增长因素和机遇
- 市场规模和预测:按平台划分
- 市场规模和预测:按组成部分
- 市场规模和预测:按应用分类
- 韩国
- 主要市场趋势、增长动力和机遇
- 市场规模和预测:按平台划分
- 市场规模和预测:按组成部分
- 市场规模和预测:按应用分类
- 亚太地区其他地区
- 主要市场趋势、增长动力和机遇
- 市场规模和预测:按平台划分
- 市场规模和预测:按组成部分
- 市场规模和预测:按应用分类
- 拉丁美洲/中东/非洲
- 主要趋势和机遇
- 市场规模和预测:按平台划分
- 市场规模和预测:按组成部分
- 市场规模和预测:按应用分类
- 市场规模/预测:按国家/地区划分
- 拉丁美洲
- 主要市场趋势、增长因素、增长机会
- 市场规模和预测:按平台划分
- 市场规模和预测:按组成部分
- 市场规模和预测:按应用分类
- 中东
- 主要市场趋势、增长动力和机遇
- 市场规模和预测:按平台划分
- 市场规模和预测:按组成部分
- 市场规模和预测:按应用分类
- 非洲
- 主要市场趋势、增长动力和机遇
- 市场规模和预测:按平台划分
- 市场规模和预测:按组成部分
- 市场规模和预测:按应用分类
第 8 章竞争格局
- 简介
- 关键成功策略
- 10家主要公司的产品图谱
- 竞赛仪表板
- 比赛热图
- 2021 年关键人物定位
第 9 章公司简介
- EC System
- FSONA Networks Corporation
- Axiom Optics
- Wireless Excellence Limited
- QinetiQ Group plc
- ViaSat, Inc.
- Mostcom JSC
- mynaric
- Collinear
- Plaintree Systems Inc.
The free space optic communication market size was valued at $347.54 million in 2021, and is projected to reach $4,787.96 million by 2031, registering a CAGR of 31.26%. Free space optic (FSO) communication is the wireless transmission of data via a modulated optical beam directed through free space, without fiber optics or other optical systems guiding the light. These types of communication systems are uniquely valuable in enabling fast and secure connectivity, both in terrestrial and non-terrestrial networks. The general idea of free-space optics relies on the transmission of invisible, eye-safe light beams. They are transmitted by a laser with light focused onto a highly sensitive photon detector, which serves as a receiver, equipped with a telescopic lens. FSO links have quite a simple construction, typically consisting of two identical heads enabling duplex data transmission. These heads are connected via interfaces directly to computers or with a telecommunications network.
The scope of the report discusses the potential opportunities for the key players to enter the free space optic communication market. Furthermore, it provides an in-depth analysis of the market, outlining current trends, key driving factors, and key areas of investment. The report includes Porter's five forces analysis to understand the competitive scenario of the industry and role of each stakeholder in the value chain. Moreover, it features the strategies adopted by key market players to maintain their foothold in the market.
The free space optic communication market is segmented on the basis of platform, component, application, and region. On the basis of platform, it is segmented into ground, space, and airborne. On the basis of component, the market is segmented into transmitter, transceiver, receiver, and others. In terms of application, the market is segmented into mobile backhaul, disaster recovery, enterprise connectivity, defense, satellite, and others. In terms of region, the market is divided into North America, Europe, Asia-Pacific, and LAMEA.
The free space optic communication market is driven by the increase in demand for high-speed data transmission, need for secure communication channels, and rise in adoption of 5G technology. FSO communication systems can achieve data rates of up to several gigabits per second, making them suitable for applications such as mobile backhaul, enterprise connectivity, healthcare, defense, and security. The free space optic communication market is expected to grow at a significant pace during the forecast period owing to the surge in need for reliable and quick wireless communication as well as increase in demand for widespread digital connectivity.
The free space optic communication market players profiled in the report include: EC System, FSONA Networks Corp., Axiom Optics, Wireless Excellence Limited, QinetiQ, ViaSat, Inc., Mostcom JSC, Mynaric, Collinear and Plaintree Systems Inc. These key players adopt several strategies such as new product launch and development, acquisition, partnership and collaboration and business expansion to increase their market share in the global digital multimeter market during the forecast period.
Key Benefits For Stakeholders
- This report provides a quantitative analysis of the market segments, current trends, estimations, and dynamics of the free space optic communication market analysis from 2021 to 2031 to identify the prevailing free space optic communication market opportunities.
- The market research is offered along with information related to key drivers, restraints, and opportunities.
- Porter's five forces analysis highlights the potency of buyers and suppliers to enable stakeholders make profit-oriented business decisions and strengthen their supplier-buyer network.
- In-depth analysis of the free space optic communication market segmentation assists to determine the prevailing market opportunities.
- Major countries in each region are mapped according to their revenue contribution to the global market.
- Market player positioning facilitates benchmarking and provides a clear understanding of the present position of the market players.
- The report includes the analysis of the regional as well as global free space optic communication market trends, key players, market segments, application areas, and market growth strategies.
Key Market Segments
By Platform
- Space
- Airborne
- Ground
By Component
- Transmitter
- Transceiver
- Receiver
- Others
By Application
- Mobile Backhaul
- Disaster Recovery
- Enterprise Connectivity
- Defense
- Satellite
- Others
By Region
- North America
- U.S.
- Canada
- Mexico
- Europe
- UK
- Germany
- France
- Rest of Europe
- Asia-Pacific
- China
- Japan
- India
- South Korea
- Rest of Asia-Pacific
- LAMEA
- Latin America
- Middle East
- Africa
Key Market Players:
- ViaSat, Inc.
- mynaric
- Axiom Optics
- Wireless Excellence Limited
- Plaintree Systems Inc.
- QinetiQ Group plc
- Mostcom JSC
- FSONA Networks Corporation
- Collinear
- EC System
TABLE OF CONTENTS
CHAPTER 1: INTRODUCTION
- 1.1. Report description
- 1.2. Key market segments
- 1.3. Key benefits to the stakeholders
- 1.4. Research Methodology
- 1.4.1. Primary research
- 1.4.2. Secondary research
- 1.4.3. Analyst tools and models
CHAPTER 2: EXECUTIVE SUMMARY
- 2.1. CXO Perspective
CHAPTER 3: MARKET OVERVIEW
- 3.1. Market definition and scope
- 3.2. Key findings
- 3.2.1. Top impacting factors
- 3.2.2. Top investment pockets
- 3.3. Porter's five forces analysis
- 3.3.1. Bargaining power of suppliers
- 3.3.2. Bargaining power of buyers
- 3.3.3. Threat of substitutes
- 3.3.4. Threat of new entrants
- 3.3.5. Intensity of rivalry
- 3.4. Market dynamics
- 3.4.1. Drivers
- 3.4.1.1. Increase in adoption of free space optic communication technology in military applications to fuel market
- 3.4.1.2. Increase in adoption of free space optic communication system for data transmission
- 3.4.1. Drivers
- 3.4.2. Restraints
- 3.4.2.1. Atmospheric loss due to carbon dioxide and water molecules
- 3.4.3. Opportunities
- 3.4.3.1. Superior data transmission security boosts adoption of FSO communication in it and telecommunication industry
- 3.5. COVID-19 Impact Analysis on the market
CHAPTER 4: FREE SPACE OPTIC COMMUNICATION MARKET, BY PLATFORM
- 4.1. Overview
- 4.1.1. Market size and forecast
- 4.2. Space
- 4.2.1. Key market trends, growth factors and opportunities
- 4.2.2. Market size and forecast, by region
- 4.2.3. Market share analysis by country
- 4.3. Airborne
- 4.3.1. Key market trends, growth factors and opportunities
- 4.3.2. Market size and forecast, by region
- 4.3.3. Market share analysis by country
- 4.4. Ground
- 4.4.1. Key market trends, growth factors and opportunities
- 4.4.2. Market size and forecast, by region
- 4.4.3. Market share analysis by country
CHAPTER 5: FREE SPACE OPTIC COMMUNICATION MARKET, BY COMPONENT
- 5.1. Overview
- 5.1.1. Market size and forecast
- 5.2. Transmitter
- 5.2.1. Key market trends, growth factors and opportunities
- 5.2.2. Market size and forecast, by region
- 5.2.3. Market share analysis by country
- 5.3. Transceiver
- 5.3.1. Key market trends, growth factors and opportunities
- 5.3.2. Market size and forecast, by region
- 5.3.3. Market share analysis by country
- 5.4. Receiver
- 5.4.1. Key market trends, growth factors and opportunities
- 5.4.2. Market size and forecast, by region
- 5.4.3. Market share analysis by country
- 5.5. Others
- 5.5.1. Key market trends, growth factors and opportunities
- 5.5.2. Market size and forecast, by region
- 5.5.3. Market share analysis by country
CHAPTER 6: FREE SPACE OPTIC COMMUNICATION MARKET, BY APPLICATION
- 6.1. Overview
- 6.1.1. Market size and forecast
- 6.2. Mobile Backhaul
- 6.2.1. Key market trends, growth factors and opportunities
- 6.2.2. Market size and forecast, by region
- 6.2.3. Market share analysis by country
- 6.3. Disaster Recovery
- 6.3.1. Key market trends, growth factors and opportunities
- 6.3.2. Market size and forecast, by region
- 6.3.3. Market share analysis by country
- 6.4. Enterprise Connectivity
- 6.4.1. Key market trends, growth factors and opportunities
- 6.4.2. Market size and forecast, by region
- 6.4.3. Market share analysis by country
- 6.5. Defense
- 6.5.1. Key market trends, growth factors and opportunities
- 6.5.2. Market size and forecast, by region
- 6.5.3. Market share analysis by country
- 6.6. Satellite
- 6.6.1. Key market trends, growth factors and opportunities
- 6.6.2. Market size and forecast, by region
- 6.6.3. Market share analysis by country
- 6.7. Others
- 6.7.1. Key market trends, growth factors and opportunities
- 6.7.2. Market size and forecast, by region
- 6.7.3. Market share analysis by country
CHAPTER 7: FREE SPACE OPTIC COMMUNICATION MARKET, BY REGION
- 7.1. Overview
- 7.1.1. Market size and forecast By Region
- 7.2. North America
- 7.2.1. Key trends and opportunities
- 7.2.2. Market size and forecast, by Platform
- 7.2.3. Market size and forecast, by Component
- 7.2.4. Market size and forecast, by Application
- 7.2.5. Market size and forecast, by country
- 7.2.5.1. U.S.
- 7.2.5.1.1. Key market trends, growth factors and opportunities
- 7.2.5.1.2. Market size and forecast, by Platform
- 7.2.5.1.3. Market size and forecast, by Component
- 7.2.5.1.4. Market size and forecast, by Application
- 7.2.5.2. Canada
- 7.2.5.2.1. Key market trends, growth factors and opportunities
- 7.2.5.2.2. Market size and forecast, by Platform
- 7.2.5.2.3. Market size and forecast, by Component
- 7.2.5.2.4. Market size and forecast, by Application
- 7.2.5.3. Mexico
- 7.2.5.3.1. Key market trends, growth factors and opportunities
- 7.2.5.3.2. Market size and forecast, by Platform
- 7.2.5.3.3. Market size and forecast, by Component
- 7.2.5.3.4. Market size and forecast, by Application
- 7.3. Europe
- 7.3.1. Key trends and opportunities
- 7.3.2. Market size and forecast, by Platform
- 7.3.3. Market size and forecast, by Component
- 7.3.4. Market size and forecast, by Application
- 7.3.5. Market size and forecast, by country
- 7.3.5.1. UK
- 7.3.5.1.1. Key market trends, growth factors and opportunities
- 7.3.5.1.2. Market size and forecast, by Platform
- 7.3.5.1.3. Market size and forecast, by Component
- 7.3.5.1.4. Market size and forecast, by Application
- 7.3.5.2. Germany
- 7.3.5.2.1. Key market trends, growth factors and opportunities
- 7.3.5.2.2. Market size and forecast, by Platform
- 7.3.5.2.3. Market size and forecast, by Component
- 7.3.5.2.4. Market size and forecast, by Application
- 7.3.5.3. France
- 7.3.5.3.1. Key market trends, growth factors and opportunities
- 7.3.5.3.2. Market size and forecast, by Platform
- 7.3.5.3.3. Market size and forecast, by Component
- 7.3.5.3.4. Market size and forecast, by Application
- 7.3.5.4. Rest of Europe
- 7.3.5.4.1. Key market trends, growth factors and opportunities
- 7.3.5.4.2. Market size and forecast, by Platform
- 7.3.5.4.3. Market size and forecast, by Component
- 7.3.5.4.4. Market size and forecast, by Application
- 7.4. Asia-Pacific
- 7.4.1. Key trends and opportunities
- 7.4.2. Market size and forecast, by Platform
- 7.4.3. Market size and forecast, by Component
- 7.4.4. Market size and forecast, by Application
- 7.4.5. Market size and forecast, by country
- 7.4.5.1. China
- 7.4.5.1.1. Key market trends, growth factors and opportunities
- 7.4.5.1.2. Market size and forecast, by Platform
- 7.4.5.1.3. Market size and forecast, by Component
- 7.4.5.1.4. Market size and forecast, by Application
- 7.4.5.2. Japan
- 7.4.5.2.1. Key market trends, growth factors and opportunities
- 7.4.5.2.2. Market size and forecast, by Platform
- 7.4.5.2.3. Market size and forecast, by Component
- 7.4.5.2.4. Market size and forecast, by Application
- 7.4.5.3. India
- 7.4.5.3.1. Key market trends, growth factors and opportunities
- 7.4.5.3.2. Market size and forecast, by Platform
- 7.4.5.3.3. Market size and forecast, by Component
- 7.4.5.3.4. Market size and forecast, by Application
- 7.4.5.4. South Korea
- 7.4.5.4.1. Key market trends, growth factors and opportunities
- 7.4.5.4.2. Market size and forecast, by Platform
- 7.4.5.4.3. Market size and forecast, by Component
- 7.4.5.4.4. Market size and forecast, by Application
- 7.4.5.5. Rest of Asia-Pacific
- 7.4.5.5.1. Key market trends, growth factors and opportunities
- 7.4.5.5.2. Market size and forecast, by Platform
- 7.4.5.5.3. Market size and forecast, by Component
- 7.4.5.5.4. Market size and forecast, by Application
- 7.5. LAMEA
- 7.5.1. Key trends and opportunities
- 7.5.2. Market size and forecast, by Platform
- 7.5.3. Market size and forecast, by Component
- 7.5.4. Market size and forecast, by Application
- 7.5.5. Market size and forecast, by country
- 7.5.5.1. Latin America
- 7.5.5.1.1. Key market trends, growth factors and opportunities
- 7.5.5.1.2. Market size and forecast, by Platform
- 7.5.5.1.3. Market size and forecast, by Component
- 7.5.5.1.4. Market size and forecast, by Application
- 7.5.5.2. Middle East
- 7.5.5.2.1. Key market trends, growth factors and opportunities
- 7.5.5.2.2. Market size and forecast, by Platform
- 7.5.5.2.3. Market size and forecast, by Component
- 7.5.5.2.4. Market size and forecast, by Application
- 7.5.5.3. Africa
- 7.5.5.3.1. Key market trends, growth factors and opportunities
- 7.5.5.3.2. Market size and forecast, by Platform
- 7.5.5.3.3. Market size and forecast, by Component
- 7.5.5.3.4. Market size and forecast, by Application
CHAPTER 8: COMPETITIVE LANDSCAPE
- 8.1. Introduction
- 8.2. Top winning strategies
- 8.3. Product Mapping of Top 10 Player
- 8.4. Competitive Dashboard
- 8.5. Competitive Heatmap
- 8.6. Top player positioning, 2021
CHAPTER 9: COMPANY PROFILES
- 9.1. EC System
- 9.1.1. Company overview
- 9.1.2. Key Executives
- 9.1.3. Company snapshot
- 9.1.4. Operating business segments
- 9.1.5. Product portfolio
- 9.2. FSONA Networks Corporation
- 9.2.1. Company overview
- 9.2.2. Key Executives
- 9.2.3. Company snapshot
- 9.2.4. Operating business segments
- 9.2.5. Product portfolio
- 9.3. Axiom Optics
- 9.3.1. Company overview
- 9.3.2. Key Executives
- 9.3.3. Company snapshot
- 9.3.4. Operating business segments
- 9.3.5. Product portfolio
- 9.4. Wireless Excellence Limited
- 9.4.1. Company overview
- 9.4.2. Key Executives
- 9.4.3. Company snapshot
- 9.4.4. Operating business segments
- 9.4.5. Product portfolio
- 9.5. QinetiQ Group plc
- 9.5.1. Company overview
- 9.5.2. Key Executives
- 9.5.3. Company snapshot
- 9.5.4. Operating business segments
- 9.5.5. Product portfolio
- 9.5.6. Business performance
- 9.5.7. Key strategic moves and developments
- 9.6. ViaSat, Inc.
- 9.6.1. Company overview
- 9.6.2. Key Executives
- 9.6.3. Company snapshot
- 9.6.4. Operating business segments
- 9.6.5. Product portfolio
- 9.6.6. Business performance
- 9.7. Mostcom JSC
- 9.7.1. Company overview
- 9.7.2. Key Executives
- 9.7.3. Company snapshot
- 9.7.4. Operating business segments
- 9.7.5. Product portfolio
- 9.8. mynaric
- 9.8.1. Company overview
- 9.8.2. Key Executives
- 9.8.3. Company snapshot
- 9.8.4. Operating business segments
- 9.8.5. Product portfolio
- 9.8.6. Business performance
- 9.8.7. Key strategic moves and developments
- 9.9. Collinear
- 9.9.1. Company overview
- 9.9.2. Key Executives
- 9.9.3. Company snapshot
- 9.9.4. Operating business segments
- 9.9.5. Product portfolio
- 9.9.6. Business performance
- 9.10. Plaintree Systems Inc.
- 9.10.1. Company overview
- 9.10.2. Key Executives
- 9.10.3. Company snapshot
- 9.10.4. Operating business segments
- 9.10.5. Product portfolio
- 9.10.6. Business performance
LIST OF TABLES
- TABLE 01. GLOBAL FREE SPACE OPTIC COMMUNICATION MARKET, BY PLATFORM, 2021-2031 ($MILLION)
- TABLE 02. FREE SPACE OPTIC COMMUNICATION MARKET FOR SPACE, BY REGION, 2021-2031 ($MILLION)
- TABLE 03. FREE SPACE OPTIC COMMUNICATION MARKET FOR AIRBORNE, BY REGION, 2021-2031 ($MILLION)
- TABLE 04. FREE SPACE OPTIC COMMUNICATION MARKET FOR GROUND, BY REGION, 2021-2031 ($MILLION)
- TABLE 05. GLOBAL FREE SPACE OPTIC COMMUNICATION MARKET, BY COMPONENT, 2021-2031 ($MILLION)
- TABLE 06. FREE SPACE OPTIC COMMUNICATION MARKET FOR TRANSMITTER, BY REGION, 2021-2031 ($MILLION)
- TABLE 07. FREE SPACE OPTIC COMMUNICATION MARKET FOR TRANSCEIVER, BY REGION, 2021-2031 ($MILLION)
- TABLE 08. FREE SPACE OPTIC COMMUNICATION MARKET FOR RECEIVER, BY REGION, 2021-2031 ($MILLION)
- TABLE 09. FREE SPACE OPTIC COMMUNICATION MARKET FOR OTHERS, BY REGION, 2021-2031 ($MILLION)
- TABLE 10. GLOBAL FREE SPACE OPTIC COMMUNICATION MARKET, BY APPLICATION, 2021-2031 ($MILLION)
- TABLE 11. FREE SPACE OPTIC COMMUNICATION MARKET FOR MOBILE BACKHAUL, BY REGION, 2021-2031 ($MILLION)
- TABLE 12. FREE SPACE OPTIC COMMUNICATION MARKET FOR DISASTER RECOVERY, BY REGION, 2021-2031 ($MILLION)
- TABLE 13. FREE SPACE OPTIC COMMUNICATION MARKET FOR ENTERPRISE CONNECTIVITY, BY REGION, 2021-2031 ($MILLION)
- TABLE 14. FREE SPACE OPTIC COMMUNICATION MARKET FOR DEFENSE, BY REGION, 2021-2031 ($MILLION)
- TABLE 15. FREE SPACE OPTIC COMMUNICATION MARKET FOR SATELLITE, BY REGION, 2021-2031 ($MILLION)
- TABLE 16. FREE SPACE OPTIC COMMUNICATION MARKET FOR OTHERS, BY REGION, 2021-2031 ($MILLION)
- TABLE 17. FREE SPACE OPTIC COMMUNICATION MARKET, BY REGION, 2021-2031 ($MILLION)
- TABLE 18. NORTH AMERICA FREE SPACE OPTIC COMMUNICATION MARKET, BY PLATFORM, 2021-2031 ($MILLION)
- TABLE 19. NORTH AMERICA FREE SPACE OPTIC COMMUNICATION MARKET, BY COMPONENT, 2021-2031 ($MILLION)
- TABLE 20. NORTH AMERICA FREE SPACE OPTIC COMMUNICATION MARKET, BY APPLICATION, 2021-2031 ($MILLION)
- TABLE 21. NORTH AMERICA FREE SPACE OPTIC COMMUNICATION MARKET, BY COUNTRY, 2021-2031 ($MILLION)
- TABLE 22. U.S. FREE SPACE OPTIC COMMUNICATION MARKET, BY PLATFORM, 2021-2031 ($MILLION)
- TABLE 23. U.S. FREE SPACE OPTIC COMMUNICATION MARKET, BY COMPONENT, 2021-2031 ($MILLION)
- TABLE 24. U.S. FREE SPACE OPTIC COMMUNICATION MARKET, BY APPLICATION, 2021-2031 ($MILLION)
- TABLE 25. CANADA FREE SPACE OPTIC COMMUNICATION MARKET, BY PLATFORM, 2021-2031 ($MILLION)
- TABLE 26. CANADA FREE SPACE OPTIC COMMUNICATION MARKET, BY COMPONENT, 2021-2031 ($MILLION)
- TABLE 27. CANADA FREE SPACE OPTIC COMMUNICATION MARKET, BY APPLICATION, 2021-2031 ($MILLION)
- TABLE 28. MEXICO FREE SPACE OPTIC COMMUNICATION MARKET, BY PLATFORM, 2021-2031 ($MILLION)
- TABLE 29. MEXICO FREE SPACE OPTIC COMMUNICATION MARKET, BY COMPONENT, 2021-2031 ($MILLION)
- TABLE 30. MEXICO FREE SPACE OPTIC COMMUNICATION MARKET, BY APPLICATION, 2021-2031 ($MILLION)
- TABLE 31. EUROPE FREE SPACE OPTIC COMMUNICATION MARKET, BY PLATFORM, 2021-2031 ($MILLION)
- TABLE 32. EUROPE FREE SPACE OPTIC COMMUNICATION MARKET, BY COMPONENT, 2021-2031 ($MILLION)
- TABLE 33. EUROPE FREE SPACE OPTIC COMMUNICATION MARKET, BY APPLICATION, 2021-2031 ($MILLION)
- TABLE 34. EUROPE FREE SPACE OPTIC COMMUNICATION MARKET, BY COUNTRY, 2021-2031 ($MILLION)
- TABLE 35. UK FREE SPACE OPTIC COMMUNICATION MARKET, BY PLATFORM, 2021-2031 ($MILLION)
- TABLE 36. UK FREE SPACE OPTIC COMMUNICATION MARKET, BY COMPONENT, 2021-2031 ($MILLION)
- TABLE 37. UK FREE SPACE OPTIC COMMUNICATION MARKET, BY APPLICATION, 2021-2031 ($MILLION)
- TABLE 38. GERMANY FREE SPACE OPTIC COMMUNICATION MARKET, BY PLATFORM, 2021-2031 ($MILLION)
- TABLE 39. GERMANY FREE SPACE OPTIC COMMUNICATION MARKET, BY COMPONENT, 2021-2031 ($MILLION)
- TABLE 40. GERMANY FREE SPACE OPTIC COMMUNICATION MARKET, BY APPLICATION, 2021-2031 ($MILLION)
- TABLE 41. FRANCE FREE SPACE OPTIC COMMUNICATION MARKET, BY PLATFORM, 2021-2031 ($MILLION)
- TABLE 42. FRANCE FREE SPACE OPTIC COMMUNICATION MARKET, BY COMPONENT, 2021-2031 ($MILLION)
- TABLE 43. FRANCE FREE SPACE OPTIC COMMUNICATION MARKET, BY APPLICATION, 2021-2031 ($MILLION)
- TABLE 44. REST OF EUROPE FREE SPACE OPTIC COMMUNICATION MARKET, BY PLATFORM, 2021-2031 ($MILLION)
- TABLE 45. REST OF EUROPE FREE SPACE OPTIC COMMUNICATION MARKET, BY COMPONENT, 2021-2031 ($MILLION)
- TABLE 46. REST OF EUROPE FREE SPACE OPTIC COMMUNICATION MARKET, BY APPLICATION, 2021-2031 ($MILLION)
- TABLE 47. ASIA-PACIFIC FREE SPACE OPTIC COMMUNICATION MARKET, BY PLATFORM, 2021-2031 ($MILLION)
- TABLE 48. ASIA-PACIFIC FREE SPACE OPTIC COMMUNICATION MARKET, BY COMPONENT, 2021-2031 ($MILLION)
- TABLE 49. ASIA-PACIFIC FREE SPACE OPTIC COMMUNICATION MARKET, BY APPLICATION, 2021-2031 ($MILLION)
- TABLE 50. ASIA-PACIFIC FREE SPACE OPTIC COMMUNICATION MARKET, BY COUNTRY, 2021-2031 ($MILLION)
- TABLE 51. CHINA FREE SPACE OPTIC COMMUNICATION MARKET, BY PLATFORM, 2021-2031 ($MILLION)
- TABLE 52. CHINA FREE SPACE OPTIC COMMUNICATION MARKET, BY COMPONENT, 2021-2031 ($MILLION)
- TABLE 53. CHINA FREE SPACE OPTIC COMMUNICATION MARKET, BY APPLICATION, 2021-2031 ($MILLION)
- TABLE 54. JAPAN FREE SPACE OPTIC COMMUNICATION MARKET, BY PLATFORM, 2021-2031 ($MILLION)
- TABLE 55. JAPAN FREE SPACE OPTIC COMMUNICATION MARKET, BY COMPONENT, 2021-2031 ($MILLION)
- TABLE 56. JAPAN FREE SPACE OPTIC COMMUNICATION MARKET, BY APPLICATION, 2021-2031 ($MILLION)
- TABLE 57. INDIA FREE SPACE OPTIC COMMUNICATION MARKET, BY PLATFORM, 2021-2031 ($MILLION)
- TABLE 58. INDIA FREE SPACE OPTIC COMMUNICATION MARKET, BY COMPONENT, 2021-2031 ($MILLION)
- TABLE 59. INDIA FREE SPACE OPTIC COMMUNICATION MARKET, BY APPLICATION, 2021-2031 ($MILLION)
- TABLE 60. SOUTH KOREA FREE SPACE OPTIC COMMUNICATION MARKET, BY PLATFORM, 2021-2031 ($MILLION)
- TABLE 61. SOUTH KOREA FREE SPACE OPTIC COMMUNICATION MARKET, BY COMPONENT, 2021-2031 ($MILLION)
- TABLE 62. SOUTH KOREA FREE SPACE OPTIC COMMUNICATION MARKET, BY APPLICATION, 2021-2031 ($MILLION)
- TABLE 63. REST OF ASIA-PACIFIC FREE SPACE OPTIC COMMUNICATION MARKET, BY PLATFORM, 2021-2031 ($MILLION)
- TABLE 64. REST OF ASIA-PACIFIC FREE SPACE OPTIC COMMUNICATION MARKET, BY COMPONENT, 2021-2031 ($MILLION)
- TABLE 65. REST OF ASIA-PACIFIC FREE SPACE OPTIC COMMUNICATION MARKET, BY APPLICATION, 2021-2031 ($MILLION)
- TABLE 66. LAMEA FREE SPACE OPTIC COMMUNICATION MARKET, BY PLATFORM, 2021-2031 ($MILLION)
- TABLE 67. LAMEA FREE SPACE OPTIC COMMUNICATION MARKET, BY COMPONENT, 2021-2031 ($MILLION)
- TABLE 68. LAMEA FREE SPACE OPTIC COMMUNICATION MARKET, BY APPLICATION, 2021-2031 ($MILLION)
- TABLE 69. LAMEA FREE SPACE OPTIC COMMUNICATION MARKET, BY COUNTRY, 2021-2031 ($MILLION)
- TABLE 70. LATIN AMERICA FREE SPACE OPTIC COMMUNICATION MARKET, BY PLATFORM, 2021-2031 ($MILLION)
- TABLE 71. LATIN AMERICA FREE SPACE OPTIC COMMUNICATION MARKET, BY COMPONENT, 2021-2031 ($MILLION)
- TABLE 72. LATIN AMERICA FREE SPACE OPTIC COMMUNICATION MARKET, BY APPLICATION, 2021-2031 ($MILLION)
- TABLE 73. MIDDLE EAST FREE SPACE OPTIC COMMUNICATION MARKET, BY PLATFORM, 2021-2031 ($MILLION)
- TABLE 74. MIDDLE EAST FREE SPACE OPTIC COMMUNICATION MARKET, BY COMPONENT, 2021-2031 ($MILLION)
- TABLE 75. MIDDLE EAST FREE SPACE OPTIC COMMUNICATION MARKET, BY APPLICATION, 2021-2031 ($MILLION)
- TABLE 76. AFRICA FREE SPACE OPTIC COMMUNICATION MARKET, BY PLATFORM, 2021-2031 ($MILLION)
- TABLE 77. AFRICA FREE SPACE OPTIC COMMUNICATION MARKET, BY COMPONENT, 2021-2031 ($MILLION)
- TABLE 78. AFRICA FREE SPACE OPTIC COMMUNICATION MARKET, BY APPLICATION, 2021-2031 ($MILLION)
- TABLE 79. EC SYSTEM: KEY EXECUTIVES
- TABLE 80. EC SYSTEM: COMPANY SNAPSHOT
- TABLE 81. EC SYSTEM: PRODUCT SEGMENTS
- TABLE 82. EC SYSTEM: PRODUCT PORTFOLIO
- TABLE 83. FSONA NETWORKS CORPORATION: KEY EXECUTIVES
- TABLE 84. FSONA NETWORKS CORPORATION: COMPANY SNAPSHOT
- TABLE 85. FSONA NETWORKS CORPORATION: PRODUCT SEGMENTS
- TABLE 86. FSONA NETWORKS CORPORATION: PRODUCT PORTFOLIO
- TABLE 87. AXIOM OPTICS: KEY EXECUTIVES
- TABLE 88. AXIOM OPTICS: COMPANY SNAPSHOT
- TABLE 89. AXIOM OPTICS: PRODUCT SEGMENTS
- TABLE 90. AXIOM OPTICS: PRODUCT PORTFOLIO
- TABLE 91. WIRELESS EXCELLENCE LIMITED: KEY EXECUTIVES
- TABLE 92. WIRELESS EXCELLENCE LIMITED: COMPANY SNAPSHOT
- TABLE 93. WIRELESS EXCELLENCE LIMITED: PRODUCT SEGMENTS
- TABLE 94. WIRELESS EXCELLENCE LIMITED: PRODUCT PORTFOLIO
- TABLE 95. QINETIQ GROUP PLC: KEY EXECUTIVES
- TABLE 96. QINETIQ GROUP PLC: COMPANY SNAPSHOT
- TABLE 97. QINETIQ GROUP PLC: PRODUCT SEGMENTS
- TABLE 98. QINETIQ GROUP PLC: PRODUCT PORTFOLIO
- TABLE 99. QINETIQ GROUP PLC: KEY STRATERGIES
- TABLE 100. VIASAT, INC.: KEY EXECUTIVES
- TABLE 101. VIASAT, INC.: COMPANY SNAPSHOT
- TABLE 102. VIASAT, INC.: SERVICE SEGMENTS
- TABLE 103. VIASAT, INC.: PRODUCT PORTFOLIO
- TABLE 104. MOSTCOM JSC: KEY EXECUTIVES
- TABLE 105. MOSTCOM JSC: COMPANY SNAPSHOT
- TABLE 106. MOSTCOM JSC: SERVICE SEGMENTS
- TABLE 107. MOSTCOM JSC: PRODUCT PORTFOLIO
- TABLE 108. MYNARIC: KEY EXECUTIVES
- TABLE 109. MYNARIC: COMPANY SNAPSHOT
- TABLE 110. MYNARIC: PRODUCT SEGMENTS
- TABLE 111. MYNARIC: PRODUCT PORTFOLIO
- TABLE 112. MYNARIC: KEY STRATERGIES
- TABLE 113. COLLINEAR: KEY EXECUTIVES
- TABLE 114. COLLINEAR: COMPANY SNAPSHOT
- TABLE 115. COLLINEAR: PRODUCT SEGMENTS
- TABLE 116. COLLINEAR: PRODUCT PORTFOLIO
- TABLE 117. PLAINTREE SYSTEMS INC.: KEY EXECUTIVES
- TABLE 118. PLAINTREE SYSTEMS INC.: COMPANY SNAPSHOT
- TABLE 119. PLAINTREE SYSTEMS INC.: PRODUCT SEGMENTS
- TABLE 120. PLAINTREE SYSTEMS INC.: PRODUCT PORTFOLIO
LIST OF FIGURES
- FIGURE 01. FREE SPACE OPTIC COMMUNICATION MARKET, 2021-2031
- FIGURE 02. SEGMENTATION OF FREE SPACE OPTIC COMMUNICATION MARKET, 2021-2031
- FIGURE 03. TOP INVESTMENT POCKETS IN FREE SPACE OPTIC COMMUNICATION MARKET (2022-2031)
- FIGURE 04. MODERATE BARGAINING POWER OF SUPPLIERS
- FIGURE 05. MODERATE BARGAINING POWER OF BUYERS
- FIGURE 06. MODERATE THREAT OF SUBSTITUTES
- FIGURE 07. MODERATE THREAT OF NEW ENTRANTS
- FIGURE 08. HIGH INTENSITY OF RIVALRY
- FIGURE 09. DRIVERS, RESTRAINTS AND OPPORTUNITIES: GLOBALFREE SPACE OPTIC COMMUNICATION MARKET
- FIGURE 10. FREE SPACE OPTIC COMMUNICATION MARKET, BY PLATFORM, 2021(%)
- FIGURE 11. COMPARATIVE SHARE ANALYSIS OF FREE SPACE OPTIC COMMUNICATION MARKET FOR SPACE, BY COUNTRY 2021 AND 2031(%)
- FIGURE 12. COMPARATIVE SHARE ANALYSIS OF FREE SPACE OPTIC COMMUNICATION MARKET FOR AIRBORNE, BY COUNTRY 2021 AND 2031(%)
- FIGURE 13. COMPARATIVE SHARE ANALYSIS OF FREE SPACE OPTIC COMMUNICATION MARKET FOR GROUND, BY COUNTRY 2021 AND 2031(%)
- FIGURE 14. FREE SPACE OPTIC COMMUNICATION MARKET, BY COMPONENT, 2021(%)
- FIGURE 15. COMPARATIVE SHARE ANALYSIS OF FREE SPACE OPTIC COMMUNICATION MARKET FOR TRANSMITTER, BY COUNTRY 2021 AND 2031(%)
- FIGURE 16. COMPARATIVE SHARE ANALYSIS OF FREE SPACE OPTIC COMMUNICATION MARKET FOR TRANSCEIVER, BY COUNTRY 2021 AND 2031(%)
- FIGURE 17. COMPARATIVE SHARE ANALYSIS OF FREE SPACE OPTIC COMMUNICATION MARKET FOR RECEIVER, BY COUNTRY 2021 AND 2031(%)
- FIGURE 18. COMPARATIVE SHARE ANALYSIS OF FREE SPACE OPTIC COMMUNICATION MARKET FOR OTHERS, BY COUNTRY 2021 AND 2031(%)
- FIGURE 19. FREE SPACE OPTIC COMMUNICATION MARKET, BY APPLICATION, 2021(%)
- FIGURE 20. COMPARATIVE SHARE ANALYSIS OF FREE SPACE OPTIC COMMUNICATION MARKET FOR MOBILE BACKHAUL, BY COUNTRY 2021 AND 2031(%)
- FIGURE 21. COMPARATIVE SHARE ANALYSIS OF FREE SPACE OPTIC COMMUNICATION MARKET FOR DISASTER RECOVERY, BY COUNTRY 2021 AND 2031(%)
- FIGURE 22. COMPARATIVE SHARE ANALYSIS OF FREE SPACE OPTIC COMMUNICATION MARKET FOR ENTERPRISE CONNECTIVITY, BY COUNTRY 2021 AND 2031(%)
- FIGURE 23. COMPARATIVE SHARE ANALYSIS OF FREE SPACE OPTIC COMMUNICATION MARKET FOR DEFENSE, BY COUNTRY 2021 AND 2031(%)
- FIGURE 24. COMPARATIVE SHARE ANALYSIS OF FREE SPACE OPTIC COMMUNICATION MARKET FOR SATELLITE, BY COUNTRY 2021 AND 2031(%)
- FIGURE 25. COMPARATIVE SHARE ANALYSIS OF FREE SPACE OPTIC COMMUNICATION MARKET FOR OTHERS, BY COUNTRY 2021 AND 2031(%)
- FIGURE 26. FREE SPACE OPTIC COMMUNICATION MARKET BY REGION, 2021
- FIGURE 27. U.S. FREE SPACE OPTIC COMMUNICATION MARKET, 2021-2031 ($MILLION)
- FIGURE 28. CANADA FREE SPACE OPTIC COMMUNICATION MARKET, 2021-2031 ($MILLION)
- FIGURE 29. MEXICO FREE SPACE OPTIC COMMUNICATION MARKET, 2021-2031 ($MILLION)
- FIGURE 30. UK FREE SPACE OPTIC COMMUNICATION MARKET, 2021-2031 ($MILLION)
- FIGURE 31. GERMANY FREE SPACE OPTIC COMMUNICATION MARKET, 2021-2031 ($MILLION)
- FIGURE 32. FRANCE FREE SPACE OPTIC COMMUNICATION MARKET, 2021-2031 ($MILLION)
- FIGURE 33. REST OF EUROPE FREE SPACE OPTIC COMMUNICATION MARKET, 2021-2031 ($MILLION)
- FIGURE 34. CHINA FREE SPACE OPTIC COMMUNICATION MARKET, 2021-2031 ($MILLION)
- FIGURE 35. JAPAN FREE SPACE OPTIC COMMUNICATION MARKET, 2021-2031 ($MILLION)
- FIGURE 36. INDIA FREE SPACE OPTIC COMMUNICATION MARKET, 2021-2031 ($MILLION)
- FIGURE 37. SOUTH KOREA FREE SPACE OPTIC COMMUNICATION MARKET, 2021-2031 ($MILLION)
- FIGURE 38. REST OF ASIA-PACIFIC FREE SPACE OPTIC COMMUNICATION MARKET, 2021-2031 ($MILLION)
- FIGURE 39. LATIN AMERICA FREE SPACE OPTIC COMMUNICATION MARKET, 2021-2031 ($MILLION)
- FIGURE 40. MIDDLE EAST FREE SPACE OPTIC COMMUNICATION MARKET, 2021-2031 ($MILLION)
- FIGURE 41. AFRICA FREE SPACE OPTIC COMMUNICATION MARKET, 2021-2031 ($MILLION)
- FIGURE 42. TOP WINNING STRATEGIES, BY YEAR
- FIGURE 43. TOP WINNING STRATEGIES, BY DEVELOPMENT
- FIGURE 44. TOP WINNING STRATEGIES, BY COMPANY
- FIGURE 45. PRODUCT MAPPING OF TOP 10 PLAYERS
- FIGURE 46. COMPETITIVE DASHBOARD
- FIGURE 47. COMPETITIVE HEATMAP: FREE SPACE OPTIC COMMUNICATION MARKET
- FIGURE 48. TOP PLAYER POSITIONING, 2021
- FIGURE 49. QINETIQ GROUP PLC: NET REVENUE, 2019-2021 ($MILLION)
- FIGURE 50. QINETIQ GROUP PLC: REVENUE SHARE BY REGION, 2021 (%)
- FIGURE 51. QINETIQ GROUP PLC: REVENUE SHARE BY SEGMENT, 2021 (%)
- FIGURE 52. VIASAT, INC.: NET REVENUE, 2020-2022 ($MILLION)
- FIGURE 53. VIASAT, INC.: REVENUE SHARE BY SEGMENT, 2022 (%)
- FIGURE 54. MYNARIC: NET REVENUE, 2019-2021 ($MILLION)
- FIGURE 55. COLLINEAR: NET REVENUE, 2019-2021 ($MILLION)
- FIGURE 56. COLLINEAR: REVENUE SHARE BY SEGMENT, 2021 (%)
- FIGURE 57. COLLINEAR: REVENUE SHARE BY REGION, 2021 (%)
- FIGURE 58. PLAINTREE SYSTEMS INC.: NET REVENUE, 2020-2022 ($MILLION)
- FIGURE 59. PLAINTREE SYSTEMS INC.: RESEARCH & DEVELOPMENT EXPENDITURE, 2020-2022 ($MILLION)
- FIGURE 60. PLAINTREE SYSTEMS INC.: REVENUE SHARE BY SEGMENT, 2022 (%)
 自由曲面光学元件市场:按材料、应用和最终用户产业划分 - 2025-2030 年全球预测
 全球 FSO(无线光通讯)和 VLC(可见光通讯)/Li-Fi 市场:按组件、按传输类型、按应用、按行业、按地区 - 预测至 2029 年
 自由空间光学元件市场:按应用、元件、最终用户、技术、范围划分 - 2025-2030 年全球预测
 自由空间光学 (FSO) 通讯市场 - 2024-2034 年全球产业分析、规模、份额、成长、趋势与预测
 2024 年无线光通讯全球市场报告
 2024 年自由空间光学 (FSO) 全球市场报告
 到 2030 年 FSO(无线光通讯)市场预测:按组件、传输距离、应用和地区进行的全球分析
 FSO通讯市场报告:2030 年趋势、预测与竞争分析
 自由空间光通信市场的增长机会