


 |
市场调查报告书
商品编码
1298325
管线加热器市场:按类型、规模、最终用途:2021-2031 年全球机遇分析和行业预测Line Heaters Market By Type (Indirect Line Heaters, Direct Line Heaters), By Size (1 MM BTU, 1.5 MM BTU, 2 MM BTU), By End Use (Oil and Gas Industry, Chemical Industry, Others): Global Opportunity Analysis and Industry Forecast, 2021-2031 |
||||||
2021年全球管道加热器市场价值为2080万美元,预计2022年至2031年復合年增长率为5.4%,到2031年达到3440万美元。
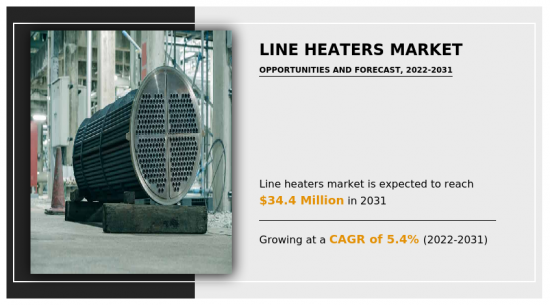
管线加热器是一种製造和加工设备,用于将流线中的气体温度保持在水合物温度(冷冻温度)以上。管道加热器中常见的三个组件包括储液器、火管和过程线圈。管线加热器设备的一个重要作用是在油田作业期间降低水合物的形成。完全组装的管线加热器包括线圈、加热器和燃气系统,额定容量为 1 至 4.0 MM BTU/小时。由于管道加热器可以根据应用进行定制,因此各种最终用户对管道加热器的需求正在不断增加。
促进管线加热器市场增长的主要因素之一是页岩油气勘探活动的变化。管线加热器可以提高性能、控制运营成本并减少设备和井筒的意外停机。此外,石油和天然气钻探行业新兴市场的扩大以及大功率加热设备的日益采用都促进了管线加热器市场的快速增长。主要石油和天然气公司通过在勘探项目上投入大量资源,为管道加热器市场行业创造机会。
管道加热器具有多种优点,包括减少机器停机时间、防止管道中形成水合物以及降低管道维护成本。因此,预计石油天然气行业对管线加热设备的需求将会增加。管道加热器用于製造过程中的各种应用。管道加热器是在过程中保持精确温度控制的完美解决方案,增加了市场对管道加热器的需求。
采用创新技术进行扩焰、减轻逃逸排放以及解决液体和气体洩漏问题是井场工程师的主要投资重点。政府对生产现场采用管道加热器的有利举措将在不久的将来推动市场增长。全球对管道加热器的需求是由各地区降低管道维护成本和加强工人安全法规的努力推动的。
如今,石油开发公司致力于发现和建设陆上和海上钻井项目。预计各地区油井钻探项目的增加将为全球管线加热器市场创造机会。
目录
第 1 章 简介
第二章执行摘要
第三章市场概况
- 市场定义和范围
- 主要发现
- 影响因素
- 主要投资机会
- 波特五力分析
- 供应商的议价能力
- 买方议价能力
- 替代品的威胁
- 新进入者的威胁
- 竞争强度
- 市场动态
- 促进者
- 对油井设施的需求增加
- 降低管道和消防管道故障的风险
- 阻碍因素
- 轻鬆获得替代方案
- 机会
- 加大寒地石油勘探生产项目投资
- 促进者
- COVID-19 市场影响分析
- 价值链分析
4 管线加热器市场,按类型
- 概述
- 市场规模及预测
- 间接管道加热器
- 主要市场趋势、增长动力和机遇
- 市场规模/预测:按地区
- 市场份额分析:按国家分类
- 直接线加热器
- 主要市场趋势、增长动力和机遇
- 市场规模/预测:按地区
- 市场份额分析:按国家分类
5 管线加热器市场:按规模
- 概述
- 市场规模和预测
- 1 MM BTU
- 主要市场趋势、增长动力和机遇
- 市场规模/预测:按地区
- 市场份额分析:按国家分类
- 1.5MM BTU
- 主要市场趋势、增长动力和机遇
- 市场规模/预测:按地区
- 市场份额分析:按国家分类
- 2MM BTU
- 主要市场趋势、增长动力和机遇
- 市场规模/预测:按地区
- 市场份额分析:按国家分类
6 线加热器市场,按最终用户划分
- 概述
- 市场规模及预测
- 石油和天然气工业
- 主要市场趋势、增长动力和机遇
- 市场规模/预测:按地区
- 市场份额分析:按国家分类
- 石油和天然气管道加热器市场,按类别
- 上游市场规模及预测:按地区划分
- 上游市场规模和预测:按国家划分
- 下游市场规模及预测:按地区划分
- 下游市场规模和预测:按国家划分
- 中游市场规模和预测:按地区划分
- 中游市场规模和预测:按国家划分
- 化学工业
- 主要市场趋势、增长动力和机遇
- 市场规模/预测:按地区
- 市场份额分析:按国家分类
- 其他行业
- 主要市场趋势、增长动力和机遇
- 市场规模/预测:按地区
- 市场份额分析:按国家分类
7. 线加热器市场,按地区
- 概述
- 市场规模/预测:按地区
- 北美
- 主要趋势和机遇
- 市场规模/预测:按类型
- 市场规模/预测:按规模
- 市场规模和预测:按最终用途分类
- 北美石油和天然气管道加热器市场,按类别
- 市场规模/预测:按国家
- 美国
- 主要市场趋势、增长动力和机遇
- 市场规模/预测:按类型
- 市场规模/预测:按规模
- 市场规模和预测:按最终用途分类
- 美国石油和天然气管道加热器市场,按类别
- 加拿大
- 主要市场趋势、增长动力和机遇
- 市场规模/预测:按类型
- 市场规模/预测:按规模
- 市场规模和预测:按最终用途分类
- 加拿大石油和天然气管道加热器市场,按类别
- 墨西哥
- 主要市场趋势、增长动力和机遇
- 市场规模/预测:按类型
- 市场规模/预测:按规模
- 市场规模和预测:按最终用途分类
- 墨西哥石油和天然气工业线加热器市场,按类别
- 欧洲
- 主要趋势和机遇
- 市场规模/预测:按类型
- 市场规模/预测:按规模
- 市场规模和预测:按最终用途分类
- 欧洲石油和天然气行业管道加热器市场(按类别)
- 市场规模/预测:按国家
- 俄罗斯
- 主要市场趋势、增长动力和机遇
- 市场规模/预测:按类型
- 市场规模/预测:按规模
- 市场规模和预测:按最终用途分类
- 俄罗斯石油和天然气工业线加热器市场,按类别
- 挪威
- 主要市场趋势、增长动力和机遇
- 市场规模/预测:按类型
- 市场规模/预测:按规模
- 市场规模和预测:按最终用途分类
- 挪威石油和天然气行业管线加热器市场(按类别)
- 英国
- 主要市场趋势、增长动力和机遇
- 市场规模/预测:按类型
- 市场规模/预测:按规模
- 市场规模和预测:按最终用途分类
- 英国石油和天然气管道加热器市场,按类别
- 德国
- 主要市场趋势、增长动力和机遇
- 市场规模/预测:按类型
- 市场规模/预测:按规模
- 市场规模和预测:按最终用途分类
- 德国石油和天然气管道加热器市场,按类别
- 欧洲其他地区
- 主要市场趋势、增长动力和机遇
- 市场规模/预测:按类型
- 市场规模/预测:按规模
- 市场规模和预测:按最终用途分类
- 其他欧洲石油和天然气工业管线加热器市场(按类别)
- 亚太地区
- 主要趋势和机遇
- 市场规模/预测:按类型
- 市场规模/预测:按规模
- 市场规模和预测:按最终用途分类
- 亚太地区石油和天然气管道加热器市场(按类别)
- 市场规模/预测:按国家
- 中国
- 主要市场趋势、增长动力和机遇
- 市场规模/预测:按类型
- 市场规模/预测:按规模
- 市场规模和预测:按最终用途分类
- 中国石油天然气工业管道加热器市场,按类别
- 印度
- 主要市场趋势、增长动力和机遇
- 市场规模/预测:按类型
- 市场规模/预测:按规模
- 市场规模和预测:按最终用途分类
- 印度石油和天然气管道加热器市场,按类别
- 日本
- 主要市场趋势、增长动力和机遇
- 市场规模/预测:按类型
- 市场规模/预测:按规模
- 市场规模和预测:按最终用途分类
- 日本石油和天然气行业管道加热器市场:按类别
- 韩国
- 主要市场趋势、增长动力和机遇
- 市场规模/预测:按类型
- 市场规模/预测:按规模
- 市场规模和预测:按最终用途分类
- 韩国石油和天然气管道加热器市场,按类别
- 亚太其他地区
- 主要市场趋势、增长动力和机遇
- 市场规模/预测:按类型
- 市场规模/预测:按规模
- 市场规模和预测:按最终用途分类
- 亚太地区其他地区石油和天然气管道加热器市场(按类别)
- 拉丁美洲/中东/非洲
- 主要趋势和机遇
- 市场规模/预测:按类型
- 市场规模/预测:按规模
- 市场规模和预测:按最终用途分类
- 石油和天然气行业管道加热器的 LAMEA 市场(按类别)
- 市场规模/预测:按国家
- 巴西
- 主要市场趋势、增长动力和机遇
- 市场规模/预测:按类型
- 市场规模/预测:按规模
- 市场规模和预测:按最终用途分类
- 巴西石油和天然气管道加热器市场,按类别
- 沙特阿拉伯
- 主要市场趋势、增长动力和机遇
- 市场规模/预测:按类型
- 市场规模/预测:按规模
- 市场规模和预测:按最终用途分类
- 沙特阿拉伯石油和天然气管道加热器市场,按类别
- 阿拉伯联合酋长国
- 主要市场趋势、增长动力和机遇
- 市场规模/预测:按类型
- 市场规模/预测:按规模
- 市场规模和预测:按最终用途分类
- 阿联酋石油和天然气管道加热器市场,按类别
- 其他地区
- 主要市场趋势、增长动力和机遇
- 市场规模/预测:按类型
- 市场规模/预测:按规模
- 市场规模和预测:按最终用途分类
- 适用于石油和天然气行业的其他 LAMEA 管线加热器市场:按类别
第8章 竞争格局
- 介绍
- 关键成功策略
- 10大公司产品图
- 比赛仪表板
- 比赛热图
- 顶级公司定位 (2021)
第九章公司简介
- Arc Energy.
- Forum Energy Technologies, Inc.
- ENERFLEX LTD.
- Integrated Flow Solutions, Inc.
- Inclusivenergy LTD.
- Surplus Energy.
- Honeywell International Inc.
- Allmand Bros., Inc.
- Sigma Thermal Inc
- 12:eleven Production Equipment
- Aspire Energy Resources Inc.
The global line heaters market was valued at $20.8 million in 2021, and is projected to reach $34.4 million by 2031, growing at a CAGR of 5.4% from 2022 to 2031.
Line heaters are type of production and processing equipment used to maintain the temperature of the gas in a flow line above the hydrate temperature (freezing temperature). Three components that are commonly found in a line heater include a liquid bath, a fire tube, and a process coil. The key role of line heaters equipment is to lower the formulation of hydrate during the oil field operations. The pre-assembled line heaters include coil, heater and fuel gas system and have rated capacities from 1-4.0 MM BTU/hr. The customization in the line heaters can be done according to the application which increases the demand for line heaters in different end users.
One of the major factors contributing toward the line heater market growth are changes in shale oil and gas exploration activity. Line heaters can improve performance, control operating costs, and reduce unscheduled equipment & well shutdowns. Moreover, both the developing oil and gas drilling industry and increasing adoption of high-power heating equipment contribute to the rapid growth of the line heaters market. Major oil and gas companies create opportunities for line heaters market industry by investing more resources in exploration projects.
The line heaters come with the several advantages such as reduction of downtime of machines, prevention of the formation of hydrates in pipeline and reduction of the maintenance cost of pipelines. This is expected to drive the demand for line heaters equipment in the oil and gas industry. Line heaters are used in several applications of manufacturing processes. The line heaters are perfect solution for maintaining precise temperature control over processes, which increases the demand for line heaters in the market.
Adopting innovative techniques for flare elimination, mitigating fugitive emissions and addressing liquids and gas leaks are the key investment priorities for well site engineers. Favorable government initiatives for the adoption of line heaters at production site drive the market growth in near future. Global demand for line heaters is being driven by efforts to reduce pipeline maintenance costs and tighten worker safety regulations in different regions.
Today, oil exploration companies are engaged in the findingand building of excavation projects on both onshore and offshore. Increase in the oil well excavation projects in the different regions is projected to create opportunities for the global line heaters market.
For the purpose of analysis, the line heaters market is segmented on the basis of type, size, end use and region. On the basis of type, the market is bifurcated into direct line heaters and indirect line heaters. On the basis of size, the market is divided into 1 MM BTU, 1.5 MM BTU and 2 MM BTU. On the basis of end use, the market is categorized into oil and gas industry, chemical industry, and others. Region-wise, the market is analyzed across North America, Europe, Asia-Pacific, and LAMEA. Presently, North America accounts for the largest share of the market, followed by LAMEA.
Major players operating in the global line heaters industry include: Arc Energy., Forum Energy Technologies, Inc., ENERFLEX LTD., Integrated Flow Solutions, Inc., Inclusive Energy Ltd., Surplus Energy., Honeywell International Inc., Allmand Bros., Inc., Sigma Thermal Inc., 12:eleven Production Equipment Inc., and Aspire Energy Resources Inc.
Key Benefits For Stakeholders
- This report provides a quantitative analysis of the market segments, current trends, estimations, and dynamics of the line heaters market analysis from 2021 to 2031 to identify the prevailing line heaters market opportunities.
- The market research is offered along with information related to key drivers, restraints, and opportunities.
- Porter's five forces analysis highlights the potency of buyers and suppliers to enable stakeholders make profit-oriented business decisions and strengthen their supplier-buyer network.
- In-depth analysis of the line heaters market segmentation assists to determine the prevailing market opportunities.
- Major countries in each region are mapped according to their revenue contribution to the global market.
- Market player positioning facilitates benchmarking and provides a clear understanding of the present position of the market players.
- The report includes the analysis of the regional as well as global line heaters market trends, key players, market segments, application areas, and market growth strategies.
Key Market Segments
By Type
- Indirect Line Heaters
- Direct Line Heaters
By Size
- 1 MM BTU
- 1.5 MM BTU
- 2 MM BTU
By End Use
- Oil and Gas Industry
- Category
- Upstream
- Downstream
- Midstream
- Chemical Industry
- Others
By Region
- North America
- U.S.
- Canada
- Mexico
- Europe
- Russia
- Norway
- UK
- Germany
- Rest of Europe
- Asia-Pacific
- China
- India
- Japan
- South Korea
- Rest of Asia-Pacific
- LAMEA
- Brazil
- Saudi Arabia
- UAE
- Rest of LAMEA
Key Market Players:
- Honeywell International Inc.
- Arc Energy.
- Allmand Bros., Inc.
- ENERFLEX LTD.
- Integrated Flow Solutions, Inc.
- Inclusivenergy LTD.
- Surplus Energy.
- Sigma Thermal Inc
- 12:eleven Production Equipment
- Aspire Energy Resources Inc.
- Forum Energy Technologies, Inc.
TABLE OF CONTENTS
CHAPTER 1: INTRODUCTION
- 1.1. Report description
- 1.2. Key market segments
- 1.3. Key benefits to the stakeholders
- 1.4. Research Methodology
- 1.4.1. Primary research
- 1.4.2. Secondary research
- 1.4.3. Analyst tools and models
CHAPTER 2: EXECUTIVE SUMMARY
- 2.1. CXO Perspective
CHAPTER 3: MARKET OVERVIEW
- 3.1. Market definition and scope
- 3.2. Key findings
- 3.2.1. Top impacting factors
- 3.2.2. Top investment pockets
- 3.3. Porter's five forces analysis
- 3.3.1. Bargaining power of suppliers
- 3.3.2. Bargaining power of buyers
- 3.3.3. Threat of substitutes
- 3.3.4. Threat of new entrants
- 3.3.5. Intensity of rivalry
- 3.4. Market dynamics
- 3.4.1. Drivers
- 3.4.1.1. Rise in Demand For Well Site Facilities
- 3.4.1.2. Mitigating Risk of Pipeline and Firetube Failures
- 3.4.1. Drivers
- 3.4.2. Restraints
- 3.4.2.1. Market Accessibility to Alternatives
- 3.4.3. Opportunities
- 3.4.3.1. Rise in Investment in Oil Exploration and Production Projects in Regions With Low Temperature
- 3.5. COVID-19 Impact Analysis on the market
- 3.6. Value Chain Analysis
CHAPTER 4: LINE HEATERS MARKET, BY TYPE
- 4.1. Overview
- 4.1.1. Market size and forecast
- 4.2. Indirect Line Heaters
- 4.2.1. Key market trends, growth factors and opportunities
- 4.2.2. Market size and forecast, by region
- 4.2.3. Market share analysis by country
- 4.3. Direct Line Heaters
- 4.3.1. Key market trends, growth factors and opportunities
- 4.3.2. Market size and forecast, by region
- 4.3.3. Market share analysis by country
CHAPTER 5: LINE HEATERS MARKET, BY SIZE
- 5.1. Overview
- 5.1.1. Market size and forecast
- 5.2. 1 MM BTU
- 5.2.1. Key market trends, growth factors and opportunities
- 5.2.2. Market size and forecast, by region
- 5.2.3. Market share analysis by country
- 5.3. 1.5 MM BTU
- 5.3.1. Key market trends, growth factors and opportunities
- 5.3.2. Market size and forecast, by region
- 5.3.3. Market share analysis by country
- 5.4. 2 MM BTU
- 5.4.1. Key market trends, growth factors and opportunities
- 5.4.2. Market size and forecast, by region
- 5.4.3. Market share analysis by country
CHAPTER 6: LINE HEATERS MARKET, BY END USE
- 6.1. Overview
- 6.1.1. Market size and forecast
- 6.2. Oil and Gas Industry
- 6.2.1. Key market trends, growth factors and opportunities
- 6.2.2. Market size and forecast, by region
- 6.2.3. Market share analysis by country
- 6.2.4. Oil and Gas Industry Line Heaters Market by Category
- 6.2.4.1. Upstream Market size and forecast, by region
- 6.2.4.2. Upstream Market size and forecast, by country
- 6.2.4.3. Downstream Market size and forecast, by region
- 6.2.4.4. Downstream Market size and forecast, by country
- 6.2.4.5. Midstream Market size and forecast, by region
- 6.2.4.6. Midstream Market size and forecast, by country
- 6.3. Chemical Industry
- 6.3.1. Key market trends, growth factors and opportunities
- 6.3.2. Market size and forecast, by region
- 6.3.3. Market share analysis by country
- 6.4. Others
- 6.4.1. Key market trends, growth factors and opportunities
- 6.4.2. Market size and forecast, by region
- 6.4.3. Market share analysis by country
CHAPTER 7: LINE HEATERS MARKET, BY REGION
- 7.1. Overview
- 7.1.1. Market size and forecast By Region
- 7.2. North America
- 7.2.1. Key trends and opportunities
- 7.2.2. Market size and forecast, by Type
- 7.2.3. Market size and forecast, by Size
- 7.2.4. Market size and forecast, by End Use
- 7.2.4.1. North America Oil and Gas Industry Line Heaters Market by Category
- 7.2.5. Market size and forecast, by country
- 7.2.5.1. U.S.
- 7.2.5.1.1. Key market trends, growth factors and opportunities
- 7.2.5.1.2. Market size and forecast, by Type
- 7.2.5.1.3. Market size and forecast, by Size
- 7.2.5.1.4. Market size and forecast, by End Use
- 7.2.5.1.4.1. U.S. Oil and Gas Industry Line Heaters Market by Category
- 7.2.5.2. Canada
- 7.2.5.2.1. Key market trends, growth factors and opportunities
- 7.2.5.2.2. Market size and forecast, by Type
- 7.2.5.2.3. Market size and forecast, by Size
- 7.2.5.2.4. Market size and forecast, by End Use
- 7.2.5.2.4.1. Canada Oil and Gas Industry Line Heaters Market by Category
- 7.2.5.3. Mexico
- 7.2.5.3.1. Key market trends, growth factors and opportunities
- 7.2.5.3.2. Market size and forecast, by Type
- 7.2.5.3.3. Market size and forecast, by Size
- 7.2.5.3.4. Market size and forecast, by End Use
- 7.2.5.3.4.1. Mexico Oil and Gas Industry Line Heaters Market by Category
- 7.3. Europe
- 7.3.1. Key trends and opportunities
- 7.3.2. Market size and forecast, by Type
- 7.3.3. Market size and forecast, by Size
- 7.3.4. Market size and forecast, by End Use
- 7.3.4.1. Europe Oil and Gas Industry Line Heaters Market by Category
- 7.3.5. Market size and forecast, by country
- 7.3.5.1. Russia
- 7.3.5.1.1. Key market trends, growth factors and opportunities
- 7.3.5.1.2. Market size and forecast, by Type
- 7.3.5.1.3. Market size and forecast, by Size
- 7.3.5.1.4. Market size and forecast, by End Use
- 7.3.5.1.4.1. Russia Oil and Gas Industry Line Heaters Market by Category
- 7.3.5.2. Norway
- 7.3.5.2.1. Key market trends, growth factors and opportunities
- 7.3.5.2.2. Market size and forecast, by Type
- 7.3.5.2.3. Market size and forecast, by Size
- 7.3.5.2.4. Market size and forecast, by End Use
- 7.3.5.2.4.1. Norway Oil and Gas Industry Line Heaters Market by Category
- 7.3.5.3. UK
- 7.3.5.3.1. Key market trends, growth factors and opportunities
- 7.3.5.3.2. Market size and forecast, by Type
- 7.3.5.3.3. Market size and forecast, by Size
- 7.3.5.3.4. Market size and forecast, by End Use
- 7.3.5.3.4.1. UK Oil and Gas Industry Line Heaters Market by Category
- 7.3.5.4. Germany
- 7.3.5.4.1. Key market trends, growth factors and opportunities
- 7.3.5.4.2. Market size and forecast, by Type
- 7.3.5.4.3. Market size and forecast, by Size
- 7.3.5.4.4. Market size and forecast, by End Use
- 7.3.5.4.4.1. Germany Oil and Gas Industry Line Heaters Market by Category
- 7.3.5.5. Rest of Europe
- 7.3.5.5.1. Key market trends, growth factors and opportunities
- 7.3.5.5.2. Market size and forecast, by Type
- 7.3.5.5.3. Market size and forecast, by Size
- 7.3.5.5.4. Market size and forecast, by End Use
- 7.3.5.5.4.1. Rest of Europe Oil and Gas Industry Line Heaters Market by Category
- 7.4. Asia-Pacific
- 7.4.1. Key trends and opportunities
- 7.4.2. Market size and forecast, by Type
- 7.4.3. Market size and forecast, by Size
- 7.4.4. Market size and forecast, by End Use
- 7.4.4.1. Asia-Pacific Oil and Gas Industry Line Heaters Market by Category
- 7.4.5. Market size and forecast, by country
- 7.4.5.1. China
- 7.4.5.1.1. Key market trends, growth factors and opportunities
- 7.4.5.1.2. Market size and forecast, by Type
- 7.4.5.1.3. Market size and forecast, by Size
- 7.4.5.1.4. Market size and forecast, by End Use
- 7.4.5.1.4.1. China Oil and Gas Industry Line Heaters Market by Category
- 7.4.5.2. India
- 7.4.5.2.1. Key market trends, growth factors and opportunities
- 7.4.5.2.2. Market size and forecast, by Type
- 7.4.5.2.3. Market size and forecast, by Size
- 7.4.5.2.4. Market size and forecast, by End Use
- 7.4.5.2.4.1. India Oil and Gas Industry Line Heaters Market by Category
- 7.4.5.3. Japan
- 7.4.5.3.1. Key market trends, growth factors and opportunities
- 7.4.5.3.2. Market size and forecast, by Type
- 7.4.5.3.3. Market size and forecast, by Size
- 7.4.5.3.4. Market size and forecast, by End Use
- 7.4.5.3.4.1. Japan Oil and Gas Industry Line Heaters Market by Category
- 7.4.5.4. South Korea
- 7.4.5.4.1. Key market trends, growth factors and opportunities
- 7.4.5.4.2. Market size and forecast, by Type
- 7.4.5.4.3. Market size and forecast, by Size
- 7.4.5.4.4. Market size and forecast, by End Use
- 7.4.5.4.4.1. South Korea Oil and Gas Industry Line Heaters Market by Category
- 7.4.5.5. Rest of Asia-Pacific
- 7.4.5.5.1. Key market trends, growth factors and opportunities
- 7.4.5.5.2. Market size and forecast, by Type
- 7.4.5.5.3. Market size and forecast, by Size
- 7.4.5.5.4. Market size and forecast, by End Use
- 7.4.5.5.4.1. Rest of Asia-Pacific Oil and Gas Industry Line Heaters Market by Category
- 7.5. LAMEA
- 7.5.1. Key trends and opportunities
- 7.5.2. Market size and forecast, by Type
- 7.5.3. Market size and forecast, by Size
- 7.5.4. Market size and forecast, by End Use
- 7.5.4.1. LAMEA Oil and Gas Industry Line Heaters Market by Category
- 7.5.5. Market size and forecast, by country
- 7.5.5.1. Brazil
- 7.5.5.1.1. Key market trends, growth factors and opportunities
- 7.5.5.1.2. Market size and forecast, by Type
- 7.5.5.1.3. Market size and forecast, by Size
- 7.5.5.1.4. Market size and forecast, by End Use
- 7.5.5.1.4.1. Brazil Oil and Gas Industry Line Heaters Market by Category
- 7.5.5.2. Saudi Arabia
- 7.5.5.2.1. Key market trends, growth factors and opportunities
- 7.5.5.2.2. Market size and forecast, by Type
- 7.5.5.2.3. Market size and forecast, by Size
- 7.5.5.2.4. Market size and forecast, by End Use
- 7.5.5.2.4.1. Saudi Arabia Oil and Gas Industry Line Heaters Market by Category
- 7.5.5.3. UAE
- 7.5.5.3.1. Key market trends, growth factors and opportunities
- 7.5.5.3.2. Market size and forecast, by Type
- 7.5.5.3.3. Market size and forecast, by Size
- 7.5.5.3.4. Market size and forecast, by End Use
- 7.5.5.3.4.1. UAE Oil and Gas Industry Line Heaters Market by Category
- 7.5.5.4. Rest of LAMEA
- 7.5.5.4.1. Key market trends, growth factors and opportunities
- 7.5.5.4.2. Market size and forecast, by Type
- 7.5.5.4.3. Market size and forecast, by Size
- 7.5.5.4.4. Market size and forecast, by End Use
- 7.5.5.4.4.1. Rest of LAMEA Oil and Gas Industry Line Heaters Market by Category
CHAPTER 8: COMPETITIVE LANDSCAPE
- 8.1. Introduction
- 8.2. Top winning strategies
- 8.3. Product Mapping of Top 10 Player
- 8.4. Competitive Dashboard
- 8.5. Competitive Heatmap
- 8.6. Top player positioning, 2021
CHAPTER 9: COMPANY PROFILES
- 9.1. Arc Energy.
- 9.1.1. Company overview
- 9.1.2. Key Executives
- 9.1.3. Company snapshot
- 9.1.4. Operating business segments
- 9.1.5. Product portfolio
- 9.2. Forum Energy Technologies, Inc.
- 9.2.1. Company overview
- 9.2.2. Key Executives
- 9.2.3. Company snapshot
- 9.2.4. Operating business segments
- 9.2.5. Product portfolio
- 9.2.6. Business performance
- 9.3. ENERFLEX LTD.
- 9.3.1. Company overview
- 9.3.2. Key Executives
- 9.3.3. Company snapshot
- 9.3.4. Operating business segments
- 9.3.5. Product portfolio
- 9.3.6. Business performance
- 9.3.7. Key strategic moves and developments
- 9.4. Integrated Flow Solutions, Inc.
- 9.4.1. Company overview
- 9.4.2. Key Executives
- 9.4.3. Company snapshot
- 9.4.4. Operating business segments
- 9.4.5. Product portfolio
- 9.4.6. Key strategic moves and developments
- 9.5. Inclusivenergy LTD.
- 9.5.1. Company overview
- 9.5.2. Key Executives
- 9.5.3. Company snapshot
- 9.5.4. Operating business segments
- 9.5.5. Product portfolio
- 9.5.6. Key strategic moves and developments
- 9.6. Surplus Energy.
- 9.6.1. Company overview
- 9.6.2. Key Executives
- 9.6.3. Company snapshot
- 9.6.4. Operating business segments
- 9.6.5. Product portfolio
- 9.7. Honeywell International Inc.
- 9.7.1. Company overview
- 9.7.2. Key Executives
- 9.7.3. Company snapshot
- 9.7.4. Operating business segments
- 9.7.5. Product portfolio
- 9.7.6. Business performance
- 9.8. Allmand Bros., Inc.
- 9.8.1. Company overview
- 9.8.2. Key Executives
- 9.8.3. Company snapshot
- 9.8.4. Operating business segments
- 9.8.5. Product portfolio
- 9.8.6. Key strategic moves and developments
- 9.9. Sigma Thermal Inc
- 9.9.1. Company overview
- 9.9.2. Key Executives
- 9.9.3. Company snapshot
- 9.9.4. Operating business segments
- 9.9.5. Product portfolio
- 9.9.6. Key strategic moves and developments
- 9.10. 12:eleven Production Equipment
- 9.10.1. Company overview
- 9.10.2. Key Executives
- 9.10.3. Company snapshot
- 9.10.4. Operating business segments
- 9.10.5. Product portfolio
- 9.11. Aspire Energy Resources Inc.
- 9.11.1. Company overview
- 9.11.2. Key Executives
- 9.11.3. Company snapshot
- 9.11.4. Operating business segments
- 9.11.5. Product portfolio
- 9.11.6. Key strategic moves and developments
LIST OF TABLES
- TABLE 01. GLOBAL LINE HEATERS MARKET, BY TYPE, 2021-2031 ($THOUSAND)
- TABLE 02. LINE HEATERS MARKET FOR INDIRECT LINE HEATERS, BY REGION, 2021-2031 ($THOUSAND)
- TABLE 03. LINE HEATERS MARKET FOR DIRECT LINE HEATERS, BY REGION, 2021-2031 ($THOUSAND)
- TABLE 04. GLOBAL LINE HEATERS MARKET, BY SIZE, 2021-2031 ($THOUSAND)
- TABLE 05. LINE HEATERS MARKET FOR 1 MM BTU, BY REGION, 2021-2031 ($THOUSAND)
- TABLE 06. LINE HEATERS MARKET FOR 1.5 MM BTU, BY REGION, 2021-2031 ($THOUSAND)
- TABLE 07. LINE HEATERS MARKET FOR 2 MM BTU, BY REGION, 2021-2031 ($THOUSAND)
- TABLE 08. GLOBAL LINE HEATERS MARKET, BY END USE, 2021-2031 ($THOUSAND)
- TABLE 09. LINE HEATERS MARKET FOR OIL AND GAS INDUSTRY, BY REGION, 2021-2031 ($THOUSAND)
- TABLE 10. GLOBAL OIL AND GAS INDUSTRY LINE HEATERS MARKET, BY CATEGORY, 2021-2031 ($THOUSAND)
- TABLE 11. LINE HEATERS MARKET FOR UPSTREAM, BY REGION, 2021-2031 ($THOUSAND)
- TABLE 12. LINE HEATERS MARKET FOR DOWNSTREAM, BY REGION, 2021-2031 ($THOUSAND)
- TABLE 13. LINE HEATERS MARKET FOR MIDSTREAM, BY REGION, 2021-2031 ($THOUSAND)
- TABLE 14. LINE HEATERS MARKET FOR CHEMICAL INDUSTRY, BY REGION, 2021-2031 ($THOUSAND)
- TABLE 15. LINE HEATERS MARKET FOR OTHERS, BY REGION, 2021-2031 ($THOUSAND)
- TABLE 16. LINE HEATERS MARKET, BY REGION, 2021-2031 ($THOUSAND)
- TABLE 17. NORTH AMERICA LINE HEATERS MARKET, BY TYPE, 2021-2031 ($THOUSAND)
- TABLE 18. NORTH AMERICA LINE HEATERS MARKET, BY SIZE, 2021-2031 ($THOUSAND)
- TABLE 19. NORTH AMERICA LINE HEATERS MARKET, BY END USE, 2021-2031 ($THOUSAND)
- TABLE 20. NORTH AMERICA OIL AND GAS INDUSTRY LINE HEATERS MARKET, BY CATEGORY, 2021-2031 ($THOUSAND)
- TABLE 21. NORTH AMERICA LINE HEATERS MARKET, BY COUNTRY, 2021-2031 ($THOUSAND)
- TABLE 22. U.S. LINE HEATERS MARKET, BY TYPE, 2021-2031 ($THOUSAND)
- TABLE 23. U.S. LINE HEATERS MARKET, BY SIZE, 2021-2031 ($THOUSAND)
- TABLE 24. U.S. LINE HEATERS MARKET, BY END USE, 2021-2031 ($THOUSAND)
- TABLE 25. U.S. OIL AND GAS INDUSTRY LINE HEATERS MARKET, BY CATEGORY, 2021-2031 ($THOUSAND)
- TABLE 26. CANADA LINE HEATERS MARKET, BY TYPE, 2021-2031 ($THOUSAND)
- TABLE 27. CANADA LINE HEATERS MARKET, BY SIZE, 2021-2031 ($THOUSAND)
- TABLE 28. CANADA LINE HEATERS MARKET, BY END USE, 2021-2031 ($THOUSAND)
- TABLE 29. CANADA OIL AND GAS INDUSTRY LINE HEATERS MARKET, BY CATEGORY, 2021-2031 ($THOUSAND)
- TABLE 30. MEXICO LINE HEATERS MARKET, BY TYPE, 2021-2031 ($THOUSAND)
- TABLE 31. MEXICO LINE HEATERS MARKET, BY SIZE, 2021-2031 ($THOUSAND)
- TABLE 32. MEXICO LINE HEATERS MARKET, BY END USE, 2021-2031 ($THOUSAND)
- TABLE 33. MEXICO OIL AND GAS INDUSTRY LINE HEATERS MARKET, BY CATEGORY, 2021-2031 ($THOUSAND)
- TABLE 34. EUROPE LINE HEATERS MARKET, BY TYPE, 2021-2031 ($THOUSAND)
- TABLE 35. EUROPE LINE HEATERS MARKET, BY SIZE, 2021-2031 ($THOUSAND)
- TABLE 36. EUROPE LINE HEATERS MARKET, BY END USE, 2021-2031 ($THOUSAND)
- TABLE 37. EUROPE OIL AND GAS INDUSTRY LINE HEATERS MARKET, BY CATEGORY, 2021-2031 ($THOUSAND)
- TABLE 38. EUROPE LINE HEATERS MARKET, BY COUNTRY, 2021-2031 ($THOUSAND)
- TABLE 39. RUSSIA LINE HEATERS MARKET, BY TYPE, 2021-2031 ($THOUSAND)
- TABLE 40. RUSSIA LINE HEATERS MARKET, BY SIZE, 2021-2031 ($THOUSAND)
- TABLE 41. RUSSIA LINE HEATERS MARKET, BY END USE, 2021-2031 ($THOUSAND)
- TABLE 42. RUSSIA OIL AND GAS INDUSTRY LINE HEATERS MARKET, BY CATEGORY, 2021-2031 ($THOUSAND)
- TABLE 43. NORWAY LINE HEATERS MARKET, BY TYPE, 2021-2031 ($THOUSAND)
- TABLE 44. NORWAY LINE HEATERS MARKET, BY SIZE, 2021-2031 ($THOUSAND)
- TABLE 45. NORWAY LINE HEATERS MARKET, BY END USE, 2021-2031 ($THOUSAND)
- TABLE 46. NORWAY OIL AND GAS INDUSTRY LINE HEATERS MARKET, BY CATEGORY, 2021-2031 ($THOUSAND)
- TABLE 47. UK LINE HEATERS MARKET, BY TYPE, 2021-2031 ($THOUSAND)
- TABLE 48. UK LINE HEATERS MARKET, BY SIZE, 2021-2031 ($THOUSAND)
- TABLE 49. UK LINE HEATERS MARKET, BY END USE, 2021-2031 ($THOUSAND)
- TABLE 50. UK OIL AND GAS INDUSTRY LINE HEATERS MARKET, BY CATEGORY, 2021-2031 ($THOUSAND)
- TABLE 51. GERMANY LINE HEATERS MARKET, BY TYPE, 2021-2031 ($THOUSAND)
- TABLE 52. GERMANY LINE HEATERS MARKET, BY SIZE, 2021-2031 ($THOUSAND)
- TABLE 53. GERMANY LINE HEATERS MARKET, BY END USE, 2021-2031 ($THOUSAND)
- TABLE 54. GERMANY OIL AND GAS INDUSTRY LINE HEATERS MARKET, BY CATEGORY, 2021-2031 ($THOUSAND)
- TABLE 55. REST OF EUROPE LINE HEATERS MARKET, BY TYPE, 2021-2031 ($THOUSAND)
- TABLE 56. REST OF EUROPE LINE HEATERS MARKET, BY SIZE, 2021-2031 ($THOUSAND)
- TABLE 57. REST OF EUROPE LINE HEATERS MARKET, BY END USE, 2021-2031 ($THOUSAND)
- TABLE 58. REST OF EUROPE OIL AND GAS INDUSTRY LINE HEATERS MARKET, BY CATEGORY, 2021-2031 ($THOUSAND)
- TABLE 59. ASIA-PACIFIC LINE HEATERS MARKET, BY TYPE, 2021-2031 ($THOUSAND)
- TABLE 60. ASIA-PACIFIC LINE HEATERS MARKET, BY SIZE, 2021-2031 ($THOUSAND)
- TABLE 61. ASIA-PACIFIC LINE HEATERS MARKET, BY END USE, 2021-2031 ($THOUSAND)
- TABLE 62. ASIA-PACIFIC OIL AND GAS INDUSTRY LINE HEATERS MARKET, BY CATEGORY, 2021-2031 ($THOUSAND)
- TABLE 63. ASIA-PACIFIC LINE HEATERS MARKET, BY COUNTRY, 2021-2031 ($THOUSAND)
- TABLE 64. CHINA LINE HEATERS MARKET, BY TYPE, 2021-2031 ($THOUSAND)
- TABLE 65. CHINA LINE HEATERS MARKET, BY SIZE, 2021-2031 ($THOUSAND)
- TABLE 66. CHINA LINE HEATERS MARKET, BY END USE, 2021-2031 ($THOUSAND)
- TABLE 67. CHINA OIL AND GAS INDUSTRY LINE HEATERS MARKET, BY CATEGORY, 2021-2031 ($THOUSAND)
- TABLE 68. INDIA LINE HEATERS MARKET, BY TYPE, 2021-2031 ($THOUSAND)
- TABLE 69. INDIA LINE HEATERS MARKET, BY SIZE, 2021-2031 ($THOUSAND)
- TABLE 70. INDIA LINE HEATERS MARKET, BY END USE, 2021-2031 ($THOUSAND)
- TABLE 71. INDIA OIL AND GAS INDUSTRY LINE HEATERS MARKET, BY CATEGORY, 2021-2031 ($THOUSAND)
- TABLE 72. JAPAN LINE HEATERS MARKET, BY TYPE, 2021-2031 ($THOUSAND)
- TABLE 73. JAPAN LINE HEATERS MARKET, BY SIZE, 2021-2031 ($THOUSAND)
- TABLE 74. JAPAN LINE HEATERS MARKET, BY END USE, 2021-2031 ($THOUSAND)
- TABLE 75. JAPAN OIL AND GAS INDUSTRY LINE HEATERS MARKET, BY CATEGORY, 2021-2031 ($THOUSAND)
- TABLE 76. SOUTH KOREA LINE HEATERS MARKET, BY TYPE, 2021-2031 ($THOUSAND)
- TABLE 77. SOUTH KOREA LINE HEATERS MARKET, BY SIZE, 2021-2031 ($THOUSAND)
- TABLE 78. SOUTH KOREA LINE HEATERS MARKET, BY END USE, 2021-2031 ($THOUSAND)
- TABLE 79. SOUTH KOREA OIL AND GAS INDUSTRY LINE HEATERS MARKET, BY CATEGORY, 2021-2031 ($THOUSAND)
- TABLE 80. REST OF ASIA-PACIFIC LINE HEATERS MARKET, BY TYPE, 2021-2031 ($THOUSAND)
- TABLE 81. REST OF ASIA-PACIFIC LINE HEATERS MARKET, BY SIZE, 2021-2031 ($THOUSAND)
- TABLE 82. REST OF ASIA-PACIFIC LINE HEATERS MARKET, BY END USE, 2021-2031 ($THOUSAND)
- TABLE 83. REST OF ASIA-PACIFIC OIL AND GAS INDUSTRY LINE HEATERS MARKET, BY CATEGORY, 2021-2031 ($THOUSAND)
- TABLE 84. LAMEA LINE HEATERS MARKET, BY TYPE, 2021-2031 ($THOUSAND)
- TABLE 85. LAMEA LINE HEATERS MARKET, BY SIZE, 2021-2031 ($THOUSAND)
- TABLE 86. LAMEA LINE HEATERS MARKET, BY END USE, 2021-2031 ($THOUSAND)
- TABLE 87. LAMEA OIL AND GAS INDUSTRY LINE HEATERS MARKET, BY CATEGORY, 2021-2031 ($THOUSAND)
- TABLE 88. LAMEA LINE HEATERS MARKET, BY COUNTRY, 2021-2031 ($THOUSAND)
- TABLE 89. BRAZIL LINE HEATERS MARKET, BY TYPE, 2021-2031 ($THOUSAND)
- TABLE 90. BRAZIL LINE HEATERS MARKET, BY SIZE, 2021-2031 ($THOUSAND)
- TABLE 91. BRAZIL LINE HEATERS MARKET, BY END USE, 2021-2031 ($THOUSAND)
- TABLE 92. BRAZIL OIL AND GAS INDUSTRY LINE HEATERS MARKET, BY CATEGORY, 2021-2031 ($THOUSAND)
- TABLE 93. SAUDI ARABIA LINE HEATERS MARKET, BY TYPE, 2021-2031 ($THOUSAND)
- TABLE 94. SAUDI ARABIA LINE HEATERS MARKET, BY SIZE, 2021-2031 ($THOUSAND)
- TABLE 95. SAUDI ARABIA LINE HEATERS MARKET, BY END USE, 2021-2031 ($THOUSAND)
- TABLE 96. SAUDI ARABIA OIL AND GAS INDUSTRY LINE HEATERS MARKET, BY CATEGORY, 2021-2031 ($THOUSAND)
- TABLE 97. UAE LINE HEATERS MARKET, BY TYPE, 2021-2031 ($THOUSAND)
- TABLE 98. UAE LINE HEATERS MARKET, BY SIZE, 2021-2031 ($THOUSAND)
- TABLE 99. UAE LINE HEATERS MARKET, BY END USE, 2021-2031 ($THOUSAND)
- TABLE 100. UAE OIL AND GAS INDUSTRY LINE HEATERS MARKET, BY CATEGORY, 2021-2031 ($THOUSAND)
- TABLE 101. REST OF LAMEA LINE HEATERS MARKET, BY TYPE, 2021-2031 ($THOUSAND)
- TABLE 102. REST OF LAMEA LINE HEATERS MARKET, BY SIZE, 2021-2031 ($THOUSAND)
- TABLE 103. REST OF LAMEA LINE HEATERS MARKET, BY END USE, 2021-2031 ($THOUSAND)
- TABLE 104. REST OF LAMEA OIL AND GAS INDUSTRY LINE HEATERS MARKET, BY CATEGORY, 2021-2031 ($THOUSAND)
- TABLE 105. ARC ENERGY.: KEY EXECUTIVES
- TABLE 106. ARC ENERGY.: COMPANY SNAPSHOT
- TABLE 107. ARC ENERGY.: PRODUCT SEGMENTS
- TABLE 108. ARC ENERGY.: PRODUCT PORTFOLIO
- TABLE 109. FORUM ENERGY TECHNOLOGIES, INC.: KEY EXECUTIVES
- TABLE 110. FORUM ENERGY TECHNOLOGIES, INC.: COMPANY SNAPSHOT
- TABLE 111. FORUM ENERGY TECHNOLOGIES, INC.: PRODUCT SEGMENTS
- TABLE 112. FORUM ENERGY TECHNOLOGIES, INC.: PRODUCT PORTFOLIO
- TABLE 113. ENERFLEX LTD.: KEY EXECUTIVES
- TABLE 114. ENERFLEX LTD.: COMPANY SNAPSHOT
- TABLE 115. ENERFLEX LTD.: PRODUCT SEGMENTS
- TABLE 116. ENERFLEX LTD.: PRODUCT PORTFOLIO
- TABLE 117. ENERFLEX LTD.: KEY STRATERGIES
- TABLE 118. INTEGRATED FLOW SOLUTIONS, INC.: KEY EXECUTIVES
- TABLE 119. INTEGRATED FLOW SOLUTIONS, INC.: COMPANY SNAPSHOT
- TABLE 120. INTEGRATED FLOW SOLUTIONS, INC.: PRODUCT SEGMENTS
- TABLE 121. INTEGRATED FLOW SOLUTIONS, INC.: PRODUCT PORTFOLIO
- TABLE 122. INTEGRATED FLOW SOLUTIONS, INC.: KEY STRATERGIES
- TABLE 123. INCLUSIVENERGY LTD.: KEY EXECUTIVES
- TABLE 124. INCLUSIVENERGY LTD.: COMPANY SNAPSHOT
- TABLE 125. INCLUSIVENERGY LTD.: PRODUCT SEGMENTS
- TABLE 126. INCLUSIVENERGY LTD.: PRODUCT PORTFOLIO
- TABLE 127. INCLUSIVENERGY LTD.: KEY STRATERGIES
- TABLE 128. SURPLUS ENERGY.: KEY EXECUTIVES
- TABLE 129. SURPLUS ENERGY.: COMPANY SNAPSHOT
- TABLE 130. SURPLUS ENERGY.: PRODUCT SEGMENTS
- TABLE 131. SURPLUS ENERGY.: PRODUCT PORTFOLIO
- TABLE 132. HONEYWELL INTERNATIONAL INC.: KEY EXECUTIVES
- TABLE 133. HONEYWELL INTERNATIONAL INC.: COMPANY SNAPSHOT
- TABLE 134. HONEYWELL INTERNATIONAL INC.: PRODUCT SEGMENTS
- TABLE 135. HONEYWELL INTERNATIONAL INC.: PRODUCT PORTFOLIO
- TABLE 136. ALLMAND BROS., INC.: KEY EXECUTIVES
- TABLE 137. ALLMAND BROS., INC.: COMPANY SNAPSHOT
- TABLE 138. ALLMAND BROS., INC.: PRODUCT SEGMENTS
- TABLE 139. ALLMAND BROS., INC.: PRODUCT PORTFOLIO
- TABLE 140. ALLMAND BROS., INC.: KEY STRATERGIES
- TABLE 141. SIGMA THERMAL INC: KEY EXECUTIVES
- TABLE 142. SIGMA THERMAL INC: COMPANY SNAPSHOT
- TABLE 143. SIGMA THERMAL INC: PRODUCT SEGMENTS
- TABLE 144. SIGMA THERMAL INC: PRODUCT PORTFOLIO
- TABLE 145. SIGMA THERMAL INC: KEY STRATERGIES
- TABLE 146. 12:ELEVEN PRODUCTION EQUIPMENT: KEY EXECUTIVES
- TABLE 147. 12:ELEVEN PRODUCTION EQUIPMENT: COMPANY SNAPSHOT
- TABLE 148. 12:ELEVEN PRODUCTION EQUIPMENT: PRODUCT SEGMENTS
- TABLE 149. 12:ELEVEN PRODUCTION EQUIPMENT: PRODUCT PORTFOLIO
- TABLE 150. ASPIRE ENERGY RESOURCES INC.: KEY EXECUTIVES
- TABLE 151. ASPIRE ENERGY RESOURCES INC.: COMPANY SNAPSHOT
- TABLE 152. ASPIRE ENERGY RESOURCES INC.: PRODUCT SEGMENTS
- TABLE 153. ASPIRE ENERGY RESOURCES INC.: PRODUCT PORTFOLIO
- TABLE 154. ASPIRE ENERGY RESOURCES INC.: KEY STRATERGIES
LIST OF FIGURES
- FIGURE 01. LINE HEATERS MARKET, 2021-2031
- FIGURE 02. SEGMENTATION OF LINE HEATERS MARKET, 2021-2031
- FIGURE 03. TOP INVESTMENT POCKETS IN LINE HEATERS MARKET (2022-2031)
- FIGURE 04. LOW BARGAINING POWER OF SUPPLIERS
- FIGURE 05. LOW BARGAINING POWER OF BUYERS
- FIGURE 06. LOW THREAT OF SUBSTITUTES
- FIGURE 07. LOW THREAT OF NEW ENTRANTS
- FIGURE 08. LOW INTENSITY OF RIVALRY
- FIGURE 09. DRIVERS, RESTRAINTS AND OPPORTUNITIES: GLOBALLINE HEATERS MARKET
- FIGURE 10. VALUE CHAIN ANALYSIS: LINE HEATERS MARKET
- FIGURE 11. LINE HEATERS MARKET, BY TYPE, 2021(%)
- FIGURE 12. COMPARATIVE SHARE ANALYSIS OF LINE HEATERS MARKET FOR INDIRECT LINE HEATERS, BY COUNTRY 2021 AND 2031(%)
- FIGURE 13. COMPARATIVE SHARE ANALYSIS OF LINE HEATERS MARKET FOR DIRECT LINE HEATERS, BY COUNTRY 2021 AND 2031(%)
- FIGURE 14. LINE HEATERS MARKET, BY SIZE, 2021(%)
- FIGURE 15. COMPARATIVE SHARE ANALYSIS OF LINE HEATERS MARKET FOR 1 MM BTU, BY COUNTRY 2021 AND 2031(%)
- FIGURE 16. COMPARATIVE SHARE ANALYSIS OF LINE HEATERS MARKET FOR 1.5 MM BTU, BY COUNTRY 2021 AND 2031(%)
- FIGURE 17. COMPARATIVE SHARE ANALYSIS OF LINE HEATERS MARKET FOR 2 MM BTU, BY COUNTRY 2021 AND 2031(%)
- FIGURE 18. LINE HEATERS MARKET, BY END USE, 2021(%)
- FIGURE 19. COMPARATIVE SHARE ANALYSIS OF LINE HEATERS MARKET FOR OIL AND GAS INDUSTRY, BY COUNTRY 2021 AND 2031(%)
- FIGURE 20. COMPARATIVE SHARE ANALYSIS OF LINE HEATERS MARKET FOR CHEMICAL INDUSTRY, BY COUNTRY 2021 AND 2031(%)
- FIGURE 21. COMPARATIVE SHARE ANALYSIS OF LINE HEATERS MARKET FOR OTHERS, BY COUNTRY 2021 AND 2031(%)
- FIGURE 22. LINE HEATERS MARKET BY REGION, 2021
- FIGURE 23. U.S. LINE HEATERS MARKET, 2021-2031 ($THOUSAND)
- FIGURE 24. CANADA LINE HEATERS MARKET, 2021-2031 ($THOUSAND)
- FIGURE 25. MEXICO LINE HEATERS MARKET, 2021-2031 ($THOUSAND)
- FIGURE 26. RUSSIA LINE HEATERS MARKET, 2021-2031 ($THOUSAND)
- FIGURE 27. NORWAY LINE HEATERS MARKET, 2021-2031 ($THOUSAND)
- FIGURE 28. UK LINE HEATERS MARKET, 2021-2031 ($THOUSAND)
- FIGURE 29. GERMANY LINE HEATERS MARKET, 2021-2031 ($THOUSAND)
- FIGURE 30. REST OF EUROPE LINE HEATERS MARKET, 2021-2031 ($THOUSAND)
- FIGURE 31. CHINA LINE HEATERS MARKET, 2021-2031 ($THOUSAND)
- FIGURE 32. INDIA LINE HEATERS MARKET, 2021-2031 ($THOUSAND)
- FIGURE 33. JAPAN LINE HEATERS MARKET, 2021-2031 ($THOUSAND)
- FIGURE 34. SOUTH KOREA LINE HEATERS MARKET, 2021-2031 ($THOUSAND)
- FIGURE 35. REST OF ASIA-PACIFIC LINE HEATERS MARKET, 2021-2031 ($THOUSAND)
- FIGURE 36. BRAZIL LINE HEATERS MARKET, 2021-2031 ($THOUSAND)
- FIGURE 37. SAUDI ARABIA LINE HEATERS MARKET, 2021-2031 ($THOUSAND)
- FIGURE 38. UAE LINE HEATERS MARKET, 2021-2031 ($THOUSAND)
- FIGURE 39. REST OF LAMEA LINE HEATERS MARKET, 2021-2031 ($THOUSAND)
- FIGURE 40. TOP WINNING STRATEGIES, BY YEAR
- FIGURE 41. TOP WINNING STRATEGIES, BY DEVELOPMENT
- FIGURE 42. TOP WINNING STRATEGIES, BY COMPANY
- FIGURE 43. PRODUCT MAPPING OF TOP 10 PLAYERS
- FIGURE 44. COMPETITIVE DASHBOARD
- FIGURE 45. COMPETITIVE HEATMAP: LINE HEATERS MARKET
- FIGURE 46. TOP PLAYER POSITIONING, 2021
- FIGURE 47. HONEYWELL INTERNATIONAL INC.: NET REVENUE, 2020-2022 ($MILLION)
- FIGURE 48. HONEYWELL INTERNATIONAL INC.: REVENUE SHARE BY SEGMENT, 2022 (%)


