


 |
市场调查报告书
商品编码
1298348
宫颈癌诊断市场:按类型、年龄组:2023-2032年全球机会分析和行业预测Cervical Cancer Diagnostic Market By Type (Pap Smear Tests, HPV test, Biopsy and ECC, Colposcopy Tests, Others), By Age group (20 to 40 years, above 40 years): Global Opportunity Analysis and Industry Forecast, 2023-2032 |
||||||
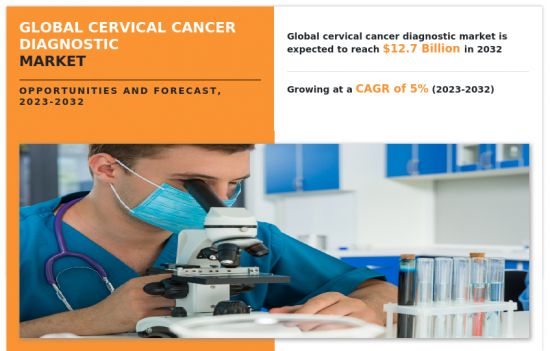
2022 年,全球宫颈癌诊断市场价值为 78 亿美元,预计到 2032 年将达到 126 亿美元,2023 年至 2032 年復合年增长率为 5%。
宫颈癌是一种在子宫颈任何部位形成的癌症。 子宫颈是阴道和子宫(子宫)之间的开口。 它是生殖系统的一部分,有时称为子宫颈。 几乎所有宫颈癌都是由一种人乳头瘤病毒 (HPV) 感染引起的。 儘管宫颈癌始于具有癌前期变化(癌前期)的细胞,但只有一些患有癌前期宫颈的女性才会患上癌症。 对于大多数女性来说,癌前细胞无需任何治疗即可消失。 然而,在一些女性中,癌前病变会转变为真正的(侵袭性)癌症。 治疗宫颈癌前期可以预防几乎所有宫颈癌。 宫颈癌筛查的目的是在可以治疗或治癒的早期阶段发现癌前或癌性癌症。 定期检查可以预防宫颈癌并挽救生命。 宫颈癌筛查测试包括 HPV 测试和巴氏涂片测试。
宫颈癌诊断市场的增长是由研发活动增加、宫颈癌患病率上升、政府和私营机构产品开发支出激增以及诊断测试产品技术进步推动的。增加去医院进行癌症筛查的次数。 例如,根据美国疾病控制与预防中心(CDC)2022年8月发布的数据,美国每年约有13,000名女性新诊断出患有宫颈癌,约4,000名女性死于该癌症。 2019 年,当美国有发病率数据时,每 10 万名女性报告有 8 例新发宫颈癌病例,其中 2 名女性死于该癌症。
此外,诊断研究实验室不断增加的研究渠道以及人们对更严格癌症筛查的认识不断增强也促进了市场的增长。 例如,根据世界卫生组织 (WHO) 的数据,一月被庆祝为宫颈癌宣传月。 现在是提高人们对宫颈癌和 HPV 疫苗接种认识的好时机。 消除宫颈癌也是宫颈癌宣传月的主题。 然而,HPV 疫苗的可用性、不准确的子宫颈抹片检查和其他类型的宫颈癌筛查预计将阻碍市场的增长。
内容
第1章简介
第 2 章执行摘要
第3章市场概述
- 市场定义和范围
- 主要发现
- 影响因素
- 主要投资机会
- 波特五力分析
- 供应商的议价能力
- 买家的议价能力
- 替代品的威胁
- 新进入者的威胁
- 竞争强度
- 市场动态
- 驱动程序
- 宫颈癌患病率不断上升
- HPV 感染患者增加
- 不安全性行为激增
- 阻碍因素
- 宫颈癌替代诊断方法的可用性
- 机会
- 肥胖人数激增
- 驱动程序
- COVID-19 对市场的影响分析
第 4 章宫颈癌诊断市场:按类型
- 概述
- 市场规模和预测
- 子宫颈抹片检查
- 主要市场趋势、增长动力和机遇
- 市场规模和预测:按地区划分
- 市场份额分析:按国家/地区划分
- HPV检测
- 主要市场趋势、增长因素和机遇
- 市场规模和预测:按地区划分
- 市场份额分析:按国家/地区划分
- 活检和 ECC
- 主要市场趋势、增长因素和机遇
- 市场规模和预测:按地区划分
- 市场份额分析:按国家/地区划分
- 阴道镜检查
- 主要市场趋势、增长因素和机遇
- 市场规模和预测:按地区划分
- 市场份额分析:按国家/地区划分
- 其他
- 主要市场趋势、增长因素和机遇
- 市场规模和预测:按地区划分
- 市场份额分析:按国家/地区划分
第5章宫颈癌诊断市场:按年龄组
- 概述
- 市场规模和预测
- 20-40岁
- 主要市场趋势、增长因素和机遇
- 按地区划分的市场规模和预测
- 市场份额分析:按国家/地区划分
- 40多年
- 主要市场趋势、增长因素和机遇
- 市场规模和预测:按地区划分
- 市场份额分析:按国家/地区划分
第6章宫颈癌诊断市场:按地区
- 概述
- 市场规模/预测:按地区划分
- 北美
- 主要趋势和机遇
- 市场规模/预测:按类型
- 市场规模/预测:按年龄段划分
- 市场规模/预测:按国家/地区划分
- 美国
- 主要市场趋势、增长动力和机遇
- 市场规模/预测:按类型
- 市场规模/预测:按年龄段划分
- 加拿大
- 主要市场趋势、增长动力和机遇
- 市场规模/预测:按类型
- 市场规模/预测:按年龄段划分
- 墨西哥
- 主要市场趋势、增长动力和机遇
- 市场规模/预测:按类型
- 市场规模/预测:按年龄段划分
- 欧洲
- 主要趋势和机遇
- 市场规模/预测:按类型
- 市场规模/预测:按年龄段划分
- 市场规模/预测:按国家/地区划分
- 德国
- 主要市场趋势、增长动力和机遇
- 市场规模/预测:按类型
- 市场规模/预测:按年龄段划分
- 法国
- 主要市场趋势、增长动力和机遇
- 市场规模/预测:按类型
- 市场规模/预测:按年龄段划分
- 英国
- 主要市场趋势、增长动力和机遇
- 市场规模/预测:按类型
- 市场规模/预测:按年龄段划分
- 意大利
- 主要市场趋势、增长动力和机遇
- 市场规模/预测:按类型
- 市场规模/预测:按年龄段划分
- 西班牙
- 主要市场趋势、增长动力和机遇
- 市场规模/预测:按类型
- 市场规模/预测:按年龄段划分
- 欧洲其他地区
- 主要市场趋势、增长动力和机遇
- 市场规模/预测:按类型
- 市场规模/预测:按年龄段划分
- 亚太地区
- 主要趋势和机遇
- 市场规模/预测:按类型
- 市场规模/预测:按年龄段划分
- 市场规模/预测:按国家/地区划分
- 中国
- 主要市场趋势、增长动力和机遇
- 市场规模/预测:按类型
- 市场规模/预测:按年龄段划分
- 日本
- 主要市场趋势、增长动力和机遇
- 市场规模/预测:按类型
- 市场规模/预测:按年龄段划分
- 印度
- 主要市场趋势、增长动力和机遇
- 市场规模/预测:按类型
- 市场规模/预测:按年龄段划分
- 澳大利亚
- 主要市场趋势、增长动力和机遇
- 市场规模/预测:按类型
- 市场规模/预测:按年龄段划分
- 韩国
- 主要市场趋势、增长动力和机遇
- 市场规模/预测:按类型
- 市场规模/预测:按年龄段划分
- 亚太地区其他地区
- 主要市场趋势、增长动力和机遇
- 市场规模/预测:按类型
- 市场规模/预测:按年龄段划分
- 拉丁美洲/中东/非洲
- 主要趋势和机遇
- 市场规模/预测:按类型
- 市场规模/预测:按年龄段划分
- 市场规模/预测:按国家/地区划分
- 巴西
- 主要市场趋势、增长动力和机遇
- 市场规模/预测:按类型
- 市场规模/预测:按年龄段划分
- 沙特阿拉伯
- 主要市场趋势、增长动力和机遇
- 市场规模/预测:按类型
- 市场规模/预测:按年龄段划分
- 南非
- 主要市场趋势、增长动力和机遇
- 市场规模/预测:按类型
- 市场规模/预测:按年龄段划分
- 其他地区
- 主要市场趋势、增长动力和机遇
- 市场规模/预测:按类型
- 市场规模/预测:按年龄段划分
第7章竞争格局
- 简介
- 关键成功策略
- 10家主要公司的产品图谱
- 竞赛仪表板
- 比赛热图
- 2022 年顶级公司定位
第8章公司简介
- Abbott Laboratories
- Qaigen NV
- Carl Zeiss AG
- Thermo Fisher Scientific Inc.
- Becton, Dickinson and Company
- Hologic Inc.
- F. Hoffmann-La Roche AG
- CooperSurgical Inc.
- Siemens Healthineers
- Dysis Medical ltd.
The Global Cervical Cancer Diagnostic Market valued for $7.8 billion in 2022 and is estimated to reach $12.6 billion by 2032, exhibiting a CAGR of 5% from 2023 to 2032.
Cervical cancer is a type of cancer found anywhere in the cervix. The cervix is the opening between the vagina and the womb (uterus). It is part of the reproductive system and is sometimes called the neck of the womb. Nearly all cervical cancers are caused by an infection from certain types of human papillomavirus (HPV). Although cervical cancers start from cells with pre-cancerous changes (pre-cancers), only some of the women with pre-cancers of the cervix will develop cancer. For most women, pre-cancerous cells will go away without any treatment. But, in some women pre-cancers turn into true (invasive) cancers. Treating cervical pre-cancers can prevent almost all cervical cancers. The goal of cervical cancer screening is to find pre-cancer or cancer early when it is more treatable and curable. Regular screening can prevent cervical cancers and save lives. The tests for cervical cancer screening are HPV test and the Pap test.
The growth of the cervical cancer diagnostic market is driven by increase in number of research and development activities, rise in prevalence of cervical cancer, surge in expenditure on the product development by the government and private organizations and increase in the technological advancements of the diagnostics tests products and increase the number of hospital visits of the patients for cancer screening. For instance, according to the data by the Centers of Disease Control and Prevention (CDC), published in August 2022, about 13,000 new cases of cervical cancer are diagnosed and about 4,000 women died due to this cancer each year in the U.S. Similarly, 12,795 new cases of cervical cancer were reported among women, and 4,152 women died of this cancer. For every 100,000 women, 8 new cervical cancer cases were reported, and 2 women died of this cancer in 2019, the year for which incidence data was available in the U.S.
Moreover, increase in research pipeline among the diagnostic research organizations and rise in awareness about strictness in the cancer screening also helps in the growth of the market. For instance, according to the data of the World Health Organization (WHO), January is celebrated as Cervical Cancer Awareness Month. It gives a perfect opportunity for World Health Organization and partners to raise awareness about cervical cancer and HPV vaccination. It also focuses on the elimination of cervical cancer as the theme for its Cervical Cancer Awareness Month. However, HPV vaccination, inaccurate pap smear testing and the availability of other types of screening of cervical cancer are expected to hinder the growth of the market.
The cervical cancer diagnostic market is segmented on the basis of type, age group and region. On the basis of type, the market is categorized into pap smear tests, HPV test, biopsy and ECC, colposcopy tests and others. On the basis of age group, the market is classified into 20 to 40 years, and above 40 years. Region wise, the market is studied across North America (the U.S., Canada, and Mexico), Europe (Germany, France, UK, Italy, Spain, and Rest of Europe), Asia-Pacific (Japan, China, Australia, India, South Korea and rest of Asia-Pacific), and LAMEA (Brazil, South Africa, Saudi Arabia, and rest of LAMEA).
Major companies profiled in the report include: Abbott Laboratories, Qaigen NV, Carl Zeiss AG, Thermo Fisher Scientific Inc., Becton, Dickinson and Company, Hologic Inc, F. Hoffmann-La Roche AG, Siemens Healthineers, CooperSurgical Inc., and Dysis Medical ltd.
Key Benefits For Stakeholders
- This report provides a quantitative analysis of the market segments, current trends, estimations, and dynamics of the global cervical cancer diagnostic market analysis from 2022 to 2032 to identify the prevailing global cervical cancer diagnostic market opportunities.
- The market research is offered along with information related to key drivers, restraints, and opportunities.
- Porter's five forces analysis highlights the potency of buyers and suppliers to enable stakeholders make profit-oriented business decisions and strengthen their supplier-buyer network.
- In-depth analysis of the global cervical cancer diagnostic market segmentation assists to determine the prevailing market opportunities.
- Major countries in each region are mapped according to their revenue contribution to the global market.
- Market player positioning facilitates benchmarking and provides a clear understanding of the present position of the market players.
- The report includes the analysis of the regional as well as global global cervical cancer diagnostic market trends, key players, market segments, application areas, and market growth strategies.
Key Market Segments
By Type
- Pap Smear Tests
- HPV test
- Biopsy and ECC
- Colposcopy Tests
- Others
By Age group
- 20 to 40 years
- above 40 years
By Region
- North America
- U.S.
- Canada
- Mexico
- Europe
- Germany
- France
- UK
- Italy
- Spain
- Rest of Europe
- Asia-Pacific
- China
- Japan
- India
- Australia
- South Korea
- Rest of Asia-Pacific
- LAMEA
- Brazil
- Saudi Arabia
- South Africa
- Rest of LAMEA
Key Market Players:
- Abbott Laboratories
- Becton, Dickinson and Company
- Carl Zeiss AG
- CooperSurgical Inc.
- Dysis Medical ltd.
- F. Hoffmann-La Roche AG
- Hologic Inc.
- Qaigen NV
- Siemens Healthineers
- Thermo Fisher Scientific Inc.
TABLE OF CONTENTS
CHAPTER 1: INTRODUCTION
- 1.1. Report description
- 1.2. Key market segments
- 1.3. Key benefits to the stakeholders
- 1.4. Research Methodology
- 1.4.1. Primary research
- 1.4.2. Secondary research
- 1.4.3. Analyst tools and models
CHAPTER 2: EXECUTIVE SUMMARY
- 2.1. CXO Perspective
CHAPTER 3: MARKET OVERVIEW
- 3.1. Market definition and scope
- 3.2. Key findings
- 3.2.1. Top impacting factors
- 3.2.2. Top investment pockets
- 3.3. Porter's five forces analysis
- 3.3.1. Bargaining power of suppliers
- 3.3.2. Bargaining power of buyers
- 3.3.3. Threat of substitutes
- 3.3.4. Threat of new entrants
- 3.3.5. Intensity of rivalry
- 3.4. Market dynamics
- 3.4.1. Drivers
- 3.4.1.1. Increase in the prevalence of cervical cancer
- 3.4.1.2. Increase in number of patients suffering from HPV infection
- 3.4.1.3. Surge in incidences of unsafe sex
- 3.4.1. Drivers
- 3.4.2. Restraints
- 3.4.2.1. Availability of alternative diagnosis methods of cervical cancer
- 3.4.3. Opportunities
- 3.4.3.1. Surge in prevalence of obesity
- 3.5. COVID-19 Impact Analysis on the market
CHAPTER 4: CERVICAL CANCER DIAGNOSTIC MARKET, BY TYPE
- 4.1. Overview
- 4.1.1. Market size and forecast
- 4.2. Pap Smear Tests
- 4.2.1. Key market trends, growth factors and opportunities
- 4.2.2. Market size and forecast, by region
- 4.2.3. Market share analysis by country
- 4.3. HPV test
- 4.3.1. Key market trends, growth factors and opportunities
- 4.3.2. Market size and forecast, by region
- 4.3.3. Market share analysis by country
- 4.4. Biopsy and ECC
- 4.4.1. Key market trends, growth factors and opportunities
- 4.4.2. Market size and forecast, by region
- 4.4.3. Market share analysis by country
- 4.5. Colposcopy Tests
- 4.5.1. Key market trends, growth factors and opportunities
- 4.5.2. Market size and forecast, by region
- 4.5.3. Market share analysis by country
- 4.6. Others
- 4.6.1. Key market trends, growth factors and opportunities
- 4.6.2. Market size and forecast, by region
- 4.6.3. Market share analysis by country
CHAPTER 5: CERVICAL CANCER DIAGNOSTIC MARKET, BY AGE GROUP
- 5.1. Overview
- 5.1.1. Market size and forecast
- 5.2. 20 to 40 years
- 5.2.1. Key market trends, growth factors and opportunities
- 5.2.2. Market size and forecast, by region
- 5.2.3. Market share analysis by country
- 5.3. above 40 years
- 5.3.1. Key market trends, growth factors and opportunities
- 5.3.2. Market size and forecast, by region
- 5.3.3. Market share analysis by country
CHAPTER 6: CERVICAL CANCER DIAGNOSTIC MARKET, BY REGION
- 6.1. Overview
- 6.1.1. Market size and forecast By Region
- 6.2. North America
- 6.2.1. Key trends and opportunities
- 6.2.2. Market size and forecast, by Type
- 6.2.3. Market size and forecast, by Age group
- 6.2.4. Market size and forecast, by country
- 6.2.4.1. U.S.
- 6.2.4.1.1. Key market trends, growth factors and opportunities
- 6.2.4.1.2. Market size and forecast, by Type
- 6.2.4.1.3. Market size and forecast, by Age group
- 6.2.4.2. Canada
- 6.2.4.2.1. Key market trends, growth factors and opportunities
- 6.2.4.2.2. Market size and forecast, by Type
- 6.2.4.2.3. Market size and forecast, by Age group
- 6.2.4.3. Mexico
- 6.2.4.3.1. Key market trends, growth factors and opportunities
- 6.2.4.3.2. Market size and forecast, by Type
- 6.2.4.3.3. Market size and forecast, by Age group
- 6.3. Europe
- 6.3.1. Key trends and opportunities
- 6.3.2. Market size and forecast, by Type
- 6.3.3. Market size and forecast, by Age group
- 6.3.4. Market size and forecast, by country
- 6.3.4.1. Germany
- 6.3.4.1.1. Key market trends, growth factors and opportunities
- 6.3.4.1.2. Market size and forecast, by Type
- 6.3.4.1.3. Market size and forecast, by Age group
- 6.3.4.2. France
- 6.3.4.2.1. Key market trends, growth factors and opportunities
- 6.3.4.2.2. Market size and forecast, by Type
- 6.3.4.2.3. Market size and forecast, by Age group
- 6.3.4.3. UK
- 6.3.4.3.1. Key market trends, growth factors and opportunities
- 6.3.4.3.2. Market size and forecast, by Type
- 6.3.4.3.3. Market size and forecast, by Age group
- 6.3.4.4. Italy
- 6.3.4.4.1. Key market trends, growth factors and opportunities
- 6.3.4.4.2. Market size and forecast, by Type
- 6.3.4.4.3. Market size and forecast, by Age group
- 6.3.4.5. Spain
- 6.3.4.5.1. Key market trends, growth factors and opportunities
- 6.3.4.5.2. Market size and forecast, by Type
- 6.3.4.5.3. Market size and forecast, by Age group
- 6.3.4.6. Rest of Europe
- 6.3.4.6.1. Key market trends, growth factors and opportunities
- 6.3.4.6.2. Market size and forecast, by Type
- 6.3.4.6.3. Market size and forecast, by Age group
- 6.4. Asia-Pacific
- 6.4.1. Key trends and opportunities
- 6.4.2. Market size and forecast, by Type
- 6.4.3. Market size and forecast, by Age group
- 6.4.4. Market size and forecast, by country
- 6.4.4.1. China
- 6.4.4.1.1. Key market trends, growth factors and opportunities
- 6.4.4.1.2. Market size and forecast, by Type
- 6.4.4.1.3. Market size and forecast, by Age group
- 6.4.4.2. Japan
- 6.4.4.2.1. Key market trends, growth factors and opportunities
- 6.4.4.2.2. Market size and forecast, by Type
- 6.4.4.2.3. Market size and forecast, by Age group
- 6.4.4.3. India
- 6.4.4.3.1. Key market trends, growth factors and opportunities
- 6.4.4.3.2. Market size and forecast, by Type
- 6.4.4.3.3. Market size and forecast, by Age group
- 6.4.4.4. Australia
- 6.4.4.4.1. Key market trends, growth factors and opportunities
- 6.4.4.4.2. Market size and forecast, by Type
- 6.4.4.4.3. Market size and forecast, by Age group
- 6.4.4.5. South Korea
- 6.4.4.5.1. Key market trends, growth factors and opportunities
- 6.4.4.5.2. Market size and forecast, by Type
- 6.4.4.5.3. Market size and forecast, by Age group
- 6.4.4.6. Rest of Asia-Pacific
- 6.4.4.6.1. Key market trends, growth factors and opportunities
- 6.4.4.6.2. Market size and forecast, by Type
- 6.4.4.6.3. Market size and forecast, by Age group
- 6.5. LAMEA
- 6.5.1. Key trends and opportunities
- 6.5.2. Market size and forecast, by Type
- 6.5.3. Market size and forecast, by Age group
- 6.5.4. Market size and forecast, by country
- 6.5.4.1. Brazil
- 6.5.4.1.1. Key market trends, growth factors and opportunities
- 6.5.4.1.2. Market size and forecast, by Type
- 6.5.4.1.3. Market size and forecast, by Age group
- 6.5.4.2. Saudi Arabia
- 6.5.4.2.1. Key market trends, growth factors and opportunities
- 6.5.4.2.2. Market size and forecast, by Type
- 6.5.4.2.3. Market size and forecast, by Age group
- 6.5.4.3. South Africa
- 6.5.4.3.1. Key market trends, growth factors and opportunities
- 6.5.4.3.2. Market size and forecast, by Type
- 6.5.4.3.3. Market size and forecast, by Age group
- 6.5.4.4. Rest of LAMEA
- 6.5.4.4.1. Key market trends, growth factors and opportunities
- 6.5.4.4.2. Market size and forecast, by Type
- 6.5.4.4.3. Market size and forecast, by Age group
CHAPTER 7: COMPETITIVE LANDSCAPE
- 7.1. Introduction
- 7.2. Top winning strategies
- 7.3. Product Mapping of Top 10 Player
- 7.4. Competitive Dashboard
- 7.5. Competitive Heatmap
- 7.6. Top player positioning, 2022
CHAPTER 8: COMPANY PROFILES
- 8.1. Abbott Laboratories
- 8.1.1. Company overview
- 8.1.2. Key Executives
- 8.1.3. Company snapshot
- 8.1.4. Operating business segments
- 8.1.5. Product portfolio
- 8.1.6. Business performance
- 8.2. Qaigen NV
- 8.2.1. Company overview
- 8.2.2. Key Executives
- 8.2.3. Company snapshot
- 8.2.4. Operating business segments
- 8.2.5. Product portfolio
- 8.2.6. Business performance
- 8.3. Carl Zeiss AG
- 8.3.1. Company overview
- 8.3.2. Key Executives
- 8.3.3. Company snapshot
- 8.3.4. Operating business segments
- 8.3.5. Product portfolio
- 8.3.6. Business performance
- 8.4. Thermo Fisher Scientific Inc.
- 8.4.1. Company overview
- 8.4.2. Key Executives
- 8.4.3. Company snapshot
- 8.4.4. Operating business segments
- 8.4.5. Product portfolio
- 8.4.6. Business performance
- 8.5. Becton, Dickinson and Company
- 8.5.1. Company overview
- 8.5.2. Key Executives
- 8.5.3. Company snapshot
- 8.5.4. Operating business segments
- 8.5.5. Product portfolio
- 8.5.6. Business performance
- 8.5.7. Key strategic moves and developments
- 8.6. Hologic Inc.
- 8.6.1. Company overview
- 8.6.2. Key Executives
- 8.6.3. Company snapshot
- 8.6.4. Operating business segments
- 8.6.5. Product portfolio
- 8.6.6. Business performance
- 8.6.7. Key strategic moves and developments
- 8.7. F. Hoffmann-La Roche AG
- 8.7.1. Company overview
- 8.7.2. Key Executives
- 8.7.3. Company snapshot
- 8.7.4. Operating business segments
- 8.7.5. Product portfolio
- 8.7.6. Business performance
- 8.7.7. Key strategic moves and developments
- 8.8. CooperSurgical Inc.
- 8.8.1. Company overview
- 8.8.2. Key Executives
- 8.8.3. Company snapshot
- 8.8.4. Operating business segments
- 8.8.5. Product portfolio
- 8.8.6. Business performance
- 8.9. Siemens Healthineers
- 8.9.1. Company overview
- 8.9.2. Key Executives
- 8.9.3. Company snapshot
- 8.9.4. Operating business segments
- 8.9.5. Product portfolio
- 8.9.6. Business performance
- 8.10. Dysis Medical ltd.
- 8.10.1. Company overview
- 8.10.2. Key Executives
- 8.10.3. Company snapshot
- 8.10.4. Operating business segments
- 8.10.5. Product portfolio
- 8.10.6. Key strategic moves and developments
LIST OF TABLES
- TABLE 01. GLOBAL CERVICAL CANCER DIAGNOSTIC MARKET, BY TYPE, 2022-2032 ($MILLION)
- TABLE 02. CERVICAL CANCER DIAGNOSTIC MARKET FOR PAP SMEAR TESTS, BY REGION, 2022-2032 ($MILLION)
- TABLE 03. CERVICAL CANCER DIAGNOSTIC MARKET FOR HPV TEST, BY REGION, 2022-2032 ($MILLION)
- TABLE 04. CERVICAL CANCER DIAGNOSTIC MARKET FOR BIOPSY AND ECC, BY REGION, 2022-2032 ($MILLION)
- TABLE 05. CERVICAL CANCER DIAGNOSTIC MARKET FOR COLPOSCOPY TESTS, BY REGION, 2022-2032 ($MILLION)
- TABLE 06. CERVICAL CANCER DIAGNOSTIC MARKET FOR OTHERS, BY REGION, 2022-2032 ($MILLION)
- TABLE 07. GLOBAL CERVICAL CANCER DIAGNOSTIC MARKET, BY AGE GROUP, 2022-2032 ($MILLION)
- TABLE 08. CERVICAL CANCER DIAGNOSTIC MARKET FOR 20 TO 40 YEARS, BY REGION, 2022-2032 ($MILLION)
- TABLE 09. CERVICAL CANCER DIAGNOSTIC MARKET FOR ABOVE 40 YEARS, BY REGION, 2022-2032 ($MILLION)
- TABLE 10. CERVICAL CANCER DIAGNOSTIC MARKET, BY REGION, 2022-2032 ($MILLION)
- TABLE 11. NORTH AMERICA CERVICAL CANCER DIAGNOSTIC MARKET, BY TYPE, 2022-2032 ($MILLION)
- TABLE 12. NORTH AMERICA CERVICAL CANCER DIAGNOSTIC MARKET, BY AGE GROUP, 2022-2032 ($MILLION)
- TABLE 13. NORTH AMERICA CERVICAL CANCER DIAGNOSTIC MARKET, BY COUNTRY, 2022-2032 ($MILLION)
- TABLE 14. U.S. CERVICAL CANCER DIAGNOSTIC MARKET, BY TYPE, 2022-2032 ($MILLION)
- TABLE 15. U.S. CERVICAL CANCER DIAGNOSTIC MARKET, BY AGE GROUP, 2022-2032 ($MILLION)
- TABLE 16. CANADA CERVICAL CANCER DIAGNOSTIC MARKET, BY TYPE, 2022-2032 ($MILLION)
- TABLE 17. CANADA CERVICAL CANCER DIAGNOSTIC MARKET, BY AGE GROUP, 2022-2032 ($MILLION)
- TABLE 18. MEXICO CERVICAL CANCER DIAGNOSTIC MARKET, BY TYPE, 2022-2032 ($MILLION)
- TABLE 19. MEXICO CERVICAL CANCER DIAGNOSTIC MARKET, BY AGE GROUP, 2022-2032 ($MILLION)
- TABLE 20. EUROPE CERVICAL CANCER DIAGNOSTIC MARKET, BY TYPE, 2022-2032 ($MILLION)
- TABLE 21. EUROPE CERVICAL CANCER DIAGNOSTIC MARKET, BY AGE GROUP, 2022-2032 ($MILLION)
- TABLE 22. EUROPE CERVICAL CANCER DIAGNOSTIC MARKET, BY COUNTRY, 2022-2032 ($MILLION)
- TABLE 23. GERMANY CERVICAL CANCER DIAGNOSTIC MARKET, BY TYPE, 2022-2032 ($MILLION)
- TABLE 24. GERMANY CERVICAL CANCER DIAGNOSTIC MARKET, BY AGE GROUP, 2022-2032 ($MILLION)
- TABLE 25. FRANCE CERVICAL CANCER DIAGNOSTIC MARKET, BY TYPE, 2022-2032 ($MILLION)
- TABLE 26. FRANCE CERVICAL CANCER DIAGNOSTIC MARKET, BY AGE GROUP, 2022-2032 ($MILLION)
- TABLE 27. UK CERVICAL CANCER DIAGNOSTIC MARKET, BY TYPE, 2022-2032 ($MILLION)
- TABLE 28. UK CERVICAL CANCER DIAGNOSTIC MARKET, BY AGE GROUP, 2022-2032 ($MILLION)
- TABLE 29. ITALY CERVICAL CANCER DIAGNOSTIC MARKET, BY TYPE, 2022-2032 ($MILLION)
- TABLE 30. ITALY CERVICAL CANCER DIAGNOSTIC MARKET, BY AGE GROUP, 2022-2032 ($MILLION)
- TABLE 31. SPAIN CERVICAL CANCER DIAGNOSTIC MARKET, BY TYPE, 2022-2032 ($MILLION)
- TABLE 32. SPAIN CERVICAL CANCER DIAGNOSTIC MARKET, BY AGE GROUP, 2022-2032 ($MILLION)
- TABLE 33. REST OF EUROPE CERVICAL CANCER DIAGNOSTIC MARKET, BY TYPE, 2022-2032 ($MILLION)
- TABLE 34. REST OF EUROPE CERVICAL CANCER DIAGNOSTIC MARKET, BY AGE GROUP, 2022-2032 ($MILLION)
- TABLE 35. ASIA-PACIFIC CERVICAL CANCER DIAGNOSTIC MARKET, BY TYPE, 2022-2032 ($MILLION)
- TABLE 36. ASIA-PACIFIC CERVICAL CANCER DIAGNOSTIC MARKET, BY AGE GROUP, 2022-2032 ($MILLION)
- TABLE 37. ASIA-PACIFIC CERVICAL CANCER DIAGNOSTIC MARKET, BY COUNTRY, 2022-2032 ($MILLION)
- TABLE 38. CHINA CERVICAL CANCER DIAGNOSTIC MARKET, BY TYPE, 2022-2032 ($MILLION)
- TABLE 39. CHINA CERVICAL CANCER DIAGNOSTIC MARKET, BY AGE GROUP, 2022-2032 ($MILLION)
- TABLE 40. JAPAN CERVICAL CANCER DIAGNOSTIC MARKET, BY TYPE, 2022-2032 ($MILLION)
- TABLE 41. JAPAN CERVICAL CANCER DIAGNOSTIC MARKET, BY AGE GROUP, 2022-2032 ($MILLION)
- TABLE 42. INDIA CERVICAL CANCER DIAGNOSTIC MARKET, BY TYPE, 2022-2032 ($MILLION)
- TABLE 43. INDIA CERVICAL CANCER DIAGNOSTIC MARKET, BY AGE GROUP, 2022-2032 ($MILLION)
- TABLE 44. AUSTRALIA CERVICAL CANCER DIAGNOSTIC MARKET, BY TYPE, 2022-2032 ($MILLION)
- TABLE 45. AUSTRALIA CERVICAL CANCER DIAGNOSTIC MARKET, BY AGE GROUP, 2022-2032 ($MILLION)
- TABLE 46. SOUTH KOREA CERVICAL CANCER DIAGNOSTIC MARKET, BY TYPE, 2022-2032 ($MILLION)
- TABLE 47. SOUTH KOREA CERVICAL CANCER DIAGNOSTIC MARKET, BY AGE GROUP, 2022-2032 ($MILLION)
- TABLE 48. REST OF ASIA-PACIFIC CERVICAL CANCER DIAGNOSTIC MARKET, BY TYPE, 2022-2032 ($MILLION)
- TABLE 49. REST OF ASIA-PACIFIC CERVICAL CANCER DIAGNOSTIC MARKET, BY AGE GROUP, 2022-2032 ($MILLION)
- TABLE 50. LAMEA CERVICAL CANCER DIAGNOSTIC MARKET, BY TYPE, 2022-2032 ($MILLION)
- TABLE 51. LAMEA CERVICAL CANCER DIAGNOSTIC MARKET, BY AGE GROUP, 2022-2032 ($MILLION)
- TABLE 52. LAMEA CERVICAL CANCER DIAGNOSTIC MARKET, BY COUNTRY, 2022-2032 ($MILLION)
- TABLE 53. BRAZIL CERVICAL CANCER DIAGNOSTIC MARKET, BY TYPE, 2022-2032 ($MILLION)
- TABLE 54. BRAZIL CERVICAL CANCER DIAGNOSTIC MARKET, BY AGE GROUP, 2022-2032 ($MILLION)
- TABLE 55. SAUDI ARABIA CERVICAL CANCER DIAGNOSTIC MARKET, BY TYPE, 2022-2032 ($MILLION)
- TABLE 56. SAUDI ARABIA CERVICAL CANCER DIAGNOSTIC MARKET, BY AGE GROUP, 2022-2032 ($MILLION)
- TABLE 57. SOUTH AFRICA CERVICAL CANCER DIAGNOSTIC MARKET, BY TYPE, 2022-2032 ($MILLION)
- TABLE 58. SOUTH AFRICA CERVICAL CANCER DIAGNOSTIC MARKET, BY AGE GROUP, 2022-2032 ($MILLION)
- TABLE 59. REST OF LAMEA CERVICAL CANCER DIAGNOSTIC MARKET, BY TYPE, 2022-2032 ($MILLION)
- TABLE 60. REST OF LAMEA CERVICAL CANCER DIAGNOSTIC MARKET, BY AGE GROUP, 2022-2032 ($MILLION)
- TABLE 61. ABBOTT LABORATORIES: KEY EXECUTIVES
- TABLE 62. ABBOTT LABORATORIES: COMPANY SNAPSHOT
- TABLE 63. ABBOTT LABORATORIES: PRODUCT SEGMENTS
- TABLE 64. ABBOTT LABORATORIES: PRODUCT PORTFOLIO
- TABLE 65. QAIGEN NV: KEY EXECUTIVES
- TABLE 66. QAIGEN NV: COMPANY SNAPSHOT
- TABLE 67. QAIGEN NV: PRODUCT SEGMENTS
- TABLE 68. QAIGEN NV: PRODUCT PORTFOLIO
- TABLE 69. CARL ZEISS AG: KEY EXECUTIVES
- TABLE 70. CARL ZEISS AG: COMPANY SNAPSHOT
- TABLE 71. CARL ZEISS AG: PRODUCT SEGMENTS
- TABLE 72. CARL ZEISS AG: PRODUCT PORTFOLIO
- TABLE 73. THERMO FISHER SCIENTIFIC INC.: KEY EXECUTIVES
- TABLE 74. THERMO FISHER SCIENTIFIC INC.: COMPANY SNAPSHOT
- TABLE 75. THERMO FISHER SCIENTIFIC INC.: PRODUCT SEGMENTS
- TABLE 76. THERMO FISHER SCIENTIFIC INC.: PRODUCT PORTFOLIO
- TABLE 77. BECTON, DICKINSON AND COMPANY: KEY EXECUTIVES
- TABLE 78. BECTON, DICKINSON AND COMPANY: COMPANY SNAPSHOT
- TABLE 79. BECTON, DICKINSON AND COMPANY: PRODUCT SEGMENTS
- TABLE 80. BECTON, DICKINSON AND COMPANY: PRODUCT PORTFOLIO
- TABLE 81. BECTON, DICKINSON AND COMPANY: KEY STRATERGIES
- TABLE 82. HOLOGIC INC.: KEY EXECUTIVES
- TABLE 83. HOLOGIC INC.: COMPANY SNAPSHOT
- TABLE 84. HOLOGIC INC.: PRODUCT SEGMENTS
- TABLE 85. HOLOGIC INC.: PRODUCT PORTFOLIO
- TABLE 86. HOLOGIC INC.: KEY STRATERGIES
- TABLE 87. F. HOFFMANN-LA ROCHE AG: KEY EXECUTIVES
- TABLE 88. F. HOFFMANN-LA ROCHE AG: COMPANY SNAPSHOT
- TABLE 89. F. HOFFMANN-LA ROCHE AG: PRODUCT SEGMENTS
- TABLE 90. F. HOFFMANN-LA ROCHE AG: PRODUCT PORTFOLIO
- TABLE 91. F. HOFFMANN-LA ROCHE AG: KEY STRATERGIES
- TABLE 92. COOPERSURGICAL INC.: KEY EXECUTIVES
- TABLE 93. COOPERSURGICAL INC.: COMPANY SNAPSHOT
- TABLE 94. COOPERSURGICAL INC.: PRODUCT SEGMENTS
- TABLE 95. COOPERSURGICAL INC.: PRODUCT PORTFOLIO
- TABLE 96. SIEMENS HEALTHINEERS: KEY EXECUTIVES
- TABLE 97. SIEMENS HEALTHINEERS: COMPANY SNAPSHOT
- TABLE 98. SIEMENS HEALTHINEERS: PRODUCT SEGMENTS
- TABLE 99. SIEMENS HEALTHINEERS: PRODUCT PORTFOLIO
- TABLE 100. DYSIS MEDICAL LTD.: KEY EXECUTIVES
- TABLE 101. DYSIS MEDICAL LTD.: COMPANY SNAPSHOT
- TABLE 102. DYSIS MEDICAL LTD.: PRODUCT SEGMENTS
- TABLE 103. DYSIS MEDICAL LTD.: PRODUCT PORTFOLIO
- TABLE 104. DYSIS MEDICAL LTD.: KEY STRATERGIES
LIST OF FIGURES
- FIGURE 01. CERVICAL CANCER DIAGNOSTIC MARKET, 2022-2032
- FIGURE 02. SEGMENTATION OF CERVICAL CANCER DIAGNOSTIC MARKET, 2022-2032
- FIGURE 03. TOP INVESTMENT POCKETS IN CERVICAL CANCER DIAGNOSTIC MARKET (2023-2032)
- FIGURE 04. MODERATE BARGAINING POWER OF SUPPLIERS
- FIGURE 05. MODERATE BARGAINING POWER OF BUYERS
- FIGURE 06. MODERATE THREAT OF SUBSTITUTES
- FIGURE 07. MODERATE THREAT OF NEW ENTRANTS
- FIGURE 08. MODERATE INTENSITY OF RIVALRY
- FIGURE 09. DRIVERS, RESTRAINTS AND OPPORTUNITIES: GLOBALCERVICAL CANCER DIAGNOSTIC MARKET
- FIGURE 10. CERVICAL CANCER DIAGNOSTIC MARKET, BY TYPE, 2022(%)
- FIGURE 11. COMPARATIVE SHARE ANALYSIS OF CERVICAL CANCER DIAGNOSTIC MARKET FOR PAP SMEAR TESTS, BY COUNTRY 2022 AND 2032(%)
- FIGURE 12. COMPARATIVE SHARE ANALYSIS OF CERVICAL CANCER DIAGNOSTIC MARKET FOR HPV TEST, BY COUNTRY 2022 AND 2032(%)
- FIGURE 13. COMPARATIVE SHARE ANALYSIS OF CERVICAL CANCER DIAGNOSTIC MARKET FOR BIOPSY AND ECC, BY COUNTRY 2022 AND 2032(%)
- FIGURE 14. COMPARATIVE SHARE ANALYSIS OF CERVICAL CANCER DIAGNOSTIC MARKET FOR COLPOSCOPY TESTS, BY COUNTRY 2022 AND 2032(%)
- FIGURE 15. COMPARATIVE SHARE ANALYSIS OF CERVICAL CANCER DIAGNOSTIC MARKET FOR OTHERS, BY COUNTRY 2022 AND 2032(%)
- FIGURE 16. CERVICAL CANCER DIAGNOSTIC MARKET, BY AGE GROUP, 2022(%)
- FIGURE 17. COMPARATIVE SHARE ANALYSIS OF CERVICAL CANCER DIAGNOSTIC MARKET FOR 20 TO 40 YEARS, BY COUNTRY 2022 AND 2032(%)
- FIGURE 18. COMPARATIVE SHARE ANALYSIS OF CERVICAL CANCER DIAGNOSTIC MARKET FOR ABOVE 40 YEARS, BY COUNTRY 2022 AND 2032(%)
- FIGURE 19. CERVICAL CANCER DIAGNOSTIC MARKET BY REGION, 2022
- FIGURE 20. U.S. CERVICAL CANCER DIAGNOSTIC MARKET, 2022-2032 ($MILLION)
- FIGURE 21. CANADA CERVICAL CANCER DIAGNOSTIC MARKET, 2022-2032 ($MILLION)
- FIGURE 22. MEXICO CERVICAL CANCER DIAGNOSTIC MARKET, 2022-2032 ($MILLION)
- FIGURE 23. GERMANY CERVICAL CANCER DIAGNOSTIC MARKET, 2022-2032 ($MILLION)
- FIGURE 24. FRANCE CERVICAL CANCER DIAGNOSTIC MARKET, 2022-2032 ($MILLION)
- FIGURE 25. UK CERVICAL CANCER DIAGNOSTIC MARKET, 2022-2032 ($MILLION)
- FIGURE 26. ITALY CERVICAL CANCER DIAGNOSTIC MARKET, 2022-2032 ($MILLION)
- FIGURE 27. SPAIN CERVICAL CANCER DIAGNOSTIC MARKET, 2022-2032 ($MILLION)
- FIGURE 28. REST OF EUROPE CERVICAL CANCER DIAGNOSTIC MARKET, 2022-2032 ($MILLION)
- FIGURE 29. CHINA CERVICAL CANCER DIAGNOSTIC MARKET, 2022-2032 ($MILLION)
- FIGURE 30. JAPAN CERVICAL CANCER DIAGNOSTIC MARKET, 2022-2032 ($MILLION)
- FIGURE 31. INDIA CERVICAL CANCER DIAGNOSTIC MARKET, 2022-2032 ($MILLION)
- FIGURE 32. AUSTRALIA CERVICAL CANCER DIAGNOSTIC MARKET, 2022-2032 ($MILLION)
- FIGURE 33. SOUTH KOREA CERVICAL CANCER DIAGNOSTIC MARKET, 2022-2032 ($MILLION)
- FIGURE 34. REST OF ASIA-PACIFIC CERVICAL CANCER DIAGNOSTIC MARKET, 2022-2032 ($MILLION)
- FIGURE 35. BRAZIL CERVICAL CANCER DIAGNOSTIC MARKET, 2022-2032 ($MILLION)
- FIGURE 36. SAUDI ARABIA CERVICAL CANCER DIAGNOSTIC MARKET, 2022-2032 ($MILLION)
- FIGURE 37. SOUTH AFRICA CERVICAL CANCER DIAGNOSTIC MARKET, 2022-2032 ($MILLION)
- FIGURE 38. REST OF LAMEA CERVICAL CANCER DIAGNOSTIC MARKET, 2022-2032 ($MILLION)
- FIGURE 39. TOP WINNING STRATEGIES, BY YEAR
- FIGURE 40. TOP WINNING STRATEGIES, BY DEVELOPMENT
- FIGURE 41. TOP WINNING STRATEGIES, BY COMPANY
- FIGURE 42. PRODUCT MAPPING OF TOP 10 PLAYERS
- FIGURE 43. COMPETITIVE DASHBOARD
- FIGURE 44. COMPETITIVE HEATMAP: CERVICAL CANCER DIAGNOSTIC MARKET
- FIGURE 45. TOP PLAYER POSITIONING, 2022
- FIGURE 46. ABBOTT LABORATORIES: NET SALES, 2020-2022 ($MILLION)
- FIGURE 47. ABBOTT LABORATORIES: RESEARCH & DEVELOPMENT EXPENDITURE, 2020-2022 ($MILLION)
- FIGURE 48. ABBOTT LABORATORIES: REVENUE SHARE BY SEGMENT, 2021 (%)
- FIGURE 49. ABBOTT LABORATORIES: REVENUE SHARE BY REGION, 2021 (%)
- FIGURE 50. QAIGEN NV: NET REVENUE, 2019-2021 ($MILLION)
- FIGURE 51. QAIGEN NV: REVENUE SHARE BY SEGMENT, 2021 (%)
- FIGURE 52. QAIGEN NV: REVENUE SHARE BY REGION, 2021 (%)
- FIGURE 53. CARL ZEISS AG: NET REVENUE, 2020-2022 ($MILLION)
- FIGURE 54. CARL ZEISS AG: REVENUE SHARE BY SEGMENT, 2022 (%)
- FIGURE 55. CARL ZEISS AG: REVENUE SHARE BY REGION, 2022 (%)
- FIGURE 56. THERMO FISHER SCIENTIFIC INC.: NET REVENUE, 2019-2021 ($MILLION)
- FIGURE 57. THERMO FISHER SCIENTIFIC INC.: REVENUE SHARE BY SEGMENT, 2021 (%)
- FIGURE 58. THERMO FISHER SCIENTIFIC INC.: REVENUE SHARE BY REGION, 2021 (%)
- FIGURE 59. BECTON, DICKINSON AND COMPANY: NET REVENUE, 2020-2022 ($MILLION)
- FIGURE 60. BECTON, DICKINSON AND COMPANY: REVENUE SHARE BY SEGMENT, 2022 (%)
- FIGURE 61. BECTON, DICKINSON AND COMPANY: REVENUE SHARE BY REGION, 2022 (%)
- FIGURE 62. HOLOGIC INC.: NET REVENUE, 2020-2022 ($MILLION)
- FIGURE 63. HOLOGIC INC.: REVENUE SHARE BY SEGMENT, 2022 (%)
- FIGURE 64. HOLOGIC INC.: REVENUE SHARE BY REGION, 2022 (%)
- FIGURE 65. F. HOFFMANN-LA ROCHE AG: NET REVENUE, 2019-2021 ($MILLION)
- FIGURE 66. F. HOFFMANN-LA ROCHE AG: REVENUE SHARE BY SEGMENT, 2021 (%)
- FIGURE 67. COOPERSURGICAL INC.: NET SALES, 2020-2022 ($MILLION)
- FIGURE 68. COOPERSURGICAL INC.: REVENUE SHARE BY SEGMENT, 2022 (%)
- FIGURE 69. COOPERSURGICAL INC.: REVENUE SHARE BY REGION, 2022 (%)
- FIGURE 70. SIEMENS HEALTHINEERS: NET REVENUE, 2019-2021 ($MILLION)
- FIGURE 71. SIEMENS HEALTHINEERS: REVENUE SHARE BY SEGMENT, 2021 (%)
- FIGURE 72. SIEMENS HEALTHINEERS: REVENUE SHARE BY REGION, 2021 (%)
 子宫颈癌诊断市场:按类型、最终用户划分 - 全球预测 2025-2030
 2024-2032 年按测试类型(巴氏检测、HPV 检测、子宫颈活检、阴道镜检查等)、年龄层(20 至 35 岁、35 岁以上)和地区分類的子宫颈癌诊断市场报告
 子宫颈癌诊断市场规模 - 按诊断测试、年龄层和最终用户 - 区域前景、竞争策略和细分市场预测(~2033 年)
 子宫颈癌诊断市场规模 - 按诊断方法、年龄层、最终用途和预测,2024-2032 年
 全球子宫颈癌诊断市场研究报告 - 2024 年至 2032 年产业分析、规模、份额、成长、趋势与预测
 子宫颈癌诊断市场 - 2018-2028 年全球产业规模、份额、趋势、机会和预测,按测试类型、最终用户、地区和竞争细分
 2024 年子宫颈癌诊断全球市场报告
 子宫颈癌诊断市场规模、份额、趋势分析报告:按测试类型、年龄组、最终用途、地区和细分市场预测,2023-2030 年
 全球宫颈癌诊断市场 - 2023-2030年
 子宫颈癌诊断的全球市场规模和份额、按类型分类的行业趋势分析报告(、年龄组、区域前景和预测、2023-2029