


 |
市场调查报告书
商品编码
1298367
马来酸氯苯那敏市场:按配方、按应用(过敏、花粉热、感冒、流泪、喉咙/皮肤瘙痒、过敏性休克、荨麻疹)、按分销渠道:2023年-2032年全球机会分析和行业预测Chlorpheniramine Maleate Market By Dosage Form, By Application (Allergy, Hay Fever, Common Cold, Watery Eyes, Itchy Throat/Skin, Anaphylactic Shock, Urticaria), By Distribution Channel : Global Opportunity Analysis and Industry Forecast, 2023-2032 |
||||||
2022 年马来酸氯苯那敏市场规模为 4.686 亿美元,2023 年至 2032 年復合年增长率为 4.9%,预计 2032 年将达到 7.514 亿美元。
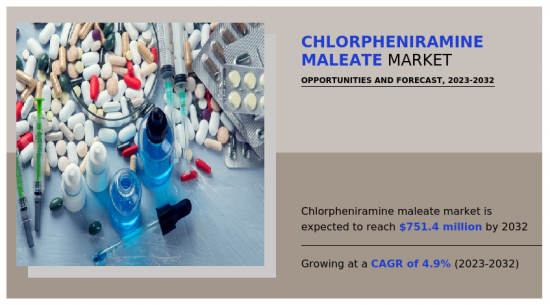
扑尔敏是一种抗组胺药,用于缓解过敏、花粉热和普通感冒的症状。 这些症状包括皮疹、流泪、眼睛/鼻子/喉咙/皮肤发痒、咳嗽、流鼻涕和打喷嚏。 这种药物的作用是阻断过敏反应过程中身体产生的某种天然物质(组胺)。 通过阻断体内产生的另一种天然物质(乙□胆碱),它可以使体液干燥并缓解流泪和流鼻涕等症状。
推动马来酸氯苯那敏市场增长的主要因素是过敏和呼吸道疾病(例如过敏性鼻炎和荨麻疹)患病率的上升。 例如,根据美国哮喘与过敏基金会 2021 年的一份报告,美国约有 8100 万人被诊断患有季节性过敏性鼻炎(花粉症)。 这相当于约 26% 的成年人(6700 万)和约 19% 的儿童(1400 万)。 此外,製药技术和给药系统的进步导致马来酸氯苯那敏新剂型的开发,例如缓释片剂和液体剂型,其功效、便利性和患者依从性得到改善,导致预测市场预计将增长期间。
然而,消费者偏好的变化,例如转向自然疗法和整体治疗方法、对其他类型药物的偏好,以及马来酸扑尔敏症状(例如嗜睡、口干、视力模糊和尿潴留等潜在副作用)阻碍了市场增长。 相反,用于开发副作用更少、疗效更高的新型疗法的研发活动激增,预计将为预测期内的市场增长提供利润丰厚的机会。
内容
第一章简介
第 2 章执行摘要
第三章市场概述
- 市场定义和范围
- 主要发现
- 影响因素
- 主要投资领域
- 波特五力分析
- 供应商的议价能力
- 买家的议价能力
- 替代品的威胁
- 新进入者的威胁
- 竞争强度
- 市场动态
- 协调员
- 城市化进程和生活方式的变化
- 过敏性疾病增加
- 技术进步突飞猛进
- 阻碍因素
- 马来酸氯苯那敏可能产生副作用
- 更多地转向替代药物
- 机会
- 新兴经济体的高增长潜力
- 协调员
- COVID-19 对市场的影响分析
第 4 章马来酸氯苯那敏市场:按配方
- 概述
- 市场规模和预测
- 药丸
- 主要市场趋势、增长动力和机遇
- 市场规模和预测:按地区划分
- 市场份额分析:按国家/地区划分
- 糖浆
- 主要市场趋势、增长因素和机遇
- 市场规模和预测:按地区划分
- 市场份额分析:按国家/地区划分
- 眼药水
- 主要市场趋势、增长因素和机遇
- 市场规模和预测:按地区划分
- 市场份额分析:按国家/地区划分
第 5 章马来酸氯苯那敏市场:按应用分类
- 概述
- 市场规模和预测
- 过敏
- 主要市场趋势、增长动力和机遇
- 市场规模和预测:按地区划分
- 市场份额分析:按国家/地区划分
- 花粉热(过敏性鼻炎)
- 主要市场趋势、增长因素和机遇
- 市场规模和预测:按地区划分
- 市场份额分析:按国家/地区划分
- 冷
- 主要市场趋势、增长因素和机遇
- 市场规模和预测:按地区划分
- 市场份额分析:按国家/地区划分
- 泪眼汪汪
- 主要市场趋势、增长因素和机遇
- 市场规模和预测:按地区划分
- 市场份额分析:按国家/地区划分
- 喉咙/皮肤发痒
- 主要市场趋势、增长因素和机遇
- 市场规模和预测:按地区划分
- 市场份额分析:按国家/地区划分
- 过敏性休克
- 主要市场趋势、增长因素和机遇
- 市场规模和预测:按地区划分
- 市场份额分析:按国家/地区划分
- 荨麻疹
- 主要市场趋势、增长因素和机遇
- 市场规模和预测:按地区划分
- 市场份额分析:按国家/地区划分
第 6 章马来酸氯苯那敏市场:按分销渠道划分
- 概述
- 市场规模和预测
- 医院药房
- 主要市场趋势、增长动力和机遇
- 市场规模和预测:按地区划分
- 市场份额分析:按国家/地区划分
- 零售药店
- 主要市场趋势、增长因素和机遇
- 市场规模和预测:按地区划分
- 市场份额分析:按国家/地区划分
- 网上药店
- 主要市场趋势、增长因素和机遇
- 市场规模和预测:按地区划分
- 市场份额分析:按国家/地区划分
第 7 章马来酸氯苯那敏市场:按地区
- 概述
- 市场规模和预测:按地区划分
- 北美
- 主要趋势和机遇
- 市场规模和预测:按剂型划分
- 市场规模和预测:按应用分类
- 市场规模和预测:按分销渠道划分
- 市场规模/预测:按国家/地区划分
- 美国
- 主要市场趋势、增长动力和机遇
- 市场规模和预测:按剂型划分
- 市场规模和预测:按应用分类
- 市场规模和预测:按分销渠道划分
- 加拿大
- 主要市场趋势、增长动力和机遇
- 市场规模和预测:按剂型划分
- 市场规模和预测:按应用分类
- 市场规模和预测:按分销渠道划分
- 墨西哥
- 主要市场趋势、增长动力和机遇
- 市场规模和预测:按剂型划分
- 市场规模和预测:按应用分类
- 市场规模和预测:按分销渠道划分
- 欧洲
- 主要趋势和机遇
- 市场规模和预测:按剂型划分
- 市场规模和预测:按应用分类
- 市场规模和预测:按分销渠道划分
- 市场规模/预测:按国家/地区划分
- 德国
- 主要市场趋势、增长动力和机遇
- 市场规模和预测:按剂型划分
- 市场规模和预测:按应用分类
- 市场规模和预测:按分销渠道划分
- 法国
- 主要市场趋势、增长动力和机遇
- 市场规模和预测:按剂型划分
- 市场规模和预测:按应用分类
- 市场规模和预测:按分销渠道划分
- 英国
- 主要市场趋势、增长动力和机遇
- 市场规模和预测:按剂型划分
- 市场规模和预测:按应用分类
- 市场规模和预测:按分销渠道划分
- 意大利
- 主要市场趋势、增长动力和机遇
- 市场规模和预测:按剂型划分
- 市场规模和预测:按应用分类
- 市场规模和预测:按分销渠道划分
- 西班牙
- 主要市场趋势、增长动力和机遇
- 市场规模和预测:按剂型划分
- 市场规模和预测:按应用分类
- 市场规模和预测:按分销渠道划分
- 欧洲其他地区
- 主要市场趋势、增长动力和机遇
- 市场规模和预测:按剂型划分
- 市场规模和预测:按应用分类
- 市场规模和预测:按分销渠道划分
- 亚太地区
- 主要趋势和机遇
- 市场规模和预测:按剂型划分
- 市场规模和预测:按应用分类
- 市场规模和预测:按分销渠道划分
- 市场规模/预测:按国家/地区划分
- 日本
- 主要市场趋势、增长动力和机遇
- 市场规模和预测:按剂型划分
- 市场规模和预测:按应用分类
- 市场规模和预测:按分销渠道划分
- 中国
- 主要市场趋势、增长动力和机遇
- 市场规模和预测:按剂型划分
- 市场规模和预测:按应用分类
- 市场规模和预测:按分销渠道划分
- 澳大利亚
- 主要市场趋势、增长动力和机遇
- 市场规模和预测:按剂型划分
- 市场规模和预测:按应用分类
- 市场规模和预测:按分销渠道划分
- 印度
- 主要市场趋势、增长动力和机遇
- 市场规模和预测:按剂型划分
- 市场规模和预测:按应用分类
- 市场规模和预测:按分销渠道划分
- 韩国
- 主要市场趋势、增长动力和机遇
- 市场规模和预测:按剂型划分
- 市场规模和预测:按应用分类
- 市场规模和预测:按分销渠道划分
- 亚太地区其他地区
- 主要市场趋势、增长动力和机遇
- 市场规模和预测:按剂型划分
- 市场规模和预测:按应用分类
- 市场规模和预测:按分销渠道划分
- 拉丁美洲/中东/非洲
- 主要趋势和机遇
- 市场规模和预测:按剂型划分
- 市场规模和预测:按应用分类
- 市场规模和预测:按分销渠道划分
- 市场规模/预测:按国家/地区划分
- 巴西
- 主要市场趋势、增长动力和机遇
- 市场规模和预测:按剂型划分
- 市场规模和预测:按应用分类
- 市场规模和预测:按分销渠道划分
- 沙特阿拉伯
- 主要市场趋势、增长动力和机遇
- 市场规模和预测:按剂型划分
- 市场规模和预测:按应用分类
- 市场规模和预测:按分销渠道划分
- 南非
- 主要市场趋势、增长动力和机遇
- 市场规模和预测:按剂型划分
- 市场规模和预测:按应用分类
- 市场规模和预测:按分销渠道划分
- 其他地区
- 主要市场趋势、增长动力和机遇
- 市场规模和预测:按剂型划分
- 市场规模和预测:按应用分类
- 市场规模和预测:按分销渠道划分
第 8 章竞争格局
- 简介
- 关键成功策略
- 10家主要公司的产品图谱
- 竞赛仪表板
- 比赛热图
- 2022 年关键人物定位
第 9 章公司简介
- GlaxoSmithKline plc
- Bayer AG
- Merck & Co., Inc.
- Johnson & Johnson
- Alkem Laboratories Ltd.
- Viatris Inc.
- Zydus Lifesciences Limited
- Sun Pharmaceutical Industries Limited
- Novalab Healthcare Pvt. Ltd.
- Capellon Pharmaceuticals
The chlorpheniramine maleate market size was valued at $468.6 million in 2022, and is projected to reach $751.4 million by 2032, growing at a CAGR of 4.9% from 2023 to 2032.
Chlorpheniramine is an antihistamine used to relieve symptoms of allergy, hay fever, and the common cold. These symptoms include rashes, watery eyes, itchy eyes/nose/throat/skin, cough, runny nose, and sneezing. This medication works by blocking a certain natural substance (histamine) that the body makes during an allergic reaction. By blocking another natural substance made by the body (acetylcholine), it helps dry up some body fluids to relieve symptoms such as watery eyes and runny nose.
The key factor that drives the growth of the chlorpheniramine maleate market is the rise in prevalence of allergies and related respiratory conditions such as allergic rhinitis, and hives. For instance, according to report published by Asthma & Allergy Foundation of America in 2021, approximately 81 million people in the U.S. were diagnosed with seasonal allergic rhinitis (hay fever). This equals around 26% (67 million) of adults and 19% (14 million) of children. Furthermore, advances in pharmaceutical technology and drug delivery systems have resulted in the development of new formulations of chlorpheniramine maleate, such as extended-release tablets or liquid formulations, which offer improved efficacy, convenience, and patient compliance that are expected to drive the growth of the market during the forecast period.
However, changes in consumer preferences, such as a shift towards natural remedies, holistic approaches, or preferences for other types of medications, and potential adverse effects of chlorpheniramine maleate, such as drowsiness, dry mouth, blurred vision, and urinary retention hamper market growth. Conversely, a surge in R&D activities for the development of novel therapies with fewer side effects and greater efficacy is expected to provide lucrative opportunities for the growth of the market during the forecast period.
The chlorpheniramine maleate market is segmented into dosage form, application, end user, and region. By dosage form, the market is classified into tablets, syrup, and eye drops. On the basis of application, it is fragmented into allergy, hay fever (allergic rhinitis), common cold, watery eyes, itchy throat/skin, anaphylactic shock, and urticaria. By distribution channel, the market is categorized into hospital pharmacies, retail pharmacies, and online pharmacies. Region-wise, the market is analyzed across North America, Europe, Asia-Pacific, and LAMEA.
North America garnered the maximum share of the chlorpheniramine maleate market in 2022 and is anticipated to remain dominant during the forecast period. This is attributed to an increase in prevalence of allergic conditions, a growth in geriatric population as adults may have a higher risk of developing allergies and high healthcare expenditure on drugs used to treat allergic conditions such as hay fever, the common cold, anaphylactic shock, and others. Furthermore, a surge in awareness among the population about the symptoms and management of allergies and advancements in healthcare infrastructure are expected to fuel the market growth.
Asia-Pacific is expected to register the fastest CAGR during the forecast period owing to an increase in incidence of allergic conditions and a surge in population and urbanization. Furthermore, growth in healthcare infrastructure and surge in R&D activities by key market players for the development of new drugs to treat allergic disorders such as allergic rhinitis, urticaria, and hay fever boost the growth of the market.
The key players that operate in the chlorpheniramine maleate market are: Alkeem Laboratories Ltd., Bayer AG, GlaxoSmithKline plc, Johnson & Johnson, Merck & Co., Inc., Novalab Healthcare Pvt. Ltd., Capellon Pharmaceuticals, Sun Pharmaceutical Industries Limited, Viatris Inc., and Zydus Lifesciences Limited.
Key Benefits For Stakeholders
- This report provides a quantitative analysis of the market segments, current trends, estimations, and dynamics of the chlorpheniramine maleate market analysis from 2022 to 2032 to identify the prevailing chlorpheniramine maleate market opportunities.
- The market research is offered along with information related to key drivers, restraints, and opportunities.
- Porter's five forces analysis highlights the potency of buyers and suppliers to enable stakeholders make profit-oriented business decisions and strengthen their supplier-buyer network.
- In-depth analysis of the chlorpheniramine maleate market segmentation assists to determine the prevailing market opportunities.
- Major countries in each region are mapped according to their revenue contribution to the global market.
- Market player positioning facilitates benchmarking and provides a clear understanding of the present position of the market players.
- The report includes the analysis of the regional as well as global chlorpheniramine maleate market trends, key players, market segments, application areas, and market growth strategies.
Key Market Segments
By Dosage Form
- Syrup
- Eye Drops
- Tablets
By Application
- Allergy
- Hay Fever (Allergic Rhinitis)
- Common Cold
- Watery Eyes
- Itchy Throat/Skin
- Anaphylactic Shock
- Urticaria
By Distribution Channel
- Hospital Pharmacies
- Retail Pharmacies
- Online Pharmacies
By Region
- North America
- U.S.
- Canada
- Mexico
- Europe
- Germany
- France
- UK
- Italy
- Spain
- Rest of Europe
- Asia-Pacific
- Japan
- China
- Australia
- India
- South Korea
- Rest of Asia-Pacific
- LAMEA
- Brazil
- Saudi Arabia
- South Africa
- Rest of LAMEA
Key Market Players:
- Alkem Laboratories Ltd.
- Bayer AG
- Capellon Pharmaceuticals
- GlaxoSmithKline plc
- Johnson & Johnson
- Merck & Co., Inc.
- Novalab Healthcare Pvt. Ltd.
- Sun Pharmaceutical Industries Limited
- Viatris Inc.
- Zydus Lifesciences Limited
TABLE OF CONTENTS
CHAPTER 1: INTRODUCTION
- 1.1. Report description
- 1.2. Key market segments
- 1.3. Key benefits to the stakeholders
- 1.4. Research Methodology
- 1.4.1. Primary research
- 1.4.2. Secondary research
- 1.4.3. Analyst tools and models
CHAPTER 2: EXECUTIVE SUMMARY
- 2.1. CXO Perspective
CHAPTER 3: MARKET OVERVIEW
- 3.1. Market definition and scope
- 3.2. Key findings
- 3.2.1. Top impacting factors
- 3.2.2. Top investment pockets
- 3.3. Porter's five forces analysis
- 3.3.1. Bargaining power of suppliers
- 3.3.2. Bargaining power of buyers
- 3.3.3. Threat of substitutes
- 3.3.4. Threat of new entrants
- 3.3.5. Intensity of rivalry
- 3.4. Market dynamics
- 3.4.1. Drivers
- 3.4.1.1. Increase in urbanization and change in lifestyles
- 3.4.1.2. Increase in the prevalence of allergic conditions
- 3.4.1.3. Surge in technological advancement
- 3.4.1. Drivers
- 3.4.2. Restraints
- 3.4.2.1. Potential side effects of chlorpheniramine maleate
- 3.4.2.2. Increase in shift towards alternative medicines
- 3.4.3. Opportunities
- 3.4.3.1. High growth potential in developing economies
- 3.5. COVID-19 Impact Analysis on the market
CHAPTER 4: CHLORPHENIRAMINE MALEATE MARKET, BY DOSAGE FORM
- 4.1. Overview
- 4.1.1. Market size and forecast
- 4.2. Tablets
- 4.2.1. Key market trends, growth factors and opportunities
- 4.2.2. Market size and forecast, by region
- 4.2.3. Market share analysis by country
- 4.3. Syrup
- 4.3.1. Key market trends, growth factors and opportunities
- 4.3.2. Market size and forecast, by region
- 4.3.3. Market share analysis by country
- 4.4. Eye Drops
- 4.4.1. Key market trends, growth factors and opportunities
- 4.4.2. Market size and forecast, by region
- 4.4.3. Market share analysis by country
CHAPTER 5: CHLORPHENIRAMINE MALEATE MARKET, BY APPLICATION
- 5.1. Overview
- 5.1.1. Market size and forecast
- 5.2. Allergy
- 5.2.1. Key market trends, growth factors and opportunities
- 5.2.2. Market size and forecast, by region
- 5.2.3. Market share analysis by country
- 5.3. Hay Fever (Allergic Rhinitis)
- 5.3.1. Key market trends, growth factors and opportunities
- 5.3.2. Market size and forecast, by region
- 5.3.3. Market share analysis by country
- 5.4. Common Cold
- 5.4.1. Key market trends, growth factors and opportunities
- 5.4.2. Market size and forecast, by region
- 5.4.3. Market share analysis by country
- 5.5. Watery Eyes
- 5.5.1. Key market trends, growth factors and opportunities
- 5.5.2. Market size and forecast, by region
- 5.5.3. Market share analysis by country
- 5.6. Itchy Throat/Skin
- 5.6.1. Key market trends, growth factors and opportunities
- 5.6.2. Market size and forecast, by region
- 5.6.3. Market share analysis by country
- 5.7. Anaphylactic Shock
- 5.7.1. Key market trends, growth factors and opportunities
- 5.7.2. Market size and forecast, by region
- 5.7.3. Market share analysis by country
- 5.8. Urticaria
- 5.8.1. Key market trends, growth factors and opportunities
- 5.8.2. Market size and forecast, by region
- 5.8.3. Market share analysis by country
CHAPTER 6: CHLORPHENIRAMINE MALEATE MARKET, BY DISTRIBUTION CHANNEL
- 6.1. Overview
- 6.1.1. Market size and forecast
- 6.2. Hospital Pharmacies
- 6.2.1. Key market trends, growth factors and opportunities
- 6.2.2. Market size and forecast, by region
- 6.2.3. Market share analysis by country
- 6.3. Retail Pharmacies
- 6.3.1. Key market trends, growth factors and opportunities
- 6.3.2. Market size and forecast, by region
- 6.3.3. Market share analysis by country
- 6.4. Online Pharmacies
- 6.4.1. Key market trends, growth factors and opportunities
- 6.4.2. Market size and forecast, by region
- 6.4.3. Market share analysis by country
CHAPTER 7: CHLORPHENIRAMINE MALEATE MARKET, BY REGION
- 7.1. Overview
- 7.1.1. Market size and forecast By Region
- 7.2. North America
- 7.2.1. Key trends and opportunities
- 7.2.2. Market size and forecast, by Dosage Form
- 7.2.3. Market size and forecast, by Application
- 7.2.4. Market size and forecast, by Distribution Channel
- 7.2.5. Market size and forecast, by country
- 7.2.5.1. U.S.
- 7.2.5.1.1. Key market trends, growth factors and opportunities
- 7.2.5.1.2. Market size and forecast, by Dosage Form
- 7.2.5.1.3. Market size and forecast, by Application
- 7.2.5.1.4. Market size and forecast, by Distribution Channel
- 7.2.5.2. Canada
- 7.2.5.2.1. Key market trends, growth factors and opportunities
- 7.2.5.2.2. Market size and forecast, by Dosage Form
- 7.2.5.2.3. Market size and forecast, by Application
- 7.2.5.2.4. Market size and forecast, by Distribution Channel
- 7.2.5.3. Mexico
- 7.2.5.3.1. Key market trends, growth factors and opportunities
- 7.2.5.3.2. Market size and forecast, by Dosage Form
- 7.2.5.3.3. Market size and forecast, by Application
- 7.2.5.3.4. Market size and forecast, by Distribution Channel
- 7.3. Europe
- 7.3.1. Key trends and opportunities
- 7.3.2. Market size and forecast, by Dosage Form
- 7.3.3. Market size and forecast, by Application
- 7.3.4. Market size and forecast, by Distribution Channel
- 7.3.5. Market size and forecast, by country
- 7.3.5.1. Germany
- 7.3.5.1.1. Key market trends, growth factors and opportunities
- 7.3.5.1.2. Market size and forecast, by Dosage Form
- 7.3.5.1.3. Market size and forecast, by Application
- 7.3.5.1.4. Market size and forecast, by Distribution Channel
- 7.3.5.2. France
- 7.3.5.2.1. Key market trends, growth factors and opportunities
- 7.3.5.2.2. Market size and forecast, by Dosage Form
- 7.3.5.2.3. Market size and forecast, by Application
- 7.3.5.2.4. Market size and forecast, by Distribution Channel
- 7.3.5.3. UK
- 7.3.5.3.1. Key market trends, growth factors and opportunities
- 7.3.5.3.2. Market size and forecast, by Dosage Form
- 7.3.5.3.3. Market size and forecast, by Application
- 7.3.5.3.4. Market size and forecast, by Distribution Channel
- 7.3.5.4. Italy
- 7.3.5.4.1. Key market trends, growth factors and opportunities
- 7.3.5.4.2. Market size and forecast, by Dosage Form
- 7.3.5.4.3. Market size and forecast, by Application
- 7.3.5.4.4. Market size and forecast, by Distribution Channel
- 7.3.5.5. Spain
- 7.3.5.5.1. Key market trends, growth factors and opportunities
- 7.3.5.5.2. Market size and forecast, by Dosage Form
- 7.3.5.5.3. Market size and forecast, by Application
- 7.3.5.5.4. Market size and forecast, by Distribution Channel
- 7.3.5.6. Rest of Europe
- 7.3.5.6.1. Key market trends, growth factors and opportunities
- 7.3.5.6.2. Market size and forecast, by Dosage Form
- 7.3.5.6.3. Market size and forecast, by Application
- 7.3.5.6.4. Market size and forecast, by Distribution Channel
- 7.4. Asia-Pacific
- 7.4.1. Key trends and opportunities
- 7.4.2. Market size and forecast, by Dosage Form
- 7.4.3. Market size and forecast, by Application
- 7.4.4. Market size and forecast, by Distribution Channel
- 7.4.5. Market size and forecast, by country
- 7.4.5.1. Japan
- 7.4.5.1.1. Key market trends, growth factors and opportunities
- 7.4.5.1.2. Market size and forecast, by Dosage Form
- 7.4.5.1.3. Market size and forecast, by Application
- 7.4.5.1.4. Market size and forecast, by Distribution Channel
- 7.4.5.2. China
- 7.4.5.2.1. Key market trends, growth factors and opportunities
- 7.4.5.2.2. Market size and forecast, by Dosage Form
- 7.4.5.2.3. Market size and forecast, by Application
- 7.4.5.2.4. Market size and forecast, by Distribution Channel
- 7.4.5.3. Australia
- 7.4.5.3.1. Key market trends, growth factors and opportunities
- 7.4.5.3.2. Market size and forecast, by Dosage Form
- 7.4.5.3.3. Market size and forecast, by Application
- 7.4.5.3.4. Market size and forecast, by Distribution Channel
- 7.4.5.4. India
- 7.4.5.4.1. Key market trends, growth factors and opportunities
- 7.4.5.4.2. Market size and forecast, by Dosage Form
- 7.4.5.4.3. Market size and forecast, by Application
- 7.4.5.4.4. Market size and forecast, by Distribution Channel
- 7.4.5.5. South Korea
- 7.4.5.5.1. Key market trends, growth factors and opportunities
- 7.4.5.5.2. Market size and forecast, by Dosage Form
- 7.4.5.5.3. Market size and forecast, by Application
- 7.4.5.5.4. Market size and forecast, by Distribution Channel
- 7.4.5.6. Rest of Asia-Pacific
- 7.4.5.6.1. Key market trends, growth factors and opportunities
- 7.4.5.6.2. Market size and forecast, by Dosage Form
- 7.4.5.6.3. Market size and forecast, by Application
- 7.4.5.6.4. Market size and forecast, by Distribution Channel
- 7.5. LAMEA
- 7.5.1. Key trends and opportunities
- 7.5.2. Market size and forecast, by Dosage Form
- 7.5.3. Market size and forecast, by Application
- 7.5.4. Market size and forecast, by Distribution Channel
- 7.5.5. Market size and forecast, by country
- 7.5.5.1. Brazil
- 7.5.5.1.1. Key market trends, growth factors and opportunities
- 7.5.5.1.2. Market size and forecast, by Dosage Form
- 7.5.5.1.3. Market size and forecast, by Application
- 7.5.5.1.4. Market size and forecast, by Distribution Channel
- 7.5.5.2. Saudi Arabia
- 7.5.5.2.1. Key market trends, growth factors and opportunities
- 7.5.5.2.2. Market size and forecast, by Dosage Form
- 7.5.5.2.3. Market size and forecast, by Application
- 7.5.5.2.4. Market size and forecast, by Distribution Channel
- 7.5.5.3. South Africa
- 7.5.5.3.1. Key market trends, growth factors and opportunities
- 7.5.5.3.2. Market size and forecast, by Dosage Form
- 7.5.5.3.3. Market size and forecast, by Application
- 7.5.5.3.4. Market size and forecast, by Distribution Channel
- 7.5.5.4. Rest of LAMEA
- 7.5.5.4.1. Key market trends, growth factors and opportunities
- 7.5.5.4.2. Market size and forecast, by Dosage Form
- 7.5.5.4.3. Market size and forecast, by Application
- 7.5.5.4.4. Market size and forecast, by Distribution Channel
CHAPTER 8: COMPETITIVE LANDSCAPE
- 8.1. Introduction
- 8.2. Top winning strategies
- 8.3. Product Mapping of Top 10 Player
- 8.4. Competitive Dashboard
- 8.5. Competitive Heatmap
- 8.6. Top player positioning, 2022
CHAPTER 9: COMPANY PROFILES
- 9.1. GlaxoSmithKline plc
- 9.1.1. Company overview
- 9.1.2. Key Executives
- 9.1.3. Company snapshot
- 9.1.4. Operating business segments
- 9.1.5. Product portfolio
- 9.1.6. Business performance
- 9.2. Bayer AG
- 9.2.1. Company overview
- 9.2.2. Key Executives
- 9.2.3. Company snapshot
- 9.2.4. Operating business segments
- 9.2.5. Product portfolio
- 9.2.6. Business performance
- 9.3. Merck & Co., Inc.
- 9.3.1. Company overview
- 9.3.2. Key Executives
- 9.3.3. Company snapshot
- 9.3.4. Operating business segments
- 9.3.5. Product portfolio
- 9.3.6. Business performance
- 9.4. Johnson & Johnson
- 9.4.1. Company overview
- 9.4.2. Key Executives
- 9.4.3. Company snapshot
- 9.4.4. Operating business segments
- 9.4.5. Product portfolio
- 9.4.6. Business performance
- 9.5. Alkem Laboratories Ltd.
- 9.5.1. Company overview
- 9.5.2. Key Executives
- 9.5.3. Company snapshot
- 9.5.4. Operating business segments
- 9.5.5. Product portfolio
- 9.5.6. Business performance
- 9.6. Viatris Inc.
- 9.6.1. Company overview
- 9.6.2. Key Executives
- 9.6.3. Company snapshot
- 9.6.4. Operating business segments
- 9.6.5. Product portfolio
- 9.6.6. Business performance
- 9.7. Zydus Lifesciences Limited
- 9.7.1. Company overview
- 9.7.2. Key Executives
- 9.7.3. Company snapshot
- 9.7.4. Operating business segments
- 9.7.5. Product portfolio
- 9.7.6. Business performance
- 9.8. Sun Pharmaceutical Industries Limited
- 9.8.1. Company overview
- 9.8.2. Key Executives
- 9.8.3. Company snapshot
- 9.8.4. Operating business segments
- 9.8.5. Product portfolio
- 9.8.6. Business performance
- 9.8.7. Key strategic moves and developments
- 9.9. Novalab Healthcare Pvt. Ltd.
- 9.9.1. Company overview
- 9.9.2. Key Executives
- 9.9.3. Company snapshot
- 9.9.4. Operating business segments
- 9.9.5. Product portfolio
- 9.10. Capellon Pharmaceuticals
- 9.10.1. Company overview
- 9.10.2. Key Executives
- 9.10.3. Company snapshot
- 9.10.4. Operating business segments
- 9.10.5. Product portfolio
LIST OF TABLES
- TABLE 01. GLOBAL CHLORPHENIRAMINE MALEATE MARKET, BY DOSAGE FORM, 2022-2032 ($MILLION)
- TABLE 02. CHLORPHENIRAMINE MALEATE MARKET FOR TABLETS, BY REGION, 2022-2032 ($MILLION)
- TABLE 03. CHLORPHENIRAMINE MALEATE MARKET FOR SYRUP, BY REGION, 2022-2032 ($MILLION)
- TABLE 04. CHLORPHENIRAMINE MALEATE MARKET FOR EYE DROPS, BY REGION, 2022-2032 ($MILLION)
- TABLE 05. GLOBAL CHLORPHENIRAMINE MALEATE MARKET, BY APPLICATION, 2022-2032 ($MILLION)
- TABLE 06. CHLORPHENIRAMINE MALEATE MARKET FOR ALLERGY, BY REGION, 2022-2032 ($MILLION)
- TABLE 07. CHLORPHENIRAMINE MALEATE MARKET FOR HAY FEVER (ALLERGIC RHINITIS), BY REGION, 2022-2032 ($MILLION)
- TABLE 08. CHLORPHENIRAMINE MALEATE MARKET FOR COMMON COLD, BY REGION, 2022-2032 ($MILLION)
- TABLE 09. CHLORPHENIRAMINE MALEATE MARKET FOR WATERY EYES, BY REGION, 2022-2032 ($MILLION)
- TABLE 10. CHLORPHENIRAMINE MALEATE MARKET FOR ITCHY THROAT/SKIN, BY REGION, 2022-2032 ($MILLION)
- TABLE 11. CHLORPHENIRAMINE MALEATE MARKET FOR ANAPHYLACTIC SHOCK, BY REGION, 2022-2032 ($MILLION)
- TABLE 12. CHLORPHENIRAMINE MALEATE MARKET FOR URTICARIA, BY REGION, 2022-2032 ($MILLION)
- TABLE 13. GLOBAL CHLORPHENIRAMINE MALEATE MARKET, BY DISTRIBUTION CHANNEL, 2022-2032 ($MILLION)
- TABLE 14. CHLORPHENIRAMINE MALEATE MARKET FOR HOSPITAL PHARMACIES, BY REGION, 2022-2032 ($MILLION)
- TABLE 15. CHLORPHENIRAMINE MALEATE MARKET FOR RETAIL PHARMACIES, BY REGION, 2022-2032 ($MILLION)
- TABLE 16. CHLORPHENIRAMINE MALEATE MARKET FOR ONLINE PHARMACIES, BY REGION, 2022-2032 ($MILLION)
- TABLE 17. CHLORPHENIRAMINE MALEATE MARKET, BY REGION, 2022-2032 ($MILLION)
- TABLE 18. NORTH AMERICA CHLORPHENIRAMINE MALEATE MARKET, BY DOSAGE FORM, 2022-2032 ($MILLION)
- TABLE 19. NORTH AMERICA CHLORPHENIRAMINE MALEATE MARKET, BY APPLICATION, 2022-2032 ($MILLION)
- TABLE 20. NORTH AMERICA CHLORPHENIRAMINE MALEATE MARKET, BY DISTRIBUTION CHANNEL, 2022-2032 ($MILLION)
- TABLE 21. NORTH AMERICA CHLORPHENIRAMINE MALEATE MARKET, BY COUNTRY, 2022-2032 ($MILLION)
- TABLE 22. U.S. CHLORPHENIRAMINE MALEATE MARKET, BY DOSAGE FORM, 2022-2032 ($MILLION)
- TABLE 23. U.S. CHLORPHENIRAMINE MALEATE MARKET, BY APPLICATION, 2022-2032 ($MILLION)
- TABLE 24. U.S. CHLORPHENIRAMINE MALEATE MARKET, BY DISTRIBUTION CHANNEL, 2022-2032 ($MILLION)
- TABLE 25. CANADA CHLORPHENIRAMINE MALEATE MARKET, BY DOSAGE FORM, 2022-2032 ($MILLION)
- TABLE 26. CANADA CHLORPHENIRAMINE MALEATE MARKET, BY APPLICATION, 2022-2032 ($MILLION)
- TABLE 27. CANADA CHLORPHENIRAMINE MALEATE MARKET, BY DISTRIBUTION CHANNEL, 2022-2032 ($MILLION)
- TABLE 28. MEXICO CHLORPHENIRAMINE MALEATE MARKET, BY DOSAGE FORM, 2022-2032 ($MILLION)
- TABLE 29. MEXICO CHLORPHENIRAMINE MALEATE MARKET, BY APPLICATION, 2022-2032 ($MILLION)
- TABLE 30. MEXICO CHLORPHENIRAMINE MALEATE MARKET, BY DISTRIBUTION CHANNEL, 2022-2032 ($MILLION)
- TABLE 31. EUROPE CHLORPHENIRAMINE MALEATE MARKET, BY DOSAGE FORM, 2022-2032 ($MILLION)
- TABLE 32. EUROPE CHLORPHENIRAMINE MALEATE MARKET, BY APPLICATION, 2022-2032 ($MILLION)
- TABLE 33. EUROPE CHLORPHENIRAMINE MALEATE MARKET, BY DISTRIBUTION CHANNEL, 2022-2032 ($MILLION)
- TABLE 34. EUROPE CHLORPHENIRAMINE MALEATE MARKET, BY COUNTRY, 2022-2032 ($MILLION)
- TABLE 35. GERMANY CHLORPHENIRAMINE MALEATE MARKET, BY DOSAGE FORM, 2022-2032 ($MILLION)
- TABLE 36. GERMANY CHLORPHENIRAMINE MALEATE MARKET, BY APPLICATION, 2022-2032 ($MILLION)
- TABLE 37. GERMANY CHLORPHENIRAMINE MALEATE MARKET, BY DISTRIBUTION CHANNEL, 2022-2032 ($MILLION)
- TABLE 38. FRANCE CHLORPHENIRAMINE MALEATE MARKET, BY DOSAGE FORM, 2022-2032 ($MILLION)
- TABLE 39. FRANCE CHLORPHENIRAMINE MALEATE MARKET, BY APPLICATION, 2022-2032 ($MILLION)
- TABLE 40. FRANCE CHLORPHENIRAMINE MALEATE MARKET, BY DISTRIBUTION CHANNEL, 2022-2032 ($MILLION)
- TABLE 41. UK CHLORPHENIRAMINE MALEATE MARKET, BY DOSAGE FORM, 2022-2032 ($MILLION)
- TABLE 42. UK CHLORPHENIRAMINE MALEATE MARKET, BY APPLICATION, 2022-2032 ($MILLION)
- TABLE 43. UK CHLORPHENIRAMINE MALEATE MARKET, BY DISTRIBUTION CHANNEL, 2022-2032 ($MILLION)
- TABLE 44. ITALY CHLORPHENIRAMINE MALEATE MARKET, BY DOSAGE FORM, 2022-2032 ($MILLION)
- TABLE 45. ITALY CHLORPHENIRAMINE MALEATE MARKET, BY APPLICATION, 2022-2032 ($MILLION)
- TABLE 46. ITALY CHLORPHENIRAMINE MALEATE MARKET, BY DISTRIBUTION CHANNEL, 2022-2032 ($MILLION)
- TABLE 47. SPAIN CHLORPHENIRAMINE MALEATE MARKET, BY DOSAGE FORM, 2022-2032 ($MILLION)
- TABLE 48. SPAIN CHLORPHENIRAMINE MALEATE MARKET, BY APPLICATION, 2022-2032 ($MILLION)
- TABLE 49. SPAIN CHLORPHENIRAMINE MALEATE MARKET, BY DISTRIBUTION CHANNEL, 2022-2032 ($MILLION)
- TABLE 50. REST OF EUROPE CHLORPHENIRAMINE MALEATE MARKET, BY DOSAGE FORM, 2022-2032 ($MILLION)
- TABLE 51. REST OF EUROPE CHLORPHENIRAMINE MALEATE MARKET, BY APPLICATION, 2022-2032 ($MILLION)
- TABLE 52. REST OF EUROPE CHLORPHENIRAMINE MALEATE MARKET, BY DISTRIBUTION CHANNEL, 2022-2032 ($MILLION)
- TABLE 53. ASIA-PACIFIC CHLORPHENIRAMINE MALEATE MARKET, BY DOSAGE FORM, 2022-2032 ($MILLION)
- TABLE 54. ASIA-PACIFIC CHLORPHENIRAMINE MALEATE MARKET, BY APPLICATION, 2022-2032 ($MILLION)
- TABLE 55. ASIA-PACIFIC CHLORPHENIRAMINE MALEATE MARKET, BY DISTRIBUTION CHANNEL, 2022-2032 ($MILLION)
- TABLE 56. ASIA-PACIFIC CHLORPHENIRAMINE MALEATE MARKET, BY COUNTRY, 2022-2032 ($MILLION)
- TABLE 57. JAPAN CHLORPHENIRAMINE MALEATE MARKET, BY DOSAGE FORM, 2022-2032 ($MILLION)
- TABLE 58. JAPAN CHLORPHENIRAMINE MALEATE MARKET, BY APPLICATION, 2022-2032 ($MILLION)
- TABLE 59. JAPAN CHLORPHENIRAMINE MALEATE MARKET, BY DISTRIBUTION CHANNEL, 2022-2032 ($MILLION)
- TABLE 60. CHINA CHLORPHENIRAMINE MALEATE MARKET, BY DOSAGE FORM, 2022-2032 ($MILLION)
- TABLE 61. CHINA CHLORPHENIRAMINE MALEATE MARKET, BY APPLICATION, 2022-2032 ($MILLION)
- TABLE 62. CHINA CHLORPHENIRAMINE MALEATE MARKET, BY DISTRIBUTION CHANNEL, 2022-2032 ($MILLION)
- TABLE 63. AUSTRALIA CHLORPHENIRAMINE MALEATE MARKET, BY DOSAGE FORM, 2022-2032 ($MILLION)
- TABLE 64. AUSTRALIA CHLORPHENIRAMINE MALEATE MARKET, BY APPLICATION, 2022-2032 ($MILLION)
- TABLE 65. AUSTRALIA CHLORPHENIRAMINE MALEATE MARKET, BY DISTRIBUTION CHANNEL, 2022-2032 ($MILLION)
- TABLE 66. INDIA CHLORPHENIRAMINE MALEATE MARKET, BY DOSAGE FORM, 2022-2032 ($MILLION)
- TABLE 67. INDIA CHLORPHENIRAMINE MALEATE MARKET, BY APPLICATION, 2022-2032 ($MILLION)
- TABLE 68. INDIA CHLORPHENIRAMINE MALEATE MARKET, BY DISTRIBUTION CHANNEL, 2022-2032 ($MILLION)
- TABLE 69. SOUTH KOREA CHLORPHENIRAMINE MALEATE MARKET, BY DOSAGE FORM, 2022-2032 ($MILLION)
- TABLE 70. SOUTH KOREA CHLORPHENIRAMINE MALEATE MARKET, BY APPLICATION, 2022-2032 ($MILLION)
- TABLE 71. SOUTH KOREA CHLORPHENIRAMINE MALEATE MARKET, BY DISTRIBUTION CHANNEL, 2022-2032 ($MILLION)
- TABLE 72. REST OF ASIA-PACIFIC CHLORPHENIRAMINE MALEATE MARKET, BY DOSAGE FORM, 2022-2032 ($MILLION)
- TABLE 73. REST OF ASIA-PACIFIC CHLORPHENIRAMINE MALEATE MARKET, BY APPLICATION, 2022-2032 ($MILLION)
- TABLE 74. REST OF ASIA-PACIFIC CHLORPHENIRAMINE MALEATE MARKET, BY DISTRIBUTION CHANNEL, 2022-2032 ($MILLION)
- TABLE 75. LAMEA CHLORPHENIRAMINE MALEATE MARKET, BY DOSAGE FORM, 2022-2032 ($MILLION)
- TABLE 76. LAMEA CHLORPHENIRAMINE MALEATE MARKET, BY APPLICATION, 2022-2032 ($MILLION)
- TABLE 77. LAMEA CHLORPHENIRAMINE MALEATE MARKET, BY DISTRIBUTION CHANNEL, 2022-2032 ($MILLION)
- TABLE 78. LAMEA CHLORPHENIRAMINE MALEATE MARKET, BY COUNTRY, 2022-2032 ($MILLION)
- TABLE 79. BRAZIL CHLORPHENIRAMINE MALEATE MARKET, BY DOSAGE FORM, 2022-2032 ($MILLION)
- TABLE 80. BRAZIL CHLORPHENIRAMINE MALEATE MARKET, BY APPLICATION, 2022-2032 ($MILLION)
- TABLE 81. BRAZIL CHLORPHENIRAMINE MALEATE MARKET, BY DISTRIBUTION CHANNEL, 2022-2032 ($MILLION)
- TABLE 82. SAUDI ARABIA CHLORPHENIRAMINE MALEATE MARKET, BY DOSAGE FORM, 2022-2032 ($MILLION)
- TABLE 83. SAUDI ARABIA CHLORPHENIRAMINE MALEATE MARKET, BY APPLICATION, 2022-2032 ($MILLION)
- TABLE 84. SAUDI ARABIA CHLORPHENIRAMINE MALEATE MARKET, BY DISTRIBUTION CHANNEL, 2022-2032 ($MILLION)
- TABLE 85. SOUTH AFRICA CHLORPHENIRAMINE MALEATE MARKET, BY DOSAGE FORM, 2022-2032 ($MILLION)
- TABLE 86. SOUTH AFRICA CHLORPHENIRAMINE MALEATE MARKET, BY APPLICATION, 2022-2032 ($MILLION)
- TABLE 87. SOUTH AFRICA CHLORPHENIRAMINE MALEATE MARKET, BY DISTRIBUTION CHANNEL, 2022-2032 ($MILLION)
- TABLE 88. REST OF LAMEA CHLORPHENIRAMINE MALEATE MARKET, BY DOSAGE FORM, 2022-2032 ($MILLION)
- TABLE 89. REST OF LAMEA CHLORPHENIRAMINE MALEATE MARKET, BY APPLICATION, 2022-2032 ($MILLION)
- TABLE 90. REST OF LAMEA CHLORPHENIRAMINE MALEATE MARKET, BY DISTRIBUTION CHANNEL, 2022-2032 ($MILLION)
- TABLE 91. GLAXOSMITHKLINE PLC: KEY EXECUTIVES
- TABLE 92. GLAXOSMITHKLINE PLC: COMPANY SNAPSHOT
- TABLE 93. GLAXOSMITHKLINE PLC: PRODUCT SEGMENTS
- TABLE 94. GLAXOSMITHKLINE PLC: PRODUCT PORTFOLIO
- TABLE 95. BAYER AG: KEY EXECUTIVES
- TABLE 96. BAYER AG: COMPANY SNAPSHOT
- TABLE 97. BAYER AG: PRODUCT SEGMENTS
- TABLE 98. BAYER AG: PRODUCT PORTFOLIO
- TABLE 99. MERCK & CO., INC.: KEY EXECUTIVES
- TABLE 100. MERCK & CO., INC.: COMPANY SNAPSHOT
- TABLE 101. MERCK & CO., INC.: PRODUCT SEGMENTS
- TABLE 102. MERCK & CO., INC.: PRODUCT PORTFOLIO
- TABLE 103. JOHNSON & JOHNSON: KEY EXECUTIVES
- TABLE 104. JOHNSON & JOHNSON: COMPANY SNAPSHOT
- TABLE 105. JOHNSON & JOHNSON: PRODUCT SEGMENTS
- TABLE 106. JOHNSON & JOHNSON: PRODUCT PORTFOLIO
- TABLE 107. ALKEM LABORATORIES LTD.: KEY EXECUTIVES
- TABLE 108. ALKEM LABORATORIES LTD.: COMPANY SNAPSHOT
- TABLE 109. ALKEM LABORATORIES LTD.: PRODUCT SEGMENTS
- TABLE 110. ALKEM LABORATORIES LTD.: PRODUCT PORTFOLIO
- TABLE 111. VIATRIS INC.: KEY EXECUTIVES
- TABLE 112. VIATRIS INC.: COMPANY SNAPSHOT
- TABLE 113. VIATRIS INC.: PRODUCT SEGMENTS
- TABLE 114. VIATRIS INC.: PRODUCT PORTFOLIO
- TABLE 115. ZYDUS LIFESCIENCES LIMITED: KEY EXECUTIVES
- TABLE 116. ZYDUS LIFESCIENCES LIMITED: COMPANY SNAPSHOT
- TABLE 117. ZYDUS LIFESCIENCES LIMITED: PRODUCT SEGMENTS
- TABLE 118. ZYDUS LIFESCIENCES LIMITED: PRODUCT PORTFOLIO
- TABLE 119. SUN PHARMACEUTICAL INDUSTRIES LIMITED: KEY EXECUTIVES
- TABLE 120. SUN PHARMACEUTICAL INDUSTRIES LIMITED: COMPANY SNAPSHOT
- TABLE 121. SUN PHARMACEUTICAL INDUSTRIES LIMITED: PRODUCT SEGMENTS
- TABLE 122. SUN PHARMACEUTICAL INDUSTRIES LIMITED: PRODUCT PORTFOLIO
- TABLE 123. SUN PHARMACEUTICAL INDUSTRIES LIMITED: KEY STRATERGIES
- TABLE 124. NOVALAB HEALTHCARE PVT. LTD.: KEY EXECUTIVES
- TABLE 125. NOVALAB HEALTHCARE PVT. LTD.: COMPANY SNAPSHOT
- TABLE 126. NOVALAB HEALTHCARE PVT. LTD.: PRODUCT SEGMENTS
- TABLE 127. NOVALAB HEALTHCARE PVT. LTD.: PRODUCT PORTFOLIO
- TABLE 128. CAPELLON PHARMACEUTICALS: KEY EXECUTIVES
- TABLE 129. CAPELLON PHARMACEUTICALS: COMPANY SNAPSHOT
- TABLE 130. CAPELLON PHARMACEUTICALS: PRODUCT SEGMENTS
- TABLE 131. CAPELLON PHARMACEUTICALS: PRODUCT PORTFOLIO
LIST OF FIGURES
- FIGURE 01. CHLORPHENIRAMINE MALEATE MARKET, 2022-2032
- FIGURE 02. SEGMENTATION OF CHLORPHENIRAMINE MALEATE MARKET, 2022-2032
- FIGURE 03. TOP INVESTMENT POCKETS IN CHLORPHENIRAMINE MALEATE MARKET (2023-2032)
- FIGURE 04. LOW BARGAINING POWER OF SUPPLIERS
- FIGURE 05. LOW BARGAINING POWER OF BUYERS
- FIGURE 06. LOW THREAT OF SUBSTITUTES
- FIGURE 07. LOW THREAT OF NEW ENTRANTS
- FIGURE 08. LOW INTENSITY OF RIVALRY
- FIGURE 09. DRIVERS, RESTRAINTS AND OPPORTUNITIES: GLOBALCHLORPHENIRAMINE MALEATE MARKET
- FIGURE 10. CHLORPHENIRAMINE MALEATE MARKET, BY DOSAGE FORM, 2022(%)
- FIGURE 11. COMPARATIVE SHARE ANALYSIS OF CHLORPHENIRAMINE MALEATE MARKET FOR TABLETS, BY COUNTRY 2022 AND 2032(%)
- FIGURE 12. COMPARATIVE SHARE ANALYSIS OF CHLORPHENIRAMINE MALEATE MARKET FOR SYRUP, BY COUNTRY 2022 AND 2032(%)
- FIGURE 13. COMPARATIVE SHARE ANALYSIS OF CHLORPHENIRAMINE MALEATE MARKET FOR EYE DROPS, BY COUNTRY 2022 AND 2032(%)
- FIGURE 14. CHLORPHENIRAMINE MALEATE MARKET, BY APPLICATION, 2022(%)
- FIGURE 15. COMPARATIVE SHARE ANALYSIS OF CHLORPHENIRAMINE MALEATE MARKET FOR ALLERGY, BY COUNTRY 2022 AND 2032(%)
- FIGURE 16. COMPARATIVE SHARE ANALYSIS OF CHLORPHENIRAMINE MALEATE MARKET FOR HAY FEVER (ALLERGIC RHINITIS), BY COUNTRY 2022 AND 2032(%)
- FIGURE 17. COMPARATIVE SHARE ANALYSIS OF CHLORPHENIRAMINE MALEATE MARKET FOR COMMON COLD, BY COUNTRY 2022 AND 2032(%)
- FIGURE 18. COMPARATIVE SHARE ANALYSIS OF CHLORPHENIRAMINE MALEATE MARKET FOR WATERY EYES, BY COUNTRY 2022 AND 2032(%)
- FIGURE 19. COMPARATIVE SHARE ANALYSIS OF CHLORPHENIRAMINE MALEATE MARKET FOR ITCHY THROAT/SKIN, BY COUNTRY 2022 AND 2032(%)
- FIGURE 20. COMPARATIVE SHARE ANALYSIS OF CHLORPHENIRAMINE MALEATE MARKET FOR ANAPHYLACTIC SHOCK, BY COUNTRY 2022 AND 2032(%)
- FIGURE 21. COMPARATIVE SHARE ANALYSIS OF CHLORPHENIRAMINE MALEATE MARKET FOR URTICARIA, BY COUNTRY 2022 AND 2032(%)
- FIGURE 22. CHLORPHENIRAMINE MALEATE MARKET, BY DISTRIBUTION CHANNEL, 2022(%)
- FIGURE 23. COMPARATIVE SHARE ANALYSIS OF CHLORPHENIRAMINE MALEATE MARKET FOR HOSPITAL PHARMACIES, BY COUNTRY 2022 AND 2032(%)
- FIGURE 24. COMPARATIVE SHARE ANALYSIS OF CHLORPHENIRAMINE MALEATE MARKET FOR RETAIL PHARMACIES, BY COUNTRY 2022 AND 2032(%)
- FIGURE 25. COMPARATIVE SHARE ANALYSIS OF CHLORPHENIRAMINE MALEATE MARKET FOR ONLINE PHARMACIES, BY COUNTRY 2022 AND 2032(%)
- FIGURE 26. CHLORPHENIRAMINE MALEATE MARKET BY REGION, 2022
- FIGURE 27. U.S. CHLORPHENIRAMINE MALEATE MARKET, 2022-2032 ($MILLION)
- FIGURE 28. CANADA CHLORPHENIRAMINE MALEATE MARKET, 2022-2032 ($MILLION)
- FIGURE 29. MEXICO CHLORPHENIRAMINE MALEATE MARKET, 2022-2032 ($MILLION)
- FIGURE 30. GERMANY CHLORPHENIRAMINE MALEATE MARKET, 2022-2032 ($MILLION)
- FIGURE 31. FRANCE CHLORPHENIRAMINE MALEATE MARKET, 2022-2032 ($MILLION)
- FIGURE 32. UK CHLORPHENIRAMINE MALEATE MARKET, 2022-2032 ($MILLION)
- FIGURE 33. ITALY CHLORPHENIRAMINE MALEATE MARKET, 2022-2032 ($MILLION)
- FIGURE 34. SPAIN CHLORPHENIRAMINE MALEATE MARKET, 2022-2032 ($MILLION)
- FIGURE 35. REST OF EUROPE CHLORPHENIRAMINE MALEATE MARKET, 2022-2032 ($MILLION)
- FIGURE 36. JAPAN CHLORPHENIRAMINE MALEATE MARKET, 2022-2032 ($MILLION)
- FIGURE 37. CHINA CHLORPHENIRAMINE MALEATE MARKET, 2022-2032 ($MILLION)
- FIGURE 38. AUSTRALIA CHLORPHENIRAMINE MALEATE MARKET, 2022-2032 ($MILLION)
- FIGURE 39. INDIA CHLORPHENIRAMINE MALEATE MARKET, 2022-2032 ($MILLION)
- FIGURE 40. SOUTH KOREA CHLORPHENIRAMINE MALEATE MARKET, 2022-2032 ($MILLION)
- FIGURE 41. REST OF ASIA-PACIFIC CHLORPHENIRAMINE MALEATE MARKET, 2022-2032 ($MILLION)
- FIGURE 42. BRAZIL CHLORPHENIRAMINE MALEATE MARKET, 2022-2032 ($MILLION)
- FIGURE 43. SAUDI ARABIA CHLORPHENIRAMINE MALEATE MARKET, 2022-2032 ($MILLION)
- FIGURE 44. SOUTH AFRICA CHLORPHENIRAMINE MALEATE MARKET, 2022-2032 ($MILLION)
- FIGURE 45. REST OF LAMEA CHLORPHENIRAMINE MALEATE MARKET, 2022-2032 ($MILLION)
- FIGURE 46. TOP WINNING STRATEGIES, BY YEAR
- FIGURE 47. TOP WINNING STRATEGIES, BY DEVELOPMENT
- FIGURE 48. TOP WINNING STRATEGIES, BY COMPANY
- FIGURE 49. PRODUCT MAPPING OF TOP 10 PLAYERS
- FIGURE 50. COMPETITIVE DASHBOARD
- FIGURE 51. COMPETITIVE HEATMAP: CHLORPHENIRAMINE MALEATE MARKET
- FIGURE 52. TOP PLAYER POSITIONING, 2022
- FIGURE 53. GLAXOSMITHKLINE PLC: NET SALES, 2020-2022 ($MILLION)
- FIGURE 54. GLAXOSMITHKLINE PLC: REVENUE SHARE BY SEGMENT, 2022 (%)
- FIGURE 55. GLAXOSMITHKLINE PLC: REVENUE SHARE BY REGION, 2022 (%)
- FIGURE 56. BAYER AG: NET SALES, 2020-2022 ($MILLION)
- FIGURE 57. BAYER AG: REVENUE SHARE BY SEGMENT, 2022 (%)
- FIGURE 58. BAYER AG: REVENUE SHARE BY REGION, 2022 (%)
- FIGURE 59. MERCK & CO., INC.: NET SALES, 2020-2022 ($MILLION)
- FIGURE 60. MERCK & CO., INC.: REVENUE SHARE BY SEGMENT, 2022 (%)
- FIGURE 61. MERCK & CO., INC.: REVENUE SHARE BY REGION, 2022 (%)
- FIGURE 62. JOHNSON & JOHNSON: NET SALES, 2020-2022 ($MILLION)
- FIGURE 63. JOHNSON & JOHNSON: REVENUE SHARE BY SEGMENT, 2022 (%)
- FIGURE 64. JOHNSON & JOHNSON: REVENUE SHARE BY REGION, 2022 (%)
- FIGURE 65. ALKEM LABORATORIES LTD.: NET REVENUE, 2020-2022 ($MILLION)
- FIGURE 66. ALKEM LABORATORIES LTD.: REVENUE SHARE BY REGION, 2022 (%)
- FIGURE 67. VIATRIS INC.: NET SALES, 2020-2022 ($MILLION)
- FIGURE 68. VIATRIS INC.: REVENUE SHARE BY SEGMENT, 2022 (%)
- FIGURE 69. ZYDUS LIFESCIENCES LIMITED: NET REVENUE, 2020-2022 ($MILLION)
- FIGURE 70. ZYDUS LIFESCIENCES LIMITED: REVENUE SHARE BY SEGMENT, 2022 (%)
- FIGURE 71. ZYDUS LIFESCIENCES LIMITED: REVENUE SHARE BY REGION, 2022 (%)
- FIGURE 72. SUN PHARMACEUTICAL INDUSTRIES LIMITED: SALES REVENUE, 2020-2022 ($MILLION)
- FIGURE 73. SUN PHARMACEUTICAL INDUSTRIES LIMITED: REVENUE SHARE BY REGION, 2022 (%)
 减充血剂市场:按类型、类别、适应症、分销管道划分 - 全球预测 2024-2030
 过敏性鼻炎治疗药物市场:2024-2034
 过敏性鼻炎治疗药物市场:按给药途径、药物类别和应用分类 - 全球预测 2024-2030
 鼻减充血剂市场:按产品类型、按减充血剂类型、按作用机制、按应用、按配销通路、按地区
 全球抗组胺药市场 (2022-2028)
 过敏性鼻炎药的全球市场 - 市场规模(各疾病,各治疗,各药品,各给药途径,各流通管道),产业的分析,地区预测,应用可能性,竞争的市场占有率,预测(2023年~2032年)
 过敏性鼻炎治疗市场:按治疗类型、给药途径、分销渠道、地区 - 规模、份额、前景和机会分析,2022-2030 年
 鼻腔用抗组织胺药物的全球市场 - 2022年~2029年