


 |
市场调查报告书
商品编码
1298438
射频滤波器市场:按电压、按应用:2021-2031 年全球机遇分析和行业预测RF Filter Market By Voltage, By Application: Global Opportunity Analysis and Industry Forecast, 2021-2031 |
||||||
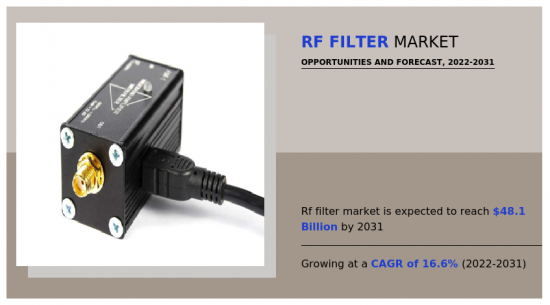
全球射频滤波器市场预计将从 2021 年的 105 亿美元增长到 2031 年的 481 亿美元,2022 年至 2031 年的复合年增长率为 16.6%。
RF(射频)滤波器是一种电子电路,旨在选择性地通过或阻止特定频段的信号。它用于抑制不需要的信号、噪声和干扰,同时允许需要的信号以最小的失真通过。射频滤波器广泛用于各种应用,包括无线通信系统、雷达系统和电子设备,以确保信号的可靠传输和接收。
智能家居、可穿戴设备和工业自动化等各种应用中使用的物联网设备数量不断增加,推动了对射频滤波器的需求。随着5G等新型无线通信技术的发展,对射频滤波器的需求预计将进一步增加。RF 滤波器对于防止不同无线信号之间的干扰是必要的,并且随着使用的无线设备数量的增加,对 RF 滤波器的需求预计也会增加。随着物联网设备越来越多地用于视频流、游戏和虚拟现实等应用,对高速数据传输的需求也随之增加。射频滤波器有助于确保设备之间可靠且高效的通信,从而实现更快的数据传输速率。这些因素正在推动射频滤波器市场的增长。
然而,经济状况会影响对射频滤波器的需求,特别是在电信、消费电子和汽车等行业,这些行业是射频滤波器的主要最终用户。经济衰退可能会导致射频滤波器製造商的需求下降和利润下降。此外,经济状况也会影响供应链,包括原材料成本和可用性、物流和运输,这会影响射频滤波器的成本和可用性。因此,射频滤波器製造商可能需要调整其生产和定价策略,以在不断变化的经济条件下保持竞争力。
由于 5G、物联网和 Wi-Fi 等无线技术的需求不断增加,预计未来几年 RF(射频)滤波器市场将大幅增长。射频滤波器是电子设备中处理无线电信号的关键组件,在确保可靠、高效的通信方面发挥着重要作用。射频滤波器市场的增长受到多种因素的推动,例如无线通信技术的不断采用、智能手机和其他移动设备的需求不断增长,以及自动驾驶汽车和智能家居等新型无线应用的出现。射频滤波器市场为电子和电信行业的公司提供了巨大的商机。
COVID-19 疫情对射频滤波器市场产生了中等影响。美国、中国等主要射频滤波器生产国受到进出口限制,给市场带来重大挑战。由于许多人在家工作,在大流行期间对高速互联网和更好的连接的需求有所增加。然而,射频滤波器的供应受到供应链中断的影响。这导致一些地区5G网络的推出出现延迟。疫情还影响了对使用射频滤波器的消费电子产品的需求。疫情期间,随着越来越多的人在家工作和学习,对智能手机、平板电脑和笔记本电脑的需求增加。
目录
第 1 章 简介
第二章执行摘要
第三章市场概况
- 市场定义和范围
- 主要发现
- 影响因素
- 主要投资口袋
- 波特五力分析
- 市场动态
- 促进者
- 抑製剂
- 机会
- 分析 COVID-19 对市场的影响
- 关键监管分析
- 市场份额分析
- 专利情况
- 监管指南
- 价值链分析
4. RF滤波器市场(按电压)
- 概述
- 市场规模及预测
- 声表面波滤波器
- 主要市场趋势、增长动力和机遇
- 市场规模/预测:按地区
- 市场份额分析:按国家分类
- 声波滤波器
- 主要市场趋势、增长动力和机遇
- 市场规模/预测:按地区
- 市场份额分析:按国家分类
5.射频滤波器市场(按应用)
- 概述
- 市场规模及预测
- 导航
- 主要市场趋势、增长动力和机遇
- 市场规模/预测:按地区
- 市场份额分析:按国家分类
- 无线电广播
- 主要市场趋势、增长动力和机遇
- 市场规模/预测:按地区
- 市场份额分析:按国家分类
- 电视转播
- 主要市场趋势、增长动力和机遇
- 市场规模/预测:按地区
- 市场份额分析:按国家分类
- 手机通讯
- 主要市场趋势、增长动力和机遇
- 市场规模/预测:按地区
- 市场份额分析:按国家分类
- 卫星通讯
- 主要市场趋势、增长动力和机遇
- 市场规模/预测:按地区
- 市场份额分析:按国家分类
- 航空航天与国防
- 主要市场趋势、增长动力和机遇
- 市场规模/预测:按地区
- 市场份额分析:按国家分类
- 其他
- 主要市场趋势、增长动力和机遇
- 市场规模/预测:按地区
- 市场份额分析:按国家分类
6.射频滤波器市场(按地区)
- 概述
- 市场规模/预测:按地区
- 北美
- 主要趋势和机遇
- 市场规模/预测:按电压
- 市场规模/预测:按应用
- 市场规模/预测:按国家
- 美国
- 主要市场趋势、增长动力和机遇
- 市场规模/预测:按电压
- 市场规模/预测:按应用
- 加拿大
- 主要市场趋势、增长动力和机遇
- 市场规模/预测:按电压
- 市场规模/预测:按应用
- 墨西哥
- 主要市场趋势、增长动力和机遇
- 市场规模/预测:按电压
- 市场规模/预测:按应用
- 欧洲
- 主要趋势和机遇
- 市场规模/预测:按电压
- 市场规模/预测:按应用
- 市场规模/预测:按国家
- 德国
- 主要市场趋势、增长动力和机遇
- 市场规模/预测:按电压
- 市场规模/预测:按应用
- 英国
- 主要市场趋势、增长动力和机遇
- 市场规模/预测:按电压
- 市场规模/预测:按应用
- 法国
- 主要市场趋势、增长动力和机遇
- 市场规模/预测:按电压
- 市场规模/预测:按应用
- 西班牙
- 主要市场趋势、增长动力和机遇
- 市场规模/预测:按电压
- 市场规模/预测:按应用
- 意大利
- 主要市场趋势、增长动力和机遇
- 市场规模/预测:按电压
- 市场规模/预测:按应用
- 欧洲其他地区
- 主要市场趋势、增长动力和机遇
- 市场规模/预测:按电压
- 市场规模/预测:按应用
- 亚太地区
- 主要趋势和机遇
- 市场规模/预测:按电压
- 市场规模/预测:按应用
- 市场规模/预测:按国家
- 中国
- 主要市场趋势、增长动力和机遇
- 市场规模/预测:按电压
- 市场规模/预测:按应用
- 日本
- 主要市场趋势、增长动力和机遇
- 市场规模/预测:按电压
- 市场规模/预测:按应用
- 印度
- 主要市场趋势、增长动力和机遇
- 市场规模/预测:按电压
- 市场规模/预测:按应用
- 韩国
- 主要市场趋势、增长动力和机遇
- 市场规模/预测:按电压
- 市场规模/预测:按应用
- 澳大利亚
- 主要市场趋势、增长动力和机遇
- 市场规模/预测:按电压
- 市场规模/预测:按应用
- 亚太其他地区
- 主要市场趋势、增长动力和机遇
- 市场规模/预测:按电压
- 市场规模/预测:按应用
- 拉丁美洲/中东/非洲
- 主要趋势和机遇
- 市场规模/预测:按电压
- 市场规模/预测:按应用
- 市场规模/预测:按国家
- 巴西
- 主要市场趋势、增长动力和机遇
- 市场规模/预测:按电压
- 市场规模/预测:按应用
- 沙特阿拉伯
- 主要市场趋势、增长动力和机遇
- 市场规模/预测:按电压
- 市场规模/预测:按应用
- 阿拉伯联合酋长国
- 主要市场趋势、增长动力和机遇
- 市场规模/预测:按电压
- 市场规模/预测:按应用
- 南非
- 主要市场趋势、增长动力和机遇
- 市场规模/预测:按电压
- 市场规模/预测:按应用
- 其他地区
- 主要市场趋势、增长动力和机遇
- 市场规模/预测:按电压
- 市场规模/预测:按应用
第7章 竞争格局
- 介绍
- 关键成功策略
- 10大公司产品图
- 比赛仪表板
- 比赛热图
- 2021 年顶级公司定位
第八章公司简介
- NXP Semiconductors N.V.
- Analog Devices, Inc.
- STMicroelectronics
- Murata Manufacturing Co.Ltd.
- Broadcom Inc.
- Anatech Electronics, Inc.
- K&L Microwave
- k&l microwave
- RS Microwave Company, Inc.
- api technologies
- Bird Technologies.
The global RF filters market is anticipated to reach $48.1 billion by 2031, growing from $10.5 billion in 2021 at a CAGR of 16.6% from 2022 to 2031.
Radio Frequency (RF) filter is an electronic circuit designed to selectively pass or reject signals with certain frequency ranges. It is used to suppress unwanted signals, noise, or interference, while allowing desired signals to pass through with minimal distortion. RF filters are used in various applications such as in wireless communication systems, radar systems, and electronic equipment to ensure reliable signal transmission and reception.
The increasing number of IoT devices being used in various applications such as smart homes, wearable devices, and industrial automation is driving the demand for RF filters. With the development of new wireless communication technologies such as 5G, the demand for RF filters is expected to increase further. RF filters are needed to prevent interference between different wireless signals, and with the increasing number of wireless devices being used, the need for RF filters is projected to grow. With the increase in use of IoT devices for applications such as video streaming, gaming, and virtual reality, there is a need for high-speed data transfer. RF filters help to ensure that the communication between devices is reliable and efficient, enabling faster data transfer rates. These factors are driving the growth of for the RF filters market.
However, economic conditions can impact the demand for RF filters, especially in industries such as telecommunications, consumer electronics, and automotive, which are major end-users of RF filters . Economic downturns can result in reduced demand and lower revenues for RF filter manufacturers. In addition, economic conditions can impact the supply chain, including raw material costs and availability, logistics, and transportation, which can also affect the cost and availability of RF filters. Therefore, manufacturers of RF filters may need to adjust their production and pricing strategies to remain competitive in changing economic conditions.
The Radio Frequency (RF) filters market is expected to experience significant growth in the upcoming years due to the increase in demand for wireless technologies such as 5G, IoT, and Wi-Fi. RF filters are critical components in electronic devices that operate on wireless signals, and they play a crucial role in ensuring reliable and efficient communication. The growth of the RF filters market is driven by several factors, including the increasing adoption of wireless communication technologies, the growing demand for smartphones and other mobile devices, and the emergence of new wireless applications such as autonomous vehicles and smart homes. The RF filters market presents a significant opportunity for companies operating in the electronics and telecommunications industries.
The COVID-19 pandemic has had a moderate impact on the RF filters market. There were import-export restrictions laid down on major RF filters producing countries such as the U.S. and China, which imposed significant challenges to the market. With many people working from home, the demand for high-speed internet and better connectivity increased during the pandemic. However, the supply of RF filters has been affected due to the disruption of the supply chain. This led to delays in the deployment of 5G networks in some regions. The pandemic also affected the demand for consumer electronics products that use RF filters. The demand for smartphones, tablets, and laptops has increased during the pandemic, as people were working and studying from home.
The key players profiled in this report include: NXP Semiconductors N.V., Analog Devices, Inc., STMicroelectronics, Murata Manufacturing Co. Ltd., Broadcom Inc., Anatech Electronics, Inc., K&L Microwave, RS Microwave Company, Inc., API Technologies, and Bird Technologies.
Key Benefits For Stakeholders
- This report provides a quantitative analysis of the market segments, current trends, estimations, and dynamics of the rf filter market analysis from 2021 to 2031 to identify the prevailing rf filter market opportunities.
- The market research is offered along with information related to key drivers, restraints, and opportunities.
- Porter's five forces analysis highlights the potency of buyers and suppliers to enable stakeholders make profit-oriented business decisions and strengthen their supplier-buyer network.
- In-depth analysis of the rf filter market segmentation assists to determine the prevailing market opportunities.
- Major countries in each region are mapped according to their revenue contribution to the global market.
- Market player positioning facilitates benchmarking and provides a clear understanding of the present position of the market players.
- The report includes the analysis of the regional as well as global rf filter market trends, key players, market segments, application areas, and market growth strategies.
Key Market Segments
By Application
- Navigation
- Radio Broadcast
- TV Broadcast
- Mobile Phone Communication
- Satellite Communication
- Aerospace and Defence
- Others
By Voltage
- SAW Filter
- BAW Filter
By Region
- North America
- U.S.
- Canada
- Mexico
- Europe
- Germany
- UK
- France
- Spain
- Italy
- Rest of Europe
- Asia-Pacific
- China
- Japan
- India
- South Korea
- Australia
- Rest of Asia-Pacific
- LAMEA
- Brazil
- Saudi Arabia
- UAE
- South Africa
- Rest of LAMEA
Key Market Players:
- K&L Microwave
- k&l microwave
- NXP Semiconductors N.V.
- Analog Devices, Inc.
- STMicroelectronics
- Murata Manufacturing Co.Ltd.
- Broadcom Inc.
- Anatech Electronics, Inc.
- RS Microwave Company, Inc.
- api technologies
- Bird Technologies.
TABLE OF CONTENTS
CHAPTER 1: INTRODUCTION
- 1.1. Report description
- 1.2. Key market segments
- 1.3. Key benefits to the stakeholders
- 1.4. Research Methodology
- 1.4.1. Primary research
- 1.4.2. Secondary research
- 1.4.3. Analyst tools and models
CHAPTER 2: EXECUTIVE SUMMARY
- 2.1. CXO Perspective
CHAPTER 3: MARKET OVERVIEW
- 3.1. Market definition and scope
- 3.2. Key findings
- 3.2.1. Top impacting factors
- 3.2.2. Top investment pockets
- 3.3. Porter's five forces analysis
- 3.4. Market dynamics
- 3.4.1. Drivers
- 3.4.2. Restraints
- 3.4.3. Opportunities
- 3.5. COVID-19 Impact Analysis on the market
- 3.6. Key Regulation Analysis
- 3.7. Market Share Analysis
- 3.8. Patent Landscape
- 3.9. Regulatory Guidelines
- 3.10. Value Chain Analysis
CHAPTER 4: RF FILTER MARKET, BY VOLTAGE
- 4.1. Overview
- 4.1.1. Market size and forecast
- 4.2. SAW Filter
- 4.2.1. Key market trends, growth factors and opportunities
- 4.2.2. Market size and forecast, by region
- 4.2.3. Market share analysis by country
- 4.3. BAW Filter
- 4.3.1. Key market trends, growth factors and opportunities
- 4.3.2. Market size and forecast, by region
- 4.3.3. Market share analysis by country
CHAPTER 5: RF FILTER MARKET, BY APPLICATION
- 5.1. Overview
- 5.1.1. Market size and forecast
- 5.2. Navigation
- 5.2.1. Key market trends, growth factors and opportunities
- 5.2.2. Market size and forecast, by region
- 5.2.3. Market share analysis by country
- 5.3. Radio Broadcast
- 5.3.1. Key market trends, growth factors and opportunities
- 5.3.2. Market size and forecast, by region
- 5.3.3. Market share analysis by country
- 5.4. TV Broadcast
- 5.4.1. Key market trends, growth factors and opportunities
- 5.4.2. Market size and forecast, by region
- 5.4.3. Market share analysis by country
- 5.5. Mobile Phone Communication
- 5.5.1. Key market trends, growth factors and opportunities
- 5.5.2. Market size and forecast, by region
- 5.5.3. Market share analysis by country
- 5.6. Satellite Communication
- 5.6.1. Key market trends, growth factors and opportunities
- 5.6.2. Market size and forecast, by region
- 5.6.3. Market share analysis by country
- 5.7. Aerospace and Defence
- 5.7.1. Key market trends, growth factors and opportunities
- 5.7.2. Market size and forecast, by region
- 5.7.3. Market share analysis by country
- 5.8. Others
- 5.8.1. Key market trends, growth factors and opportunities
- 5.8.2. Market size and forecast, by region
- 5.8.3. Market share analysis by country
CHAPTER 6: RF FILTER MARKET, BY REGION
- 6.1. Overview
- 6.1.1. Market size and forecast By Region
- 6.2. North America
- 6.2.1. Key trends and opportunities
- 6.2.2. Market size and forecast, by Voltage
- 6.2.3. Market size and forecast, by Application
- 6.2.4. Market size and forecast, by country
- 6.2.4.1. U.S.
- 6.2.4.1.1. Key market trends, growth factors and opportunities
- 6.2.4.1.2. Market size and forecast, by Voltage
- 6.2.4.1.3. Market size and forecast, by Application
- 6.2.4.2. Canada
- 6.2.4.2.1. Key market trends, growth factors and opportunities
- 6.2.4.2.2. Market size and forecast, by Voltage
- 6.2.4.2.3. Market size and forecast, by Application
- 6.2.4.3. Mexico
- 6.2.4.3.1. Key market trends, growth factors and opportunities
- 6.2.4.3.2. Market size and forecast, by Voltage
- 6.2.4.3.3. Market size and forecast, by Application
- 6.3. Europe
- 6.3.1. Key trends and opportunities
- 6.3.2. Market size and forecast, by Voltage
- 6.3.3. Market size and forecast, by Application
- 6.3.4. Market size and forecast, by country
- 6.3.4.1. Germany
- 6.3.4.1.1. Key market trends, growth factors and opportunities
- 6.3.4.1.2. Market size and forecast, by Voltage
- 6.3.4.1.3. Market size and forecast, by Application
- 6.3.4.2. UK
- 6.3.4.2.1. Key market trends, growth factors and opportunities
- 6.3.4.2.2. Market size and forecast, by Voltage
- 6.3.4.2.3. Market size and forecast, by Application
- 6.3.4.3. France
- 6.3.4.3.1. Key market trends, growth factors and opportunities
- 6.3.4.3.2. Market size and forecast, by Voltage
- 6.3.4.3.3. Market size and forecast, by Application
- 6.3.4.4. Spain
- 6.3.4.4.1. Key market trends, growth factors and opportunities
- 6.3.4.4.2. Market size and forecast, by Voltage
- 6.3.4.4.3. Market size and forecast, by Application
- 6.3.4.5. Italy
- 6.3.4.5.1. Key market trends, growth factors and opportunities
- 6.3.4.5.2. Market size and forecast, by Voltage
- 6.3.4.5.3. Market size and forecast, by Application
- 6.3.4.6. Rest of Europe
- 6.3.4.6.1. Key market trends, growth factors and opportunities
- 6.3.4.6.2. Market size and forecast, by Voltage
- 6.3.4.6.3. Market size and forecast, by Application
- 6.4. Asia-Pacific
- 6.4.1. Key trends and opportunities
- 6.4.2. Market size and forecast, by Voltage
- 6.4.3. Market size and forecast, by Application
- 6.4.4. Market size and forecast, by country
- 6.4.4.1. China
- 6.4.4.1.1. Key market trends, growth factors and opportunities
- 6.4.4.1.2. Market size and forecast, by Voltage
- 6.4.4.1.3. Market size and forecast, by Application
- 6.4.4.2. Japan
- 6.4.4.2.1. Key market trends, growth factors and opportunities
- 6.4.4.2.2. Market size and forecast, by Voltage
- 6.4.4.2.3. Market size and forecast, by Application
- 6.4.4.3. India
- 6.4.4.3.1. Key market trends, growth factors and opportunities
- 6.4.4.3.2. Market size and forecast, by Voltage
- 6.4.4.3.3. Market size and forecast, by Application
- 6.4.4.4. South Korea
- 6.4.4.4.1. Key market trends, growth factors and opportunities
- 6.4.4.4.2. Market size and forecast, by Voltage
- 6.4.4.4.3. Market size and forecast, by Application
- 6.4.4.5. Australia
- 6.4.4.5.1. Key market trends, growth factors and opportunities
- 6.4.4.5.2. Market size and forecast, by Voltage
- 6.4.4.5.3. Market size and forecast, by Application
- 6.4.4.6. Rest of Asia-Pacific
- 6.4.4.6.1. Key market trends, growth factors and opportunities
- 6.4.4.6.2. Market size and forecast, by Voltage
- 6.4.4.6.3. Market size and forecast, by Application
- 6.5. LAMEA
- 6.5.1. Key trends and opportunities
- 6.5.2. Market size and forecast, by Voltage
- 6.5.3. Market size and forecast, by Application
- 6.5.4. Market size and forecast, by country
- 6.5.4.1. Brazil
- 6.5.4.1.1. Key market trends, growth factors and opportunities
- 6.5.4.1.2. Market size and forecast, by Voltage
- 6.5.4.1.3. Market size and forecast, by Application
- 6.5.4.2. Saudi Arabia
- 6.5.4.2.1. Key market trends, growth factors and opportunities
- 6.5.4.2.2. Market size and forecast, by Voltage
- 6.5.4.2.3. Market size and forecast, by Application
- 6.5.4.3. UAE
- 6.5.4.3.1. Key market trends, growth factors and opportunities
- 6.5.4.3.2. Market size and forecast, by Voltage
- 6.5.4.3.3. Market size and forecast, by Application
- 6.5.4.4. South Africa
- 6.5.4.4.1. Key market trends, growth factors and opportunities
- 6.5.4.4.2. Market size and forecast, by Voltage
- 6.5.4.4.3. Market size and forecast, by Application
- 6.5.4.5. Rest of LAMEA
- 6.5.4.5.1. Key market trends, growth factors and opportunities
- 6.5.4.5.2. Market size and forecast, by Voltage
- 6.5.4.5.3. Market size and forecast, by Application
CHAPTER 7: COMPETITIVE LANDSCAPE
- 7.1. Introduction
- 7.2. Top winning strategies
- 7.3. Product Mapping of Top 10 Player
- 7.4. Competitive Dashboard
- 7.5. Competitive Heatmap
- 7.6. Top player positioning, 2021
CHAPTER 8: COMPANY PROFILES
- 8.1. NXP Semiconductors N.V.
- 8.1.1. Company overview
- 8.1.2. Key Executives
- 8.1.3. Company snapshot
- 8.2. Analog Devices, Inc.
- 8.2.1. Company overview
- 8.2.2. Key Executives
- 8.2.3. Company snapshot
- 8.3. STMicroelectronics
- 8.3.1. Company overview
- 8.3.2. Key Executives
- 8.3.3. Company snapshot
- 8.4. Murata Manufacturing Co.Ltd.
- 8.4.1. Company overview
- 8.4.2. Key Executives
- 8.4.3. Company snapshot
- 8.5. Broadcom Inc.
- 8.5.1. Company overview
- 8.5.2. Key Executives
- 8.5.3. Company snapshot
- 8.6. Anatech Electronics, Inc.
- 8.6.1. Company overview
- 8.6.2. Key Executives
- 8.6.3. Company snapshot
- 8.7. K&L Microwave
- 8.7.1. Company overview
- 8.7.2. Key Executives
- 8.7.3. Company snapshot
- 8.8. k&l microwave
- 8.8.1. Company overview
- 8.8.2. Key Executives
- 8.8.3. Company snapshot
- 8.9. RS Microwave Company, Inc.
- 8.9.1. Company overview
- 8.9.2. Key Executives
- 8.9.3. Company snapshot
- 8.10. api technologies
- 8.10.1. Company overview
- 8.10.2. Key Executives
- 8.10.3. Company snapshot
- 8.11. Bird Technologies.
- 8.11.1. Company overview
- 8.11.2. Key Executives
- 8.11.3. Company snapshot
LIST OF TABLES
- TABLE 01. GLOBAL RF FILTER MARKET, BY VOLTAGE, 2021-2031 ($MILLION)
- TABLE 02. RF FILTER MARKET FOR SAW FILTER, BY REGION, 2021-2031 ($MILLION)
- TABLE 03. RF FILTER MARKET FOR BAW FILTER, BY REGION, 2021-2031 ($MILLION)
- TABLE 04. GLOBAL RF FILTER MARKET, BY APPLICATION, 2021-2031 ($MILLION)
- TABLE 05. RF FILTER MARKET FOR NAVIGATION, BY REGION, 2021-2031 ($MILLION)
- TABLE 06. RF FILTER MARKET FOR RADIO BROADCAST, BY REGION, 2021-2031 ($MILLION)
- TABLE 07. RF FILTER MARKET FOR TV BROADCAST, BY REGION, 2021-2031 ($MILLION)
- TABLE 08. RF FILTER MARKET FOR MOBILE PHONE COMMUNICATION, BY REGION, 2021-2031 ($MILLION)
- TABLE 09. RF FILTER MARKET FOR SATELLITE COMMUNICATION, BY REGION, 2021-2031 ($MILLION)
- TABLE 10. RF FILTER MARKET FOR AEROSPACE AND DEFENCE, BY REGION, 2021-2031 ($MILLION)
- TABLE 11. RF FILTER MARKET FOR OTHERS, BY REGION, 2021-2031 ($MILLION)
- TABLE 12. RF FILTER MARKET, BY REGION, 2021-2031 ($MILLION)
- TABLE 13. NORTH AMERICA RF FILTER MARKET, BY VOLTAGE, 2021-2031 ($MILLION)
- TABLE 14. NORTH AMERICA RF FILTER MARKET, BY APPLICATION, 2021-2031 ($MILLION)
- TABLE 15. NORTH AMERICA RF FILTER MARKET, BY COUNTRY, 2021-2031 ($MILLION)
- TABLE 16. U.S. RF FILTER MARKET, BY VOLTAGE, 2021-2031 ($MILLION)
- TABLE 17. U.S. RF FILTER MARKET, BY APPLICATION, 2021-2031 ($MILLION)
- TABLE 18. CANADA RF FILTER MARKET, BY VOLTAGE, 2021-2031 ($MILLION)
- TABLE 19. CANADA RF FILTER MARKET, BY APPLICATION, 2021-2031 ($MILLION)
- TABLE 20. MEXICO RF FILTER MARKET, BY VOLTAGE, 2021-2031 ($MILLION)
- TABLE 21. MEXICO RF FILTER MARKET, BY APPLICATION, 2021-2031 ($MILLION)
- TABLE 22. EUROPE RF FILTER MARKET, BY VOLTAGE, 2021-2031 ($MILLION)
- TABLE 23. EUROPE RF FILTER MARKET, BY APPLICATION, 2021-2031 ($MILLION)
- TABLE 24. EUROPE RF FILTER MARKET, BY COUNTRY, 2021-2031 ($MILLION)
- TABLE 25. GERMANY RF FILTER MARKET, BY VOLTAGE, 2021-2031 ($MILLION)
- TABLE 26. GERMANY RF FILTER MARKET, BY APPLICATION, 2021-2031 ($MILLION)
- TABLE 27. UK RF FILTER MARKET, BY VOLTAGE, 2021-2031 ($MILLION)
- TABLE 28. UK RF FILTER MARKET, BY APPLICATION, 2021-2031 ($MILLION)
- TABLE 29. FRANCE RF FILTER MARKET, BY VOLTAGE, 2021-2031 ($MILLION)
- TABLE 30. FRANCE RF FILTER MARKET, BY APPLICATION, 2021-2031 ($MILLION)
- TABLE 31. SPAIN RF FILTER MARKET, BY VOLTAGE, 2021-2031 ($MILLION)
- TABLE 32. SPAIN RF FILTER MARKET, BY APPLICATION, 2021-2031 ($MILLION)
- TABLE 33. ITALY RF FILTER MARKET, BY VOLTAGE, 2021-2031 ($MILLION)
- TABLE 34. ITALY RF FILTER MARKET, BY APPLICATION, 2021-2031 ($MILLION)
- TABLE 35. REST OF EUROPE RF FILTER MARKET, BY VOLTAGE, 2021-2031 ($MILLION)
- TABLE 36. REST OF EUROPE RF FILTER MARKET, BY APPLICATION, 2021-2031 ($MILLION)
- TABLE 37. ASIA-PACIFIC RF FILTER MARKET, BY VOLTAGE, 2021-2031 ($MILLION)
- TABLE 38. ASIA-PACIFIC RF FILTER MARKET, BY APPLICATION, 2021-2031 ($MILLION)
- TABLE 39. ASIA-PACIFIC RF FILTER MARKET, BY COUNTRY, 2021-2031 ($MILLION)
- TABLE 40. CHINA RF FILTER MARKET, BY VOLTAGE, 2021-2031 ($MILLION)
- TABLE 41. CHINA RF FILTER MARKET, BY APPLICATION, 2021-2031 ($MILLION)
- TABLE 42. JAPAN RF FILTER MARKET, BY VOLTAGE, 2021-2031 ($MILLION)
- TABLE 43. JAPAN RF FILTER MARKET, BY APPLICATION, 2021-2031 ($MILLION)
- TABLE 44. INDIA RF FILTER MARKET, BY VOLTAGE, 2021-2031 ($MILLION)
- TABLE 45. INDIA RF FILTER MARKET, BY APPLICATION, 2021-2031 ($MILLION)
- TABLE 46. SOUTH KOREA RF FILTER MARKET, BY VOLTAGE, 2021-2031 ($MILLION)
- TABLE 47. SOUTH KOREA RF FILTER MARKET, BY APPLICATION, 2021-2031 ($MILLION)
- TABLE 48. AUSTRALIA RF FILTER MARKET, BY VOLTAGE, 2021-2031 ($MILLION)
- TABLE 49. AUSTRALIA RF FILTER MARKET, BY APPLICATION, 2021-2031 ($MILLION)
- TABLE 50. REST OF ASIA-PACIFIC RF FILTER MARKET, BY VOLTAGE, 2021-2031 ($MILLION)
- TABLE 51. REST OF ASIA-PACIFIC RF FILTER MARKET, BY APPLICATION, 2021-2031 ($MILLION)
- TABLE 52. LAMEA RF FILTER MARKET, BY VOLTAGE, 2021-2031 ($MILLION)
- TABLE 53. LAMEA RF FILTER MARKET, BY APPLICATION, 2021-2031 ($MILLION)
- TABLE 54. LAMEA RF FILTER MARKET, BY COUNTRY, 2021-2031 ($MILLION)
- TABLE 55. BRAZIL RF FILTER MARKET, BY VOLTAGE, 2021-2031 ($MILLION)
- TABLE 56. BRAZIL RF FILTER MARKET, BY APPLICATION, 2021-2031 ($MILLION)
- TABLE 57. SAUDI ARABIA RF FILTER MARKET, BY VOLTAGE, 2021-2031 ($MILLION)
- TABLE 58. SAUDI ARABIA RF FILTER MARKET, BY APPLICATION, 2021-2031 ($MILLION)
- TABLE 59. UAE RF FILTER MARKET, BY VOLTAGE, 2021-2031 ($MILLION)
- TABLE 60. UAE RF FILTER MARKET, BY APPLICATION, 2021-2031 ($MILLION)
- TABLE 61. SOUTH AFRICA RF FILTER MARKET, BY VOLTAGE, 2021-2031 ($MILLION)
- TABLE 62. SOUTH AFRICA RF FILTER MARKET, BY APPLICATION, 2021-2031 ($MILLION)
- TABLE 63. REST OF LAMEA RF FILTER MARKET, BY VOLTAGE, 2021-2031 ($MILLION)
- TABLE 64. REST OF LAMEA RF FILTER MARKET, BY APPLICATION, 2021-2031 ($MILLION)
- TABLE 65. NXP SEMICONDUCTORS N.V.: KEY EXECUTIVES
- TABLE 66. NXP SEMICONDUCTORS N.V.: COMPANY SNAPSHOT
- TABLE 67. ANALOG DEVICES, INC.: KEY EXECUTIVES
- TABLE 68. ANALOG DEVICES, INC.: COMPANY SNAPSHOT
- TABLE 69. STMICROELECTRONICS: KEY EXECUTIVES
- TABLE 70. STMICROELECTRONICS: COMPANY SNAPSHOT
- TABLE 71. MURATA MANUFACTURING CO.LTD.: KEY EXECUTIVES
- TABLE 72. MURATA MANUFACTURING CO.LTD.: COMPANY SNAPSHOT
- TABLE 73. BROADCOM INC.: KEY EXECUTIVES
- TABLE 74. BROADCOM INC.: COMPANY SNAPSHOT
- TABLE 75. ANATECH ELECTRONICS, INC.: KEY EXECUTIVES
- TABLE 76. ANATECH ELECTRONICS, INC.: COMPANY SNAPSHOT
- TABLE 77. K&L MICROWAVE: KEY EXECUTIVES
- TABLE 78. K&L MICROWAVE: COMPANY SNAPSHOT
- TABLE 79. K&L MICROWAVE: KEY EXECUTIVES
- TABLE 80. K&L MICROWAVE: COMPANY SNAPSHOT
- TABLE 81. RS MICROWAVE COMPANY, INC.: KEY EXECUTIVES
- TABLE 82. RS MICROWAVE COMPANY, INC.: COMPANY SNAPSHOT
- TABLE 83. API TECHNOLOGIES: KEY EXECUTIVES
- TABLE 84. API TECHNOLOGIES: COMPANY SNAPSHOT
- TABLE 85. BIRD TECHNOLOGIES.: KEY EXECUTIVES
- TABLE 86. BIRD TECHNOLOGIES.: COMPANY SNAPSHOT
LIST OF FIGURES
- FIGURE 01. RF FILTER MARKET, 2021-2031
- FIGURE 02. SEGMENTATION OF RF FILTER MARKET, 2021-2031
- FIGURE 03. TOP INVESTMENT POCKETS IN RF FILTER MARKET (2022-2031)
- FIGURE 04. PORTER FIVE-1
- FIGURE 05. PORTER FIVE-2
- FIGURE 06. PORTER FIVE-3
- FIGURE 07. PORTER FIVE-4
- FIGURE 08. PORTER FIVE-5
- FIGURE 09. DRIVERS, RESTRAINTS AND OPPORTUNITIES: GLOBALRF FILTER MARKET
- FIGURE 10. IMPACT OF KEY REGULATION: RF FILTER MARKET
- FIGURE 11. MARKET SHARE ANALYSIS: RF FILTER MARKET
- FIGURE 12. PATENT ANALYSIS BY COMPANY
- FIGURE 13. PATENT ANALYSIS BY COUNTRY
- FIGURE 14. REGULATORY GUIDELINES: RF FILTER MARKET
- FIGURE 15. VALUE CHAIN ANALYSIS: RF FILTER MARKET
- FIGURE 16. RF FILTER MARKET, BY VOLTAGE, 2021(%)
- FIGURE 17. COMPARATIVE SHARE ANALYSIS OF RF FILTER MARKET FOR SAW FILTER, BY COUNTRY 2021 AND 2031(%)
- FIGURE 18. COMPARATIVE SHARE ANALYSIS OF RF FILTER MARKET FOR BAW FILTER, BY COUNTRY 2021 AND 2031(%)
- FIGURE 19. RF FILTER MARKET, BY APPLICATION, 2021(%)
- FIGURE 20. COMPARATIVE SHARE ANALYSIS OF RF FILTER MARKET FOR NAVIGATION, BY COUNTRY 2021 AND 2031(%)
- FIGURE 21. COMPARATIVE SHARE ANALYSIS OF RF FILTER MARKET FOR RADIO BROADCAST, BY COUNTRY 2021 AND 2031(%)
- FIGURE 22. COMPARATIVE SHARE ANALYSIS OF RF FILTER MARKET FOR TV BROADCAST, BY COUNTRY 2021 AND 2031(%)
- FIGURE 23. COMPARATIVE SHARE ANALYSIS OF RF FILTER MARKET FOR MOBILE PHONE COMMUNICATION, BY COUNTRY 2021 AND 2031(%)
- FIGURE 24. COMPARATIVE SHARE ANALYSIS OF RF FILTER MARKET FOR SATELLITE COMMUNICATION, BY COUNTRY 2021 AND 2031(%)
- FIGURE 25. COMPARATIVE SHARE ANALYSIS OF RF FILTER MARKET FOR AEROSPACE AND DEFENCE, BY COUNTRY 2021 AND 2031(%)
- FIGURE 26. COMPARATIVE SHARE ANALYSIS OF RF FILTER MARKET FOR OTHERS, BY COUNTRY 2021 AND 2031(%)
- FIGURE 27. RF FILTER MARKET BY REGION, 2021
- FIGURE 28. U.S. RF FILTER MARKET, 2021-2031 ($MILLION)
- FIGURE 29. CANADA RF FILTER MARKET, 2021-2031 ($MILLION)
- FIGURE 30. MEXICO RF FILTER MARKET, 2021-2031 ($MILLION)
- FIGURE 31. GERMANY RF FILTER MARKET, 2021-2031 ($MILLION)
- FIGURE 32. UK RF FILTER MARKET, 2021-2031 ($MILLION)
- FIGURE 33. FRANCE RF FILTER MARKET, 2021-2031 ($MILLION)
- FIGURE 34. SPAIN RF FILTER MARKET, 2021-2031 ($MILLION)
- FIGURE 35. ITALY RF FILTER MARKET, 2021-2031 ($MILLION)
- FIGURE 36. REST OF EUROPE RF FILTER MARKET, 2021-2031 ($MILLION)
- FIGURE 37. CHINA RF FILTER MARKET, 2021-2031 ($MILLION)
- FIGURE 38. JAPAN RF FILTER MARKET, 2021-2031 ($MILLION)
- FIGURE 39. INDIA RF FILTER MARKET, 2021-2031 ($MILLION)
- FIGURE 40. SOUTH KOREA RF FILTER MARKET, 2021-2031 ($MILLION)
- FIGURE 41. AUSTRALIA RF FILTER MARKET, 2021-2031 ($MILLION)
- FIGURE 42. REST OF ASIA-PACIFIC RF FILTER MARKET, 2021-2031 ($MILLION)
- FIGURE 43. BRAZIL RF FILTER MARKET, 2021-2031 ($MILLION)
- FIGURE 44. SAUDI ARABIA RF FILTER MARKET, 2021-2031 ($MILLION)
- FIGURE 45. UAE RF FILTER MARKET, 2021-2031 ($MILLION)
- FIGURE 46. SOUTH AFRICA RF FILTER MARKET, 2021-2031 ($MILLION)
- FIGURE 47. REST OF LAMEA RF FILTER MARKET, 2021-2031 ($MILLION)
- FIGURE 48. TOP WINNING STRATEGIES, BY YEAR
- FIGURE 49. TOP WINNING STRATEGIES, BY DEVELOPMENT
- FIGURE 50. TOP WINNING STRATEGIES, BY COMPANY
- FIGURE 51. PRODUCT MAPPING OF TOP 10 PLAYERS
- FIGURE 52. COMPETITIVE DASHBOARD
- FIGURE 53. COMPETITIVE HEATMAP: RF FILTER MARKET
- FIGURE 54. TOP PLAYER POSITIONING, 2021
 2024-2028 年全球射频滤波器市场
 全球射频滤波器市场
 2023-2030年全球射频滤波器市场规模研究和预测,按应用按电压和区域分析
 到 2028 年的 RF 滤波器市场预测 - 按电压(体声波滤波器、表面声波滤波器)、功能类型、滤波器类型、连接技术、应用和区域的全球分析
 RF 滤波器全球市场规模、份额、行业趋势分析报告:按电压、按应用、按地区、展望和预测,2023-2029 年
 RF过滤器市场:5G网路和IoT设备的进步促进市场成长
 全球和美国射频腔体滤波器市场:分析与预测 (2022-2028)
 全球 LTCC 射频滤波器市场:分析、历史和预测 (2017-2028)
 全球射频滤波器市场:滤波器特定信息未来预测(至 2027 年)