


 |
市场调查报告书
商品编码
1344286
HDPE 管道市场:按类型、按应用划分:2023-2032 年全球机会分析和产业预测HDPE Pipes Market By Type (HDPE 63, HDPE 80, HDPE 100), By Application (Oil and Gas Pipe, Agricultural Irrigation Pipe, Water Supply Pipe, Sewage System Pipe, Others): Global Opportunity Analysis and Industry Forecast, 2023-2032 |
||||||
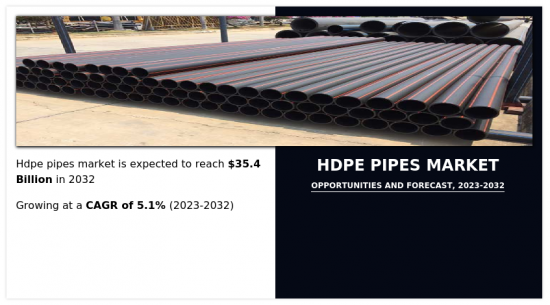
2022年HDPE管道市场价值为217亿美元,预计2023年至2032年复合年增长率为5.1%,到2032年达到354亿美元。
快速成长的人口、快速的经济成长和工业发展增加了对可靠供水系统的需求。 工业需要为製造流程、冷却系统和卫生目的提供可靠的水供应。 随着国家的发展,它们更加重视基础设施,包括供水系统,以支持工业成长。 HDPE管道广泛应用于饮用水和灌溉的配水系统。 HDPE 管道耐用、耐腐蚀、耐高压,是向住宅、商业和农业区域供水的理想选择。 此外,HDPE管道也用于收集和输送污水和废水。 它可以处理高腐蚀性污水,并且耐化学性和磨损。 HDPE 管道光滑的内表面可防止碎屑堆积并确保高效流动。 这些因素共同构成了预测期内 HDPE 管道市场成长的关键驱动因素之一。
HDPE管道的耐高温能力相对较低。 持续暴露在高于建议限值的温度下可能会导致管道变形和潜在故障。 因此,HDPE 管道可能不适合暴露于极高温度或热物质的应用。 此外,HDPE 管需要特定的安装技术,例如正确的熔接和机械连接方法。 安装不当、熔合不良和连接不良会导致管道洩漏、性能不佳和过早失效。 遵循製造商的指南并聘请经过培训的专业人员进行安装非常重要。 这些因素都限制了HDPE管道市场的成长。
全球基础设施领域经历了显着增长,包括供水系统、废水管理设施和灌溉网路的建设,并且预计将继续增长。 例如,根据印度品牌资产基金会2023年1月发表的一篇文章,预计到2027年印度基础设施产业复合年增长率将达到8.2%,HDPE管道应用广泛。 HDPE 管道的耐用性、灵活性和耐化学性使其成为基础设施项目的理想选择,而几家主要製造商正在提高其 HDPE 管道的生产能力。 对可靠和永续基础设施的需求不断增长,为 HDPE 管道市场创造了巨大的机会。 这一因素预计将推动食品和饮料行业对 HDPE 管道的需求,为市场成长提供新的途径。
目录
第1章简介
第 2 章执行摘要
第3章市场概述
- 市场定义和范围
- 主要发现
- 影响因素
- 主要投资机会
- 波特五力分析
- 市场动态
- 促进因素
- 稳定的供水需求
- 医疗器材製造业的强劲需求
- 抑制因素
- 温度限制和维护可能会阻碍市场成长
- 机会
- 促进因素
- 新冠肺炎 (COVID-19):市场影响分析
- 平均售价
- 市占率分析
- 品牌占有率分析
- 价格分析
- 价值链分析
- 专利情况
- 主要监理分析
第 4 章 HDPE 管道市场:按类型
- 摘要
- 高密度聚乙烯 63
- 高密度聚乙烯 80
- 高密度聚乙烯 100
第 5 章 HDPE 管道市场:依应用分类
- 摘要
- 石油和天然气管道
- 农业灌溉管道
- 供水管
- 污水管
- 其他
第 6 章 HDPE 管道市场:按地区
- 摘要
- 北美
- 美国
- 加拿大
- 墨西哥
- 欧洲
- 德国
- 英国
- 法国
- 义大利
- 西班牙
- 欧洲其他地区
- 亚太地区
- 中国
- 日本
- 印度
- 韩国
- 奥地利
- 其他亚太地区
- 拉丁美洲/中东/非洲
- 巴西
- 沙乌地阿拉伯
- 南非
- 其他拉丁美洲/中东/非洲
第7章竞争态势
- 简介
- 关键成功策略
- 10家主要公司的产品图谱
- 竞争对手仪表板
- 竞争热图
- 2022 年主要公司的定位
第8章公司简介
- Lane Enterprises, Inc
- JM EAGLE, INC.
- Blue Diamond Industries
- Vectus
- POLY PLASTIC Group
- WL Plastics
- Prinsco, Inc.
- SCG Chemicals Public Company Limited
- United Poly Systems
- RADIUS System
According to a new report published by Allied Market Research, titled, "HDPE Pipes Market," The hdpe pipes market was valued at $21.7 billion in 2022, and is estimated to reach $35.4 billion by 2032, growing at a CAGR of 5.1% from 2023 to 2032.
Surge in population, rapid economic growth, and industrial development drive the need for reliable water supply systems. Industries require a consistent water supply for manufacturing processes, cooling systems, and sanitation purposes. As economies develop, there is a greater emphasis on improving infrastructure, including water supply systems, to support industrial growth. HDPE pipes are widely used for water distribution systems, both for potable water and irrigation purposes. Their durability, resistance to corrosion, and ability to withstand high pressure make them ideal for delivering water to residential, commercial, and agricultural areas. In addition, HDPE pipes are used for sewer and wastewater collection and transportation. They can handle the corrosive nature of sewage and are resistant to chemicals and abrasion. The smooth inner surface of HDPE pipes prevents the buildup of debris and ensures efficient flow. These factors together act as one of the key drivers responsible for the growth of the HDPE pipes market during the forecast period.
HDPE pipes have a relatively low resistance to elevated temperatures. Continuous exposure to temperatures above the recommended limit can cause deformation and potential failure of the pipes. Therefore, HDPE pipes may not be suitable for applications where they can be exposed to extremely elevated temperatures or hot substances. Furthermore, HDPE pipes require specific installation techniques, such as proper fusion or mechanical joining methods. Improper installation, inadequate fusion, or faulty joints can lead to leaks, reduced performance, and premature failure of the pipes. It is crucial to follow the manufacturer's guidelines and employ skilled professionals for the installation process. These factors restrain the growth of HDPE pipes in the market.
The global infrastructure sector has witnessed significant growth, including the construction of water supply systems, wastewater management facilities, irrigation networks, and it is expected to grow faster. For instance, according to an article published by India Brand Equity Foundation in January 2023, the infrastructure sector in India is poised to grow at a CAGR of 8.2% by 2027 where HDPE pipes finds wide range of applications. Their durability, flexibility, and chemical resistance make them best suited for infrastructure projects due to which several key manufactures have increased their production capacity of HDPE pipes. The increase in demand for reliable and sustainable infrastructure presents a substantial opportunity for the HDPE pipes market. This factor is expected to boost the demand for HDPE pipes in the food and beverages industry; thus, offering new avenues for the market growth.
The HDPE pipes market is segmented by type, application, and region. By type, it is categorized into HDPE 63, HDPE 88, and HDPE 100. By application, it is segregated oil & gas pipe, agricultural irrigation pipe, water supply pipe, sewage system pipe, and others. Region-wise, the market is studied across North America, Europe, Asia-Pacific, and LAMEA. The growth drivers, restraints, and opportunities are explained in the report to better understand the market dynamics. This report further highlights the key areas of investment. In addition, it includes Porter's five forces analysis to understand the competitive scenario of the industry and role of each stakeholder. The report features strategies adopted by key market players to maintain their hold in the market. Furthermore, it highlights the competitive landscape of key players to increase their market share and sustain intense competition in the industry.
The report covers the strategies adopted by key players in the market to sustain the competitive environment and increase their market share. The key players operating in the global HDPE pipes market are Lane Enterprises, Inc, JM EAGLE, INC, BLUE DIAMOND INDUSTRIES, LLC, Mexichem S.A.B. de C.V, WL Plastics, POLY PLASTIC Group, Prinsco, Inc, United Poly Systems, RADIUS System. In addition, the market drivers, restraints, and opportunities are explained in the report.
Key Benefits For Stakeholders
- This report provides a quantitative analysis of the market segments, current trends, estimations, and dynamics of the hdpe pipes market analysis from 2022 to 2032 to identify the prevailing hdpe pipes market opportunities.
- The market research is offered along with information related to key drivers, restraints, and opportunities.
- Porter's five forces analysis highlights the potency of buyers and suppliers to enable stakeholders make profit-oriented business decisions and strengthen their supplier-buyer network.
- In-depth analysis of the hdpe pipes market segmentation assists to determine the prevailing market opportunities.
- Major countries in each region are mapped according to their revenue contribution to the global market.
- Market player positioning facilitates benchmarking and provides a clear understanding of the present position of the market players.
- The report includes the analysis of the regional as well as global hdpe pipes market trends, key players, market segments, application areas, and market growth strategies.
Key Market Segments
By Type
- HDPE 63
- HDPE 80
- HDPE 100
By Application
- Oil and Gas Pipe
- Agricultural Irrigation Pipe
- Water Supply Pipe
- Sewage System Pipe
- Others
By Region
- North America
- U.S.
- Canada
- Mexico
- Europe
- Germany
- UK
- France
- Italy
- Spain
- Rest of Europe
- Asia-Pacific
- China
- Japan
- India
- South Korea
- Austrailia
- Rest of Asia-Pacific
- LAMEA
- Brazil
- Saudi Arabia
- South Africa
- Rest of LAMEA
Key Market Players:
- Blue Diamond Industries
- JM EAGLE, INC.
- Lane Enterprises, Inc
- POLY PLASTIC Group
- Prinsco, Inc.
- RADIUS System
- SCG Chemicals Public Company Limited
- United Poly Systems
- Vectus
- WL Plastics
TABLE OF CONTENTS
CHAPTER 1: INTRODUCTION
- 1.1. Report description
- 1.2. Key market segments
- 1.3. Key benefits to the stakeholders
- 1.4. Research Methodology
- 1.4.1. Primary research
- 1.4.2. Secondary research
- 1.4.3. Analyst tools and models
CHAPTER 2: EXECUTIVE SUMMARY
- 2.1. CXO Perspective
CHAPTER 3: MARKET OVERVIEW
- 3.1. Market definition and scope
- 3.2. Key findings
- 3.2.1. Top impacting factors
- 3.2.2. Top investment pockets
- 3.3. Porter's five forces analysis
- 3.3.1. High bargaining power of suppliers
- 3.3.2. High threat of new entrants
- 3.3.3. High threat of substitutes
- 3.3.4. High intensity of rivalry
- 3.3.5. High bargaining power of buyers
- 3.4. Market dynamics
- 3.4.1. Drivers
- 3.4.1.1. Robust demand for water supply
- 3.4.1.2. Robust demand from medical device manufacturing industry
- 3.4.1. Drivers
- 3.4.2. Restraints
- 3.4.2.1. Temperature limitation and maintenance is expected to hinder the market growth
- 3.4.3. Opportunities
- 3.4.3.1. Temperature limitation and maintenance is expected to hinder the market growth
- 3.5. COVID-19 Impact Analysis on the market
- 3.6. Average Selling Price
- 3.7. Market Share Analysis
- 3.8. Brand Share Analysis
- 3.9. Pricing Analysis
- 3.10. Value Chain Analysis
- 3.11. Patent Landscape
- 3.12. Key Regulation Analysis
CHAPTER 4: HDPE PIPES MARKET, BY TYPE
- 4.1. Overview
- 4.1.1. Market size and forecast
- 4.2. HDPE 63
- 4.2.1. Key market trends, growth factors and opportunities
- 4.2.2. Market size and forecast, by region
- 4.2.3. Market share analysis by country
- 4.3. HDPE 80
- 4.3.1. Key market trends, growth factors and opportunities
- 4.3.2. Market size and forecast, by region
- 4.3.3. Market share analysis by country
- 4.4. HDPE 100
- 4.4.1. Key market trends, growth factors and opportunities
- 4.4.2. Market size and forecast, by region
- 4.4.3. Market share analysis by country
CHAPTER 5: HDPE PIPES MARKET, BY APPLICATION
- 5.1. Overview
- 5.1.1. Market size and forecast
- 5.2. Oil and Gas Pipe
- 5.2.1. Key market trends, growth factors and opportunities
- 5.2.2. Market size and forecast, by region
- 5.2.3. Market share analysis by country
- 5.3. Agricultural Irrigation Pipe
- 5.3.1. Key market trends, growth factors and opportunities
- 5.3.2. Market size and forecast, by region
- 5.3.3. Market share analysis by country
- 5.4. Water Supply Pipe
- 5.4.1. Key market trends, growth factors and opportunities
- 5.4.2. Market size and forecast, by region
- 5.4.3. Market share analysis by country
- 5.5. Sewage System Pipe
- 5.5.1. Key market trends, growth factors and opportunities
- 5.5.2. Market size and forecast, by region
- 5.5.3. Market share analysis by country
- 5.6. Others
- 5.6.1. Key market trends, growth factors and opportunities
- 5.6.2. Market size and forecast, by region
- 5.6.3. Market share analysis by country
CHAPTER 6: HDPE PIPES MARKET, BY REGION
- 6.1. Overview
- 6.1.1. Market size and forecast By Region
- 6.2. North America
- 6.2.1. Key trends and opportunities
- 6.2.2. Market size and forecast, by Type
- 6.2.3. Market size and forecast, by Application
- 6.2.4. Market size and forecast, by country
- 6.2.4.1. U.S.
- 6.2.4.1.1. Key market trends, growth factors and opportunities
- 6.2.4.1.2. Market size and forecast, by Type
- 6.2.4.1.3. Market size and forecast, by Application
- 6.2.4.2. Canada
- 6.2.4.2.1. Key market trends, growth factors and opportunities
- 6.2.4.2.2. Market size and forecast, by Type
- 6.2.4.2.3. Market size and forecast, by Application
- 6.2.4.3. Mexico
- 6.2.4.3.1. Key market trends, growth factors and opportunities
- 6.2.4.3.2. Market size and forecast, by Type
- 6.2.4.3.3. Market size and forecast, by Application
- 6.3. Europe
- 6.3.1. Key trends and opportunities
- 6.3.2. Market size and forecast, by Type
- 6.3.3. Market size and forecast, by Application
- 6.3.4. Market size and forecast, by country
- 6.3.4.1. Germany
- 6.3.4.1.1. Key market trends, growth factors and opportunities
- 6.3.4.1.2. Market size and forecast, by Type
- 6.3.4.1.3. Market size and forecast, by Application
- 6.3.4.2. UK
- 6.3.4.2.1. Key market trends, growth factors and opportunities
- 6.3.4.2.2. Market size and forecast, by Type
- 6.3.4.2.3. Market size and forecast, by Application
- 6.3.4.3. France
- 6.3.4.3.1. Key market trends, growth factors and opportunities
- 6.3.4.3.2. Market size and forecast, by Type
- 6.3.4.3.3. Market size and forecast, by Application
- 6.3.4.4. Italy
- 6.3.4.4.1. Key market trends, growth factors and opportunities
- 6.3.4.4.2. Market size and forecast, by Type
- 6.3.4.4.3. Market size and forecast, by Application
- 6.3.4.5. Spain
- 6.3.4.5.1. Key market trends, growth factors and opportunities
- 6.3.4.5.2. Market size and forecast, by Type
- 6.3.4.5.3. Market size and forecast, by Application
- 6.3.4.6. Rest of Europe
- 6.3.4.6.1. Key market trends, growth factors and opportunities
- 6.3.4.6.2. Market size and forecast, by Type
- 6.3.4.6.3. Market size and forecast, by Application
- 6.4. Asia-Pacific
- 6.4.1. Key trends and opportunities
- 6.4.2. Market size and forecast, by Type
- 6.4.3. Market size and forecast, by Application
- 6.4.4. Market size and forecast, by country
- 6.4.4.1. China
- 6.4.4.1.1. Key market trends, growth factors and opportunities
- 6.4.4.1.2. Market size and forecast, by Type
- 6.4.4.1.3. Market size and forecast, by Application
- 6.4.4.2. Japan
- 6.4.4.2.1. Key market trends, growth factors and opportunities
- 6.4.4.2.2. Market size and forecast, by Type
- 6.4.4.2.3. Market size and forecast, by Application
- 6.4.4.3. India
- 6.4.4.3.1. Key market trends, growth factors and opportunities
- 6.4.4.3.2. Market size and forecast, by Type
- 6.4.4.3.3. Market size and forecast, by Application
- 6.4.4.4. South Korea
- 6.4.4.4.1. Key market trends, growth factors and opportunities
- 6.4.4.4.2. Market size and forecast, by Type
- 6.4.4.4.3. Market size and forecast, by Application
- 6.4.4.5. Austrailia
- 6.4.4.5.1. Key market trends, growth factors and opportunities
- 6.4.4.5.2. Market size and forecast, by Type
- 6.4.4.5.3. Market size and forecast, by Application
- 6.4.4.6. Rest of Asia-Pacific
- 6.4.4.6.1. Key market trends, growth factors and opportunities
- 6.4.4.6.2. Market size and forecast, by Type
- 6.4.4.6.3. Market size and forecast, by Application
- 6.5. LAMEA
- 6.5.1. Key trends and opportunities
- 6.5.2. Market size and forecast, by Type
- 6.5.3. Market size and forecast, by Application
- 6.5.4. Market size and forecast, by country
- 6.5.4.1. Brazil
- 6.5.4.1.1. Key market trends, growth factors and opportunities
- 6.5.4.1.2. Market size and forecast, by Type
- 6.5.4.1.3. Market size and forecast, by Application
- 6.5.4.2. Saudi Arabia
- 6.5.4.2.1. Key market trends, growth factors and opportunities
- 6.5.4.2.2. Market size and forecast, by Type
- 6.5.4.2.3. Market size and forecast, by Application
- 6.5.4.3. South Africa
- 6.5.4.3.1. Key market trends, growth factors and opportunities
- 6.5.4.3.2. Market size and forecast, by Type
- 6.5.4.3.3. Market size and forecast, by Application
- 6.5.4.4. Rest of LAMEA
- 6.5.4.4.1. Key market trends, growth factors and opportunities
- 6.5.4.4.2. Market size and forecast, by Type
- 6.5.4.4.3. Market size and forecast, by Application
CHAPTER 7: COMPETITIVE LANDSCAPE
- 7.1. Introduction
- 7.2. Top winning strategies
- 7.3. Product Mapping of Top 10 Player
- 7.4. Competitive Dashboard
- 7.5. Competitive Heatmap
- 7.6. Top player positioning, 2022
CHAPTER 8: COMPANY PROFILES
- 8.1. Lane Enterprises, Inc
- 8.1.1. Company overview
- 8.1.2. Key Executives
- 8.1.3. Company snapshot
- 8.1.4. Operating business segments
- 8.1.5. Product portfolio
- 8.2. JM EAGLE, INC.
- 8.2.1. Company overview
- 8.2.2. Key Executives
- 8.2.3. Company snapshot
- 8.2.4. Operating business segments
- 8.2.5. Product portfolio
- 8.3. Blue Diamond Industries
- 8.3.1. Company overview
- 8.3.2. Key Executives
- 8.3.3. Company snapshot
- 8.3.4. Operating business segments
- 8.3.5. Product portfolio
- 8.4. Vectus
- 8.4.1. Company overview
- 8.4.2. Key Executives
- 8.4.3. Company snapshot
- 8.4.4. Operating business segments
- 8.4.5. Product portfolio
- 8.5. POLY PLASTIC Group
- 8.5.1. Company overview
- 8.5.2. Key Executives
- 8.5.3. Company snapshot
- 8.5.4. Operating business segments
- 8.5.5. Product portfolio
- 8.6. WL Plastics
- 8.6.1. Company overview
- 8.6.2. Key Executives
- 8.6.3. Company snapshot
- 8.6.4. Operating business segments
- 8.6.5. Product portfolio
- 8.7. Prinsco, Inc.
- 8.7.1. Company overview
- 8.7.2. Key Executives
- 8.7.3. Company snapshot
- 8.7.4. Operating business segments
- 8.7.5. Product portfolio
- 8.8. SCG Chemicals Public Company Limited
- 8.8.1. Company overview
- 8.8.2. Key Executives
- 8.8.3. Company snapshot
- 8.8.4. Operating business segments
- 8.8.5. Product portfolio
- 8.9. United Poly Systems
- 8.9.1. Company overview
- 8.9.2. Key Executives
- 8.9.3. Company snapshot
- 8.9.4. Operating business segments
- 8.9.5. Product portfolio
- 8.10. RADIUS System
- 8.10.1. Company overview
- 8.10.2. Key Executives
- 8.10.3. Company snapshot
- 8.10.4. Operating business segments
- 8.10.5. Product portfolio
LIST OF TABLES
- TABLE 01. GLOBAL HDPE PIPES MARKET, BY TYPE, 2022-2032 ($MILLION)
- TABLE 02. GLOBAL HDPE PIPES MARKET, BY TYPE, 2022-2032 (KILOTON)
- TABLE 03. HDPE PIPES MARKET FOR HDPE 63, BY REGION, 2022-2032 ($MILLION)
- TABLE 04. HDPE PIPES MARKET FOR HDPE 63, BY REGION, 2022-2032 (KILOTON)
- TABLE 05. HDPE PIPES MARKET FOR HDPE 80, BY REGION, 2022-2032 ($MILLION)
- TABLE 06. HDPE PIPES MARKET FOR HDPE 80, BY REGION, 2022-2032 (KILOTON)
- TABLE 07. HDPE PIPES MARKET FOR HDPE 100, BY REGION, 2022-2032 ($MILLION)
- TABLE 08. HDPE PIPES MARKET FOR HDPE 100, BY REGION, 2022-2032 (KILOTON)
- TABLE 09. GLOBAL HDPE PIPES MARKET, BY APPLICATION, 2022-2032 ($MILLION)
- TABLE 10. GLOBAL HDPE PIPES MARKET, BY APPLICATION, 2022-2032 (KILOTON)
- TABLE 11. HDPE PIPES MARKET FOR OIL AND GAS PIPE, BY REGION, 2022-2032 ($MILLION)
- TABLE 12. HDPE PIPES MARKET FOR OIL AND GAS PIPE, BY REGION, 2022-2032 (KILOTON)
- TABLE 13. HDPE PIPES MARKET FOR AGRICULTURAL IRRIGATION PIPE, BY REGION, 2022-2032 ($MILLION)
- TABLE 14. HDPE PIPES MARKET FOR AGRICULTURAL IRRIGATION PIPE, BY REGION, 2022-2032 (KILOTON)
- TABLE 15. HDPE PIPES MARKET FOR WATER SUPPLY PIPE, BY REGION, 2022-2032 ($MILLION)
- TABLE 16. HDPE PIPES MARKET FOR WATER SUPPLY PIPE, BY REGION, 2022-2032 (KILOTON)
- TABLE 17. HDPE PIPES MARKET FOR SEWAGE SYSTEM PIPE, BY REGION, 2022-2032 ($MILLION)
- TABLE 18. HDPE PIPES MARKET FOR SEWAGE SYSTEM PIPE, BY REGION, 2022-2032 (KILOTON)
- TABLE 19. HDPE PIPES MARKET FOR OTHERS, BY REGION, 2022-2032 ($MILLION)
- TABLE 20. HDPE PIPES MARKET FOR OTHERS, BY REGION, 2022-2032 (KILOTON)
- TABLE 21. HDPE PIPES MARKET, BY REGION, 2022-2032 ($MILLION)
- TABLE 22. HDPE PIPES MARKET, BY REGION, 2022-2032 (KILOTON)
- TABLE 23. NORTH AMERICA HDPE PIPES MARKET, BY TYPE, 2022-2032 ($MILLION)
- TABLE 24. NORTH AMERICA HDPE PIPES MARKET, BY TYPE, 2022-2032 (KILOTON)
- TABLE 25. NORTH AMERICA HDPE PIPES MARKET, BY APPLICATION, 2022-2032 ($MILLION)
- TABLE 26. NORTH AMERICA HDPE PIPES MARKET, BY APPLICATION, 2022-2032 (KILOTON)
- TABLE 27. NORTH AMERICA HDPE PIPES MARKET, BY COUNTRY, 2022-2032 ($MILLION)
- TABLE 28. NORTH AMERICA HDPE PIPES MARKET, BY COUNTRY, 2022-2032 (KILOTON)
- TABLE 29. U.S. HDPE PIPES MARKET, BY TYPE, 2022-2032 ($MILLION)
- TABLE 30. U.S. HDPE PIPES MARKET, BY TYPE, 2022-2032 (KILOTON)
- TABLE 31. U.S. HDPE PIPES MARKET, BY APPLICATION, 2022-2032 ($MILLION)
- TABLE 32. U.S. HDPE PIPES MARKET, BY APPLICATION, 2022-2032 (KILOTON)
- TABLE 33. CANADA HDPE PIPES MARKET, BY TYPE, 2022-2032 ($MILLION)
- TABLE 34. CANADA HDPE PIPES MARKET, BY TYPE, 2022-2032 (KILOTON)
- TABLE 35. CANADA HDPE PIPES MARKET, BY APPLICATION, 2022-2032 ($MILLION)
- TABLE 36. CANADA HDPE PIPES MARKET, BY APPLICATION, 2022-2032 (KILOTON)
- TABLE 37. MEXICO HDPE PIPES MARKET, BY TYPE, 2022-2032 ($MILLION)
- TABLE 38. MEXICO HDPE PIPES MARKET, BY TYPE, 2022-2032 (KILOTON)
- TABLE 39. MEXICO HDPE PIPES MARKET, BY APPLICATION, 2022-2032 ($MILLION)
- TABLE 40. MEXICO HDPE PIPES MARKET, BY APPLICATION, 2022-2032 (KILOTON)
- TABLE 41. EUROPE HDPE PIPES MARKET, BY TYPE, 2022-2032 ($MILLION)
- TABLE 42. EUROPE HDPE PIPES MARKET, BY TYPE, 2022-2032 (KILOTON)
- TABLE 43. EUROPE HDPE PIPES MARKET, BY APPLICATION, 2022-2032 ($MILLION)
- TABLE 44. EUROPE HDPE PIPES MARKET, BY APPLICATION, 2022-2032 (KILOTON)
- TABLE 45. EUROPE HDPE PIPES MARKET, BY COUNTRY, 2022-2032 ($MILLION)
- TABLE 46. EUROPE HDPE PIPES MARKET, BY COUNTRY, 2022-2032 (KILOTON)
- TABLE 47. GERMANY HDPE PIPES MARKET, BY TYPE, 2022-2032 ($MILLION)
- TABLE 48. GERMANY HDPE PIPES MARKET, BY TYPE, 2022-2032 (KILOTON)
- TABLE 49. GERMANY HDPE PIPES MARKET, BY APPLICATION, 2022-2032 ($MILLION)
- TABLE 50. GERMANY HDPE PIPES MARKET, BY APPLICATION, 2022-2032 (KILOTON)
- TABLE 51. UK HDPE PIPES MARKET, BY TYPE, 2022-2032 ($MILLION)
- TABLE 52. UK HDPE PIPES MARKET, BY TYPE, 2022-2032 (KILOTON)
- TABLE 53. UK HDPE PIPES MARKET, BY APPLICATION, 2022-2032 ($MILLION)
- TABLE 54. UK HDPE PIPES MARKET, BY APPLICATION, 2022-2032 (KILOTON)
- TABLE 55. FRANCE HDPE PIPES MARKET, BY TYPE, 2022-2032 ($MILLION)
- TABLE 56. FRANCE HDPE PIPES MARKET, BY TYPE, 2022-2032 (KILOTON)
- TABLE 57. FRANCE HDPE PIPES MARKET, BY APPLICATION, 2022-2032 ($MILLION)
- TABLE 58. FRANCE HDPE PIPES MARKET, BY APPLICATION, 2022-2032 (KILOTON)
- TABLE 59. ITALY HDPE PIPES MARKET, BY TYPE, 2022-2032 ($MILLION)
- TABLE 60. ITALY HDPE PIPES MARKET, BY TYPE, 2022-2032 (KILOTON)
- TABLE 61. ITALY HDPE PIPES MARKET, BY APPLICATION, 2022-2032 ($MILLION)
- TABLE 62. ITALY HDPE PIPES MARKET, BY APPLICATION, 2022-2032 (KILOTON)
- TABLE 63. SPAIN HDPE PIPES MARKET, BY TYPE, 2022-2032 ($MILLION)
- TABLE 64. SPAIN HDPE PIPES MARKET, BY TYPE, 2022-2032 (KILOTON)
- TABLE 65. SPAIN HDPE PIPES MARKET, BY APPLICATION, 2022-2032 ($MILLION)
- TABLE 66. SPAIN HDPE PIPES MARKET, BY APPLICATION, 2022-2032 (KILOTON)
- TABLE 67. REST OF EUROPE HDPE PIPES MARKET, BY TYPE, 2022-2032 ($MILLION)
- TABLE 68. REST OF EUROPE HDPE PIPES MARKET, BY TYPE, 2022-2032 (KILOTON)
- TABLE 69. REST OF EUROPE HDPE PIPES MARKET, BY APPLICATION, 2022-2032 ($MILLION)
- TABLE 70. REST OF EUROPE HDPE PIPES MARKET, BY APPLICATION, 2022-2032 (KILOTON)
- TABLE 71. ASIA-PACIFIC HDPE PIPES MARKET, BY TYPE, 2022-2032 ($MILLION)
- TABLE 72. ASIA-PACIFIC HDPE PIPES MARKET, BY TYPE, 2022-2032 (KILOTON)
- TABLE 73. ASIA-PACIFIC HDPE PIPES MARKET, BY APPLICATION, 2022-2032 ($MILLION)
- TABLE 74. ASIA-PACIFIC HDPE PIPES MARKET, BY APPLICATION, 2022-2032 (KILOTON)
- TABLE 75. ASIA-PACIFIC HDPE PIPES MARKET, BY COUNTRY, 2022-2032 ($MILLION)
- TABLE 76. ASIA-PACIFIC HDPE PIPES MARKET, BY COUNTRY, 2022-2032 (KILOTON)
- TABLE 77. CHINA HDPE PIPES MARKET, BY TYPE, 2022-2032 ($MILLION)
- TABLE 78. CHINA HDPE PIPES MARKET, BY TYPE, 2022-2032 (KILOTON)
- TABLE 79. CHINA HDPE PIPES MARKET, BY APPLICATION, 2022-2032 ($MILLION)
- TABLE 80. CHINA HDPE PIPES MARKET, BY APPLICATION, 2022-2032 (KILOTON)
- TABLE 81. JAPAN HDPE PIPES MARKET, BY TYPE, 2022-2032 ($MILLION)
- TABLE 82. JAPAN HDPE PIPES MARKET, BY TYPE, 2022-2032 (KILOTON)
- TABLE 83. JAPAN HDPE PIPES MARKET, BY APPLICATION, 2022-2032 ($MILLION)
- TABLE 84. JAPAN HDPE PIPES MARKET, BY APPLICATION, 2022-2032 (KILOTON)
- TABLE 85. INDIA HDPE PIPES MARKET, BY TYPE, 2022-2032 ($MILLION)
- TABLE 86. INDIA HDPE PIPES MARKET, BY TYPE, 2022-2032 (KILOTON)
- TABLE 87. INDIA HDPE PIPES MARKET, BY APPLICATION, 2022-2032 ($MILLION)
- TABLE 88. INDIA HDPE PIPES MARKET, BY APPLICATION, 2022-2032 (KILOTON)
- TABLE 89. SOUTH KOREA HDPE PIPES MARKET, BY TYPE, 2022-2032 ($MILLION)
- TABLE 90. SOUTH KOREA HDPE PIPES MARKET, BY TYPE, 2022-2032 (KILOTON)
- TABLE 91. SOUTH KOREA HDPE PIPES MARKET, BY APPLICATION, 2022-2032 ($MILLION)
- TABLE 92. SOUTH KOREA HDPE PIPES MARKET, BY APPLICATION, 2022-2032 (KILOTON)
- TABLE 93. AUSTRAILIA HDPE PIPES MARKET, BY TYPE, 2022-2032 ($MILLION)
- TABLE 94. AUSTRAILIA HDPE PIPES MARKET, BY TYPE, 2022-2032 (KILOTON)
- TABLE 95. AUSTRAILIA HDPE PIPES MARKET, BY APPLICATION, 2022-2032 ($MILLION)
- TABLE 96. AUSTRAILIA HDPE PIPES MARKET, BY APPLICATION, 2022-2032 (KILOTON)
- TABLE 97. REST OF ASIA-PACIFIC HDPE PIPES MARKET, BY TYPE, 2022-2032 ($MILLION)
- TABLE 98. REST OF ASIA-PACIFIC HDPE PIPES MARKET, BY TYPE, 2022-2032 (KILOTON)
- TABLE 99. REST OF ASIA-PACIFIC HDPE PIPES MARKET, BY APPLICATION, 2022-2032 ($MILLION)
- TABLE 100. REST OF ASIA-PACIFIC HDPE PIPES MARKET, BY APPLICATION, 2022-2032 (KILOTON)
- TABLE 101. LAMEA HDPE PIPES MARKET, BY TYPE, 2022-2032 ($MILLION)
- TABLE 102. LAMEA HDPE PIPES MARKET, BY TYPE, 2022-2032 (KILOTON)
- TABLE 103. LAMEA HDPE PIPES MARKET, BY APPLICATION, 2022-2032 ($MILLION)
- TABLE 104. LAMEA HDPE PIPES MARKET, BY APPLICATION, 2022-2032 (KILOTON)
- TABLE 105. LAMEA HDPE PIPES MARKET, BY COUNTRY, 2022-2032 ($MILLION)
- TABLE 106. LAMEA HDPE PIPES MARKET, BY COUNTRY, 2022-2032 (KILOTON)
- TABLE 107. BRAZIL HDPE PIPES MARKET, BY TYPE, 2022-2032 ($MILLION)
- TABLE 108. BRAZIL HDPE PIPES MARKET, BY TYPE, 2022-2032 (KILOTON)
- TABLE 109. BRAZIL HDPE PIPES MARKET, BY APPLICATION, 2022-2032 ($MILLION)
- TABLE 110. BRAZIL HDPE PIPES MARKET, BY APPLICATION, 2022-2032 (KILOTON)
- TABLE 111. SAUDI ARABIA HDPE PIPES MARKET, BY TYPE, 2022-2032 ($MILLION)
- TABLE 112. SAUDI ARABIA HDPE PIPES MARKET, BY TYPE, 2022-2032 (KILOTON)
- TABLE 113. SAUDI ARABIA HDPE PIPES MARKET, BY APPLICATION, 2022-2032 ($MILLION)
- TABLE 114. SAUDI ARABIA HDPE PIPES MARKET, BY APPLICATION, 2022-2032 (KILOTON)
- TABLE 115. SOUTH AFRICA HDPE PIPES MARKET, BY TYPE, 2022-2032 ($MILLION)
- TABLE 116. SOUTH AFRICA HDPE PIPES MARKET, BY TYPE, 2022-2032 (KILOTON)
- TABLE 117. SOUTH AFRICA HDPE PIPES MARKET, BY APPLICATION, 2022-2032 ($MILLION)
- TABLE 118. SOUTH AFRICA HDPE PIPES MARKET, BY APPLICATION, 2022-2032 (KILOTON)
- TABLE 119. REST OF LAMEA HDPE PIPES MARKET, BY TYPE, 2022-2032 ($MILLION)
- TABLE 120. REST OF LAMEA HDPE PIPES MARKET, BY TYPE, 2022-2032 (KILOTON)
- TABLE 121. REST OF LAMEA HDPE PIPES MARKET, BY APPLICATION, 2022-2032 ($MILLION)
- TABLE 122. REST OF LAMEA HDPE PIPES MARKET, BY APPLICATION, 2022-2032 (KILOTON)
- TABLE 123. LANE ENTERPRISES, INC: KEY EXECUTIVES
- TABLE 124. LANE ENTERPRISES, INC: COMPANY SNAPSHOT
- TABLE 125. LANE ENTERPRISES, INC: PRODUCT SEGMENTS
- TABLE 126. LANE ENTERPRISES, INC: PRODUCT PORTFOLIO
- TABLE 127. JM EAGLE, INC.: KEY EXECUTIVES
- TABLE 128. JM EAGLE, INC.: COMPANY SNAPSHOT
- TABLE 129. JM EAGLE, INC.: PRODUCT SEGMENTS
- TABLE 130. JM EAGLE, INC.: PRODUCT PORTFOLIO
- TABLE 131. BLUE DIAMOND INDUSTRIES: KEY EXECUTIVES
- TABLE 132. BLUE DIAMOND INDUSTRIES: COMPANY SNAPSHOT
- TABLE 133. BLUE DIAMOND INDUSTRIES: PRODUCT SEGMENTS
- TABLE 134. BLUE DIAMOND INDUSTRIES: PRODUCT PORTFOLIO
- TABLE 135. VECTUS: KEY EXECUTIVES
- TABLE 136. VECTUS: COMPANY SNAPSHOT
- TABLE 137. VECTUS: PRODUCT SEGMENTS
- TABLE 138. VECTUS: PRODUCT PORTFOLIO
- TABLE 139. POLY PLASTIC GROUP: KEY EXECUTIVES
- TABLE 140. POLY PLASTIC GROUP: COMPANY SNAPSHOT
- TABLE 141. POLY PLASTIC GROUP: PRODUCT SEGMENTS
- TABLE 142. POLY PLASTIC GROUP: PRODUCT PORTFOLIO
- TABLE 143. WL PLASTICS: KEY EXECUTIVES
- TABLE 144. WL PLASTICS: COMPANY SNAPSHOT
- TABLE 145. WL PLASTICS: PRODUCT SEGMENTS
- TABLE 146. WL PLASTICS: PRODUCT PORTFOLIO
- TABLE 147. PRINSCO, INC.: KEY EXECUTIVES
- TABLE 148. PRINSCO, INC.: COMPANY SNAPSHOT
- TABLE 149. PRINSCO, INC.: PRODUCT SEGMENTS
- TABLE 150. PRINSCO, INC.: PRODUCT PORTFOLIO
- TABLE 151. SCG CHEMICALS PUBLIC COMPANY LIMITED: KEY EXECUTIVES
- TABLE 152. SCG CHEMICALS PUBLIC COMPANY LIMITED: COMPANY SNAPSHOT
- TABLE 153. SCG CHEMICALS PUBLIC COMPANY LIMITED: PRODUCT SEGMENTS
- TABLE 154. SCG CHEMICALS PUBLIC COMPANY LIMITED: PRODUCT PORTFOLIO
- TABLE 155. UNITED POLY SYSTEMS: KEY EXECUTIVES
- TABLE 156. UNITED POLY SYSTEMS: COMPANY SNAPSHOT
- TABLE 157. UNITED POLY SYSTEMS: PRODUCT SEGMENTS
- TABLE 158. UNITED POLY SYSTEMS: PRODUCT PORTFOLIO
- TABLE 159. RADIUS SYSTEM: KEY EXECUTIVES
- TABLE 160. RADIUS SYSTEM: COMPANY SNAPSHOT
- TABLE 161. RADIUS SYSTEM: PRODUCT SEGMENTS
- TABLE 162. RADIUS SYSTEM: PRODUCT PORTFOLIO
LIST OF FIGURES
- FIGURE 01. HDPE PIPES MARKET, 2022-2032
- FIGURE 02. SEGMENTATION OF HDPE PIPES MARKET, 2022-2032
- FIGURE 03. TOP INVESTMENT POCKETS IN HDPE PIPES MARKET (2023-2032)
- FIGURE 04. HIGH BARGAINING POWER OF SUPPLIERS
- FIGURE 05. HIGH THREAT OF NEW ENTRANTS
- FIGURE 06. HIGH THREAT OF SUBSTITUTES
- FIGURE 07. HIGH INTENSITY OF RIVALRY
- FIGURE 08. HIGH BARGAINING POWER OF BUYERS
- FIGURE 09. DRIVERS, RESTRAINTS AND OPPORTUNITIES: GLOBALHDPE PIPES MARKET
- FIGURE 10. U.S. AVERAGE SELLING PRICE FOR TYPE
- FIGURE 11. AVERAGE SELLING PRICE
- FIGURE 12. AVERAGE SELLING PRICE FOR TYPE
- FIGURE 13. PRICING ANALYSIS: HDPE PIPES MARKET 2022 AND 2032
- FIGURE 14. PATENT ANALYSIS BY COMPANY
- FIGURE 15. PATENT ANALYSIS BY COUNTRY
- FIGURE 16. IMPACT OF KEY REGULATION: HDPE PIPES MARKET
- FIGURE 16. HDPE PIPES MARKET, BY TYPE, 2022(%)
- FIGURE 17. COMPARATIVE SHARE ANALYSIS OF HDPE PIPES MARKET FOR HDPE 63, BY COUNTRY 2022 AND 2032(%)
- FIGURE 18. COMPARATIVE SHARE ANALYSIS OF HDPE PIPES MARKET FOR HDPE 80, BY COUNTRY 2022 AND 2032(%)
- FIGURE 19. COMPARATIVE SHARE ANALYSIS OF HDPE PIPES MARKET FOR HDPE 100, BY COUNTRY 2022 AND 2032(%)
- FIGURE 20. HDPE PIPES MARKET, BY APPLICATION, 2022(%)
- FIGURE 21. COMPARATIVE SHARE ANALYSIS OF HDPE PIPES MARKET FOR OIL AND GAS PIPE, BY COUNTRY 2022 AND 2032(%)
- FIGURE 22. COMPARATIVE SHARE ANALYSIS OF HDPE PIPES MARKET FOR AGRICULTURAL IRRIGATION PIPE, BY COUNTRY 2022 AND 2032(%)
- FIGURE 23. COMPARATIVE SHARE ANALYSIS OF HDPE PIPES MARKET FOR WATER SUPPLY PIPE, BY COUNTRY 2022 AND 2032(%)
- FIGURE 24. COMPARATIVE SHARE ANALYSIS OF HDPE PIPES MARKET FOR SEWAGE SYSTEM PIPE, BY COUNTRY 2022 AND 2032(%)
- FIGURE 25. COMPARATIVE SHARE ANALYSIS OF HDPE PIPES MARKET FOR OTHERS, BY COUNTRY 2022 AND 2032(%)
- FIGURE 26. HDPE PIPES MARKET BY REGION, 2022
- FIGURE 27. U.S. HDPE PIPES MARKET, 2022-2032 ($MILLION)
- FIGURE 28. CANADA HDPE PIPES MARKET, 2022-2032 ($MILLION)
- FIGURE 29. MEXICO HDPE PIPES MARKET, 2022-2032 ($MILLION)
- FIGURE 30. GERMANY HDPE PIPES MARKET, 2022-2032 ($MILLION)
- FIGURE 31. UK HDPE PIPES MARKET, 2022-2032 ($MILLION)
- FIGURE 32. FRANCE HDPE PIPES MARKET, 2022-2032 ($MILLION)
- FIGURE 33. ITALY HDPE PIPES MARKET, 2022-2032 ($MILLION)
- FIGURE 34. SPAIN HDPE PIPES MARKET, 2022-2032 ($MILLION)
- FIGURE 35. REST OF EUROPE HDPE PIPES MARKET, 2022-2032 ($MILLION)
- FIGURE 36. CHINA HDPE PIPES MARKET, 2022-2032 ($MILLION)
- FIGURE 37. JAPAN HDPE PIPES MARKET, 2022-2032 ($MILLION)
- FIGURE 38. INDIA HDPE PIPES MARKET, 2022-2032 ($MILLION)
- FIGURE 39. SOUTH KOREA HDPE PIPES MARKET, 2022-2032 ($MILLION)
- FIGURE 40. AUSTRAILIA HDPE PIPES MARKET, 2022-2032 ($MILLION)
- FIGURE 41. REST OF ASIA-PACIFIC HDPE PIPES MARKET, 2022-2032 ($MILLION)
- FIGURE 42. BRAZIL HDPE PIPES MARKET, 2022-2032 ($MILLION)
- FIGURE 43. SAUDI ARABIA HDPE PIPES MARKET, 2022-2032 ($MILLION)
- FIGURE 44. SOUTH AFRICA HDPE PIPES MARKET, 2022-2032 ($MILLION)
- FIGURE 45. REST OF LAMEA HDPE PIPES MARKET, 2022-2032 ($MILLION)
- FIGURE 46. TOP WINNING STRATEGIES, BY YEAR
- FIGURE 47. TOP WINNING STRATEGIES, BY DEVELOPMENT
- FIGURE 48. TOP WINNING STRATEGIES, BY COMPANY
- FIGURE 49. PRODUCT MAPPING OF TOP 10 PLAYERS
- FIGURE 50. COMPETITIVE DASHBOARD
- FIGURE 51. COMPETITIVE HEATMAP: HDPE PIPES MARKET
- FIGURE 52. TOP PLAYER POSITIONING, 2022
 2025-2029年全球HDPE管道市场
 HDPE管道市场报告(按类型(PE 63、PE 80、PE 100)、应用(石油和天然气管道、农业灌溉管道、供水管道、污水系统管道等)和地区)2025-2033年
 HDPE 管道市场规模、份额和成长分析(按类型、销售管道、应用和地区)- 产业预测 2025-2032
 全球 HDPE 管道市场规模研究,按类型(PE 63、PE 80、PE 100)、应用(石油和天然气、灌溉、水和废水)和 2022-2032 年区域预测
 HDPE 管道的全球市场(~2029 年):牌号(Pe 63、Pe 80、Pe 100)、直径(小于 50 毫米、50-250 毫米、大于 250 毫米)、应用(灌溉系统、污水和排水系统、化学)按处理、熔接等)、最终用户和地区
![HDPE 管道市场:趋势、预测、竞争分析 [2024-2030]](/sample/img/cover/42/default_cover_5.png) HDPE 管道市场:趋势、预测、竞争分析 [2024-2030]
HDPE 管道市场:趋势、预测、竞争分析 [2024-2030] PPR和HDPE的全球市场2024-2028HDPE 管道的全球市场(2023 年版):按等级类型、直径类型、用途、地区和国家分類的分析、驱动因素、促进因素和预测(-2029 年)
 全球HDPE管市场研究报告 - 行业分析、规模、份额、增长、趋势及2023年至2030年预测