


 |
市场调查报告书
商品编码
1344334
燃料电池工厂平衡市场:按材料、按组件划分:2023-2032 年全球机会分析和产业预测Fuel Cell Balance of Plant Market By Material, By Component : Global Opportunity Analysis and Industry Forecast, 2023-2032 |
||||||
根据Allied Market Research发布的研究报告《燃料电池设备平衡(BOP)市场》,2022年燃料电池设备平衡(BOP)市场规模为19亿美元,2032年将达到19亿美元。139 亿美元,预计2023 年至2032 年复合年增长率为22.2%。
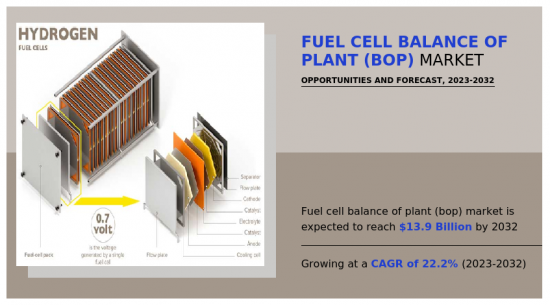
燃料电池是利用燃料(一般是氢等)的化学能来清洁、有效率地发电的装置。 燃料电池工厂平衡(BOP)是燃料电池最佳运作的重要组成部分。 燃料电池工厂平衡燃料重整器、热交换器、化学反应器、风扇/鼓风机、需要燃烧器的燃料处理系统、需要涡轮机、压缩机、热交换器、马达和风扇的空气管理系统。它包括各种组件,例如功率调节系统由系统、转换器、逆变器、电池和马达组成。 由于汽车、军事、基础设施和工业等各种应用对燃料电池的需求不断增加,全球燃料电池工厂(BOP)市场预计将大幅扩张。
BOP(电站平衡)中的电力电子设备和转换器在促进高效电力转换和管理方面发挥关键作用。 其主要功能是将燃料电池堆产生的直流电(DC)转换为各种应用所需的交流电(AC)。 这种有效的转换过程有助于最大限度地减少能量损失并优化发电的利用。 燃料电池工厂平衡 (BOP) 组件在促进该技术的环境效益方面发挥关键作用。 燃料电池透过电化学反应发电,仅排放水蒸气和极少量的污染物。 采用精心设计的防喷器系统可透过高效的空气过滤、废气处理和降噪措施进一步提高环境效益。
将 BOP 组件纳入燃料电池系统会增加整体系统成本。 电力电子装置、冷却系统和控制系统等组件的製造和整合成本昂贵。 因此,与这些组件相关的额外成本可能会使燃料电池系统比传统发电技术更昂贵。 这一成本因素可能会限制燃料电池系统的广泛采用。 将 BOP 组件与燃料电池堆和其他系统元件整合可能会带来各种挑战。 确保不同组件、材料和子系统之间的兼容性对于确保适当的功能、耐用性和性能至关重要。 然而,整合这些组件的过程可能会导致设计复杂性增加、开发时间更长和成本更高。
燃料电池 BOP 组件可与太阳能和风能等再生能源集成,以创建混合发电系统。 这种整合可实现更永续、更有效率的能源产生和储存解决方案。 BOP 组件可在管理这些混合系统中的电力输入、储存和分配方面发挥作用,从而提供稳定性和电网相容性。 有针对不同燃料电池应用和操作条件优化 BOP 的机会。 根据功率输出、工作温度范围和响应时间等特定要求自订 BOP 组件和系统,可提高系统性能并使燃料电池系统更适用于更广泛的应用。
目录
第一章简介
第 2 章执行摘要
第三章市场概述
- 市场定义和范围
- 主要发现
- 影响因素
- 主要投资机会
- 波特五力分析
- 市场动态
- 促进因素
- 高效率的电力转换
- 环境效益
- 安全与控制系统
- 抑制因素
- 系统复杂性
- 燃料电池成本增加
- 相容性与整合挑战
- 机会
- 降低成本
- 系统最佳化和灵活性
- 与再生能源整合
- 促进因素
- 新冠肺炎 (COVID-19) 造成的市场影响分析
- 价值链分析
- 专利情况
- 监理指南
第 4 章燃料电池工厂 (BOP) 市场平衡:按材料分类
- 结构塑料
- 弹性体
- 冷却液
- 组装援助
- 金属
- 其他
第 5 章燃料电池工厂 (BOP) 市场平衡:按组成部分
- 电源
- 水循环
- 氢气处理
- 冷却
- 热稳定剂
- 其他
第 6 章燃料电池工厂 (BOP) 市场平衡:按地区划分
- 北美
- 美国
- 加拿大
- 墨西哥
- 欧洲
- 德国
- 英国
- 法国
- 义大利
- 西班牙
- 欧洲其他地区
- 亚太地区
- 中国
- 日本
- 印度
- 韩国
- 澳大利亚
- 其他亚太地区
- 拉丁美洲/中东/非洲
- 巴西
- 沙乌地阿拉伯
- 南非
- 其他领域
第七章竞争态势
- 简介
- 关键成功策略
- 10家主要公司的产品图谱
- 竞争对手仪表板
- 竞争热图
- 2022 年主要公司的定位
第八章公司简介
- INN Balance
- Cummins, Inc.
- Hydrogenics Corporation
- Ballard Power Systems
- Bloom Energy
- SFC Energy AG
- Doosan Fuel Cell Co., Ltd.
- HORIBA FuelCon GmbH
- Elcogen AS
- Dana Limited
According to a new report published by Allied Market Research, titled, "Fuel Cell Balance of Plant (BOP) Market," The fuel cell balance of plant (BOP) market was valued at $1.9 billion in 2022, and is estimated to reach $13.9 billion by 2032, growing at a CAGR of 22.2% from 2023 to 2032.
A fuel cell is a device that utilizes the chemical energy of a fuel, typically hydrogen or others to cleanly and efficiently produce electricity. Fuel Cell Balance of Plant (BOP) are the vital components for the optimal functioning of the fuel cell. Fuel cell balance of plant includes various components such as fuel processing system that requires a fuel reformer, heat exchangers, chemical reactors, fans/blowers, and burner; air management system that requires a turbine, compressor, heat exchangers, motor, and fan; and power conditioning system that comprises a converter, inverter, batteries, and motor. The global fuel cell balance of plant (BOP) market is expected to expand at a significant pace owing to an increase in the demand for fuel cells in various applications such as automotive, military, infrastructure, and industrial.
The power electronics and converters found in the BOP (Balance of Plant) play a crucial role in facilitating efficient power conversion and management. Their main function is to transform the direct current (DC) generated by the fuel cell stack into the alternating current (AC) needed for different applications. This effective conversion process helps to minimize energy losses and optimize the utilization of the electricity produced. The components of the Balance of Plant (BOP) in fuel cells play a significant role in contributing to the environmental advantages of this technology. Fuel cells generate electricity via electrochemical reactions, emitting only water vapor and minimal pollutants. By incorporating well-designed BOP systems, environmental benefits can be further enhanced through efficient air filtration, exhaust gas treatment, and noise reduction measures.
The inclusion of BOP components in a fuel cell system contributes to its overall cost. Components like power electronics, cooling systems, and control systems can be costly to manufacture and integrate. As a result, the additional expenses associated with these components can make fuel cell systems more expensive compared to conventional power generation technologies. This cost factor can pose a limitation to the widespread adoption of fuel cell systems. The integration of BOP components with the fuel cell stack and other system elements can pose various challenges. Ensuring compatibility between different components, materials, and subsystems is crucial to guarantee proper functionality, durability, and performance. However, the process of integrating these components can lead to increased design complexity, longer development times, and higher costs.
Fuel cell BOP components can be integrated with renewable energy sources, such as solar or wind, to create hybrid power systems. This integration allows for a more sustainable and efficient energy generation and storage solution. BOP components can play a role in managing the power input, storage, and distribution in these hybrid systems, providing stability and grid compatibility. Opportunities exist to optimize the BOP for different fuel cell applications and operating conditions. Tailoring the BOP components and systems to specific requirements such as power output, operating temperature range, and response time, can enhance system performance and enable fuel cell systems to be applied in a wider range of applications.
The fuel cell balance of plants (BOP) market scope covers segmentation and is analyzed on the basis of material, component, and region. The report highlights the details of various materials used in fuel cell balance of plants (BOP) including structural plastics, elastomers, coolants, assembly aids, metals, and others. In addition, the component covered in the study includes the fuel cell balance of plants (BOP) market is segmented into power supply, water circulation, hydrogen processing, cooling, heat stabilizers, and others. Moreover, the report analyzes the current market trends of fuel cell balance of plants (BOP) across different regions such as North America, Europe, Asia-Pacific, and LAMEA (Latin America, the Middle East, and Africa), and suggests future growth opportunities. Assembly aids in the fuel cell balance of plants and refers to various materials, tools, and techniques used to facilitate the assembly and manufacturing processes of fuel cell systems. These aids help improve efficiency, accuracy, and reliability during the construction and integration of fuel cell components and systems. Some of the assembly aids such as adhesives & sealants, fixtures & jigs, fasteners, alignment tools, and handling & installation tools are made from different materials. Alignment tools are used to ensure accurate alignment of components during assembly. This is particularly important for fuel cell stacks, where proper alignment of individual cells is critical for optimal performance.
The key players operating profiled in the fuel cell balance of plants (BOP) industry are INN Balance, Cummins Inc., Hydrogenics Corporations, Ballard Power Systems, Bloom Energy, SFC Energy AG, Doosan Fuel Cell America, Inc., HORIBA Group, Elcogen AS, and Dana Limited. These players have been adopting various strategies to gain a higher share or to retain leading positions in the market.
The growth drivers, restraints, and opportunities are explained in the report to better understand the market dynamics. This report further highlights the key areas of investment. In addition, it includes Porter's five forces analysis to understand the competitive scenario of the industry and the role of each stakeholder. The report features strategies adopted by key market players to maintain their foothold in the market. Furthermore, it highlights the competitive landscape of key players to increase their market share and sustain the intense competition in the industry
Key Benefits For Stakeholders
- This report provides a quantitative analysis of the market segments, current trends, estimations, and dynamics of the fuel cell balance of plant (BOP) market analysis from 2022 to 2032 to identify the prevailing fuel cell balance of plant (BOP) market opportunities.
- The market research is offered along with information related to key drivers, restraints, and opportunities.
- Porter's five forces analysis highlights the potency of buyers and suppliers to enable stakeholders make profit-oriented business decisions and strengthen their supplier-buyer network.
- In-depth analysis of the fuel cell balance of plant (BOP) market segmentation assists to determine the prevailing market opportunities.
- Major countries in each region are mapped according to their revenue contribution to the global market.
- Market player positioning facilitates benchmarking and provides a clear understanding of the present position of the market players.
- The report includes the analysis of the regional as well as global fuel cell balance of plant (BOP) market trends, key players, market segments, application areas, and market growth strategies.
Key Market Segments
By Material
- Structural Plastics
- Elastomers
- Coolants
- Assembly Aids
- Metals
- Others
By Component
- Power Supply
- Water Circulation
- Hydrogen Processing
- Cooling
- Heat Stabilizers
- Others
By Region
- North America
- U.S.
- Canada
- Mexico
- Europe
- Germany
- UK
- France
- Italy
- Spain
- Rest of Europe
- Asia-Pacific
- China
- Japan
- India
- South Korea
- Australia
- Rest of Asia-Pacific
- LAMEA
- Brazil
- Saudi Arabia
- South Africa
- Rest of LAMEA
Key Market Players:
- Ballard Power Systems
- Bloom Energy
- Cummins, Inc.
- Dana Limited
- Doosan Fuel Cell Co., Ltd.
- Elcogen AS
- HORIBA FuelCon GmbH
- Hydrogenics Corporation
- INN Balance
- SFC Energy AG
TABLE OF CONTENTS
CHAPTER 1: INTRODUCTION
- 1.1. Report description
- 1.2. Key market segments
- 1.3. Key benefits to the stakeholders
- 1.4. Research Methodology
- 1.4.1. Primary research
- 1.4.2. Secondary research
- 1.4.3. Analyst tools and models
CHAPTER 2: EXECUTIVE SUMMARY
- 2.1. CXO Perspective
CHAPTER 3: MARKET OVERVIEW
- 3.1. Market definition and scope
- 3.2. Key findings
- 3.2.1. Top impacting factors
- 3.2.2. Top investment pockets
- 3.3. Porter's five forces analysis
- 3.3.1. Low bargaining power of suppliers
- 3.3.2. Low threat of new entrants
- 3.3.3. Low threat of substitutes
- 3.3.4. Low intensity of rivalry
- 3.3.5. Low bargaining power of buyers
- 3.4. Market dynamics
- 3.4.1. Drivers
- 3.4.1.1. Efficient Power Conversion
- 3.4.1.2. Environmental Benefits
- 3.4.1.3. Safety and Control Systems
- 3.4.1. Drivers
- 3.4.2. Restraints
- 3.4.2.1. Complexity of the system
- 3.4.2.2. Cost addition to fuel cells
- 3.4.2.3. Compatibility and integration challenges
- 3.4.3. Opportunities
- 3.4.3.1. Cost reduction
- 3.4.3.2. System optimization and flexibility
- 3.4.3.3. Integration with renewable energy sources
- 3.5. COVID-19 Impact Analysis on the market
- 3.6. Value Chain Analysis
- 3.7. Patent Landscape
- 3.8. Regulatory Guidelines
CHAPTER 4: FUEL CELL BALANCE OF PLANT (BOP) MARKET, BY MATERIAL
- 4.1. Overview
- 4.1.1. Market size and forecast
- 4.2. Structural Plastics
- 4.2.1. Key market trends, growth factors and opportunities
- 4.2.2. Market size and forecast, by region
- 4.2.3. Market share analysis by country
- 4.3. Elastomers
- 4.3.1. Key market trends, growth factors and opportunities
- 4.3.2. Market size and forecast, by region
- 4.3.3. Market share analysis by country
- 4.4. Coolants
- 4.4.1. Key market trends, growth factors and opportunities
- 4.4.2. Market size and forecast, by region
- 4.4.3. Market share analysis by country
- 4.5. Assembly Aids
- 4.5.1. Key market trends, growth factors and opportunities
- 4.5.2. Market size and forecast, by region
- 4.5.3. Market share analysis by country
- 4.6. Metals
- 4.6.1. Key market trends, growth factors and opportunities
- 4.6.2. Market size and forecast, by region
- 4.6.3. Market share analysis by country
- 4.7. Others
- 4.7.1. Key market trends, growth factors and opportunities
- 4.7.2. Market size and forecast, by region
- 4.7.3. Market share analysis by country
CHAPTER 5: FUEL CELL BALANCE OF PLANT (BOP) MARKET, BY COMPONENT
- 5.1. Overview
- 5.1.1. Market size and forecast
- 5.2. Power Supply
- 5.2.1. Key market trends, growth factors and opportunities
- 5.2.2. Market size and forecast, by region
- 5.2.3. Market share analysis by country
- 5.3. Water Circulation
- 5.3.1. Key market trends, growth factors and opportunities
- 5.3.2. Market size and forecast, by region
- 5.3.3. Market share analysis by country
- 5.4. Hydrogen Processing
- 5.4.1. Key market trends, growth factors and opportunities
- 5.4.2. Market size and forecast, by region
- 5.4.3. Market share analysis by country
- 5.5. Cooling
- 5.5.1. Key market trends, growth factors and opportunities
- 5.5.2. Market size and forecast, by region
- 5.5.3. Market share analysis by country
- 5.6. Heat Stabilizers
- 5.6.1. Key market trends, growth factors and opportunities
- 5.6.2. Market size and forecast, by region
- 5.6.3. Market share analysis by country
- 5.7. Others
- 5.7.1. Key market trends, growth factors and opportunities
- 5.7.2. Market size and forecast, by region
- 5.7.3. Market share analysis by country
CHAPTER 6: FUEL CELL BALANCE OF PLANT (BOP) MARKET, BY REGION
- 6.1. Overview
- 6.1.1. Market size and forecast By Region
- 6.2. North America
- 6.2.1. Key trends and opportunities
- 6.2.2. Market size and forecast, by Material
- 6.2.3. Market size and forecast, by Component
- 6.2.4. Market size and forecast, by country
- 6.2.4.1. U.S.
- 6.2.4.1.1. Key market trends, growth factors and opportunities
- 6.2.4.1.2. Market size and forecast, by Material
- 6.2.4.1.3. Market size and forecast, by Component
- 6.2.4.2. Canada
- 6.2.4.2.1. Key market trends, growth factors and opportunities
- 6.2.4.2.2. Market size and forecast, by Material
- 6.2.4.2.3. Market size and forecast, by Component
- 6.2.4.3. Mexico
- 6.2.4.3.1. Key market trends, growth factors and opportunities
- 6.2.4.3.2. Market size and forecast, by Material
- 6.2.4.3.3. Market size and forecast, by Component
- 6.3. Europe
- 6.3.1. Key trends and opportunities
- 6.3.2. Market size and forecast, by Material
- 6.3.3. Market size and forecast, by Component
- 6.3.4. Market size and forecast, by country
- 6.3.4.1. Germany
- 6.3.4.1.1. Key market trends, growth factors and opportunities
- 6.3.4.1.2. Market size and forecast, by Material
- 6.3.4.1.3. Market size and forecast, by Component
- 6.3.4.2. UK
- 6.3.4.2.1. Key market trends, growth factors and opportunities
- 6.3.4.2.2. Market size and forecast, by Material
- 6.3.4.2.3. Market size and forecast, by Component
- 6.3.4.3. France
- 6.3.4.3.1. Key market trends, growth factors and opportunities
- 6.3.4.3.2. Market size and forecast, by Material
- 6.3.4.3.3. Market size and forecast, by Component
- 6.3.4.4. Italy
- 6.3.4.4.1. Key market trends, growth factors and opportunities
- 6.3.4.4.2. Market size and forecast, by Material
- 6.3.4.4.3. Market size and forecast, by Component
- 6.3.4.5. Spain
- 6.3.4.5.1. Key market trends, growth factors and opportunities
- 6.3.4.5.2. Market size and forecast, by Material
- 6.3.4.5.3. Market size and forecast, by Component
- 6.3.4.6. Rest of Europe
- 6.3.4.6.1. Key market trends, growth factors and opportunities
- 6.3.4.6.2. Market size and forecast, by Material
- 6.3.4.6.3. Market size and forecast, by Component
- 6.4. Asia-Pacific
- 6.4.1. Key trends and opportunities
- 6.4.2. Market size and forecast, by Material
- 6.4.3. Market size and forecast, by Component
- 6.4.4. Market size and forecast, by country
- 6.4.4.1. China
- 6.4.4.1.1. Key market trends, growth factors and opportunities
- 6.4.4.1.2. Market size and forecast, by Material
- 6.4.4.1.3. Market size and forecast, by Component
- 6.4.4.2. Japan
- 6.4.4.2.1. Key market trends, growth factors and opportunities
- 6.4.4.2.2. Market size and forecast, by Material
- 6.4.4.2.3. Market size and forecast, by Component
- 6.4.4.3. India
- 6.4.4.3.1. Key market trends, growth factors and opportunities
- 6.4.4.3.2. Market size and forecast, by Material
- 6.4.4.3.3. Market size and forecast, by Component
- 6.4.4.4. South Korea
- 6.4.4.4.1. Key market trends, growth factors and opportunities
- 6.4.4.4.2. Market size and forecast, by Material
- 6.4.4.4.3. Market size and forecast, by Component
- 6.4.4.5. Australia
- 6.4.4.5.1. Key market trends, growth factors and opportunities
- 6.4.4.5.2. Market size and forecast, by Material
- 6.4.4.5.3. Market size and forecast, by Component
- 6.4.4.6. Rest of Asia-Pacific
- 6.4.4.6.1. Key market trends, growth factors and opportunities
- 6.4.4.6.2. Market size and forecast, by Material
- 6.4.4.6.3. Market size and forecast, by Component
- 6.5. LAMEA
- 6.5.1. Key trends and opportunities
- 6.5.2. Market size and forecast, by Material
- 6.5.3. Market size and forecast, by Component
- 6.5.4. Market size and forecast, by country
- 6.5.4.1. Brazil
- 6.5.4.1.1. Key market trends, growth factors and opportunities
- 6.5.4.1.2. Market size and forecast, by Material
- 6.5.4.1.3. Market size and forecast, by Component
- 6.5.4.2. Saudi Arabia
- 6.5.4.2.1. Key market trends, growth factors and opportunities
- 6.5.4.2.2. Market size and forecast, by Material
- 6.5.4.2.3. Market size and forecast, by Component
- 6.5.4.3. South Africa
- 6.5.4.3.1. Key market trends, growth factors and opportunities
- 6.5.4.3.2. Market size and forecast, by Material
- 6.5.4.3.3. Market size and forecast, by Component
- 6.5.4.4. Rest of LAMEA
- 6.5.4.4.1. Key market trends, growth factors and opportunities
- 6.5.4.4.2. Market size and forecast, by Material
- 6.5.4.4.3. Market size and forecast, by Component
CHAPTER 7: COMPETITIVE LANDSCAPE
- 7.1. Introduction
- 7.2. Top winning strategies
- 7.3. Product Mapping of Top 10 Player
- 7.4. Competitive Dashboard
- 7.5. Competitive Heatmap
- 7.6. Top player positioning, 2022
CHAPTER 8: COMPANY PROFILES
- 8.1. INN Balance
- 8.1.1. Company overview
- 8.1.2. Key Executives
- 8.1.3. Company snapshot
- 8.1.4. Operating business segments
- 8.1.5. Product portfolio
- 8.2. Cummins, Inc.
- 8.2.1. Company overview
- 8.2.2. Key Executives
- 8.2.3. Company snapshot
- 8.2.4. Operating business segments
- 8.2.5. Product portfolio
- 8.2.6. Business performance
- 8.2.7. Key strategic moves and developments
- 8.3. Hydrogenics Corporation
- 8.3.1. Company overview
- 8.3.2. Key Executives
- 8.3.3. Company snapshot
- 8.3.4. Operating business segments
- 8.3.5. Product portfolio
- 8.4. Ballard Power Systems
- 8.4.1. Company overview
- 8.4.2. Key Executives
- 8.4.3. Company snapshot
- 8.4.4. Operating business segments
- 8.4.5. Product portfolio
- 8.4.6. Business performance
- 8.4.7. Key strategic moves and developments
- 8.5. Bloom Energy
- 8.5.1. Company overview
- 8.5.2. Key Executives
- 8.5.3. Company snapshot
- 8.5.4. Operating business segments
- 8.5.5. Product portfolio
- 8.5.6. Business performance
- 8.5.7. Key strategic moves and developments
- 8.6. SFC Energy AG
- 8.6.1. Company overview
- 8.6.2. Key Executives
- 8.6.3. Company snapshot
- 8.6.4. Operating business segments
- 8.6.5. Product portfolio
- 8.6.6. Business performance
- 8.7. Doosan Fuel Cell Co., Ltd.
- 8.7.1. Company overview
- 8.7.2. Key Executives
- 8.7.3. Company snapshot
- 8.7.4. Operating business segments
- 8.7.5. Product portfolio
- 8.7.6. Business performance
- 8.7.7. Key strategic moves and developments
- 8.8. HORIBA FuelCon GmbH
- 8.8.1. Company overview
- 8.8.2. Key Executives
- 8.8.3. Company snapshot
- 8.8.4. Operating business segments
- 8.8.5. Product portfolio
- 8.9. Elcogen AS
- 8.9.1. Company overview
- 8.9.2. Key Executives
- 8.9.3. Company snapshot
- 8.9.4. Operating business segments
- 8.9.5. Product portfolio
- 8.10. Dana Limited
- 8.10.1. Company overview
- 8.10.2. Key Executives
- 8.10.3. Company snapshot
- 8.10.4. Operating business segments
- 8.10.5. Product portfolio
- 8.10.6. Business performance
- 8.10.7. Key strategic moves and developments
LIST OF TABLES
- TABLE 01. GLOBAL FUEL CELL BALANCE OF PLANT (BOP) MARKET, BY MATERIAL, 2022-2032 ($MILLION)
- TABLE 02. FUEL CELL BALANCE OF PLANT (BOP) MARKET FOR STRUCTURAL PLASTICS, BY REGION, 2022-2032 ($MILLION)
- TABLE 03. FUEL CELL BALANCE OF PLANT (BOP) MARKET FOR ELASTOMERS, BY REGION, 2022-2032 ($MILLION)
- TABLE 04. FUEL CELL BALANCE OF PLANT (BOP) MARKET FOR COOLANTS, BY REGION, 2022-2032 ($MILLION)
- TABLE 05. FUEL CELL BALANCE OF PLANT (BOP) MARKET FOR ASSEMBLY AIDS, BY REGION, 2022-2032 ($MILLION)
- TABLE 06. FUEL CELL BALANCE OF PLANT (BOP) MARKET FOR METALS, BY REGION, 2022-2032 ($MILLION)
- TABLE 07. FUEL CELL BALANCE OF PLANT (BOP) MARKET FOR OTHERS, BY REGION, 2022-2032 ($MILLION)
- TABLE 08. GLOBAL FUEL CELL BALANCE OF PLANT (BOP) MARKET, BY COMPONENT, 2022-2032 ($MILLION)
- TABLE 09. FUEL CELL BALANCE OF PLANT (BOP) MARKET FOR POWER SUPPLY, BY REGION, 2022-2032 ($MILLION)
- TABLE 10. FUEL CELL BALANCE OF PLANT (BOP) MARKET FOR WATER CIRCULATION, BY REGION, 2022-2032 ($MILLION)
- TABLE 11. FUEL CELL BALANCE OF PLANT (BOP) MARKET FOR HYDROGEN PROCESSING, BY REGION, 2022-2032 ($MILLION)
- TABLE 12. FUEL CELL BALANCE OF PLANT (BOP) MARKET FOR COOLING, BY REGION, 2022-2032 ($MILLION)
- TABLE 13. FUEL CELL BALANCE OF PLANT (BOP) MARKET FOR HEAT STABILIZERS, BY REGION, 2022-2032 ($MILLION)
- TABLE 14. FUEL CELL BALANCE OF PLANT (BOP) MARKET FOR OTHERS, BY REGION, 2022-2032 ($MILLION)
- TABLE 15. FUEL CELL BALANCE OF PLANT (BOP) MARKET, BY REGION, 2022-2032 ($MILLION)
- TABLE 16. NORTH AMERICA FUEL CELL BALANCE OF PLANT (BOP) MARKET, BY MATERIAL, 2022-2032 ($MILLION)
- TABLE 17. NORTH AMERICA FUEL CELL BALANCE OF PLANT (BOP) MARKET, BY COMPONENT, 2022-2032 ($MILLION)
- TABLE 18. NORTH AMERICA FUEL CELL BALANCE OF PLANT (BOP) MARKET, BY COUNTRY, 2022-2032 ($MILLION)
- TABLE 19. U.S. FUEL CELL BALANCE OF PLANT (BOP) MARKET, BY MATERIAL, 2022-2032 ($MILLION)
- TABLE 20. U.S. FUEL CELL BALANCE OF PLANT (BOP) MARKET, BY COMPONENT, 2022-2032 ($MILLION)
- TABLE 21. CANADA FUEL CELL BALANCE OF PLANT (BOP) MARKET, BY MATERIAL, 2022-2032 ($MILLION)
- TABLE 22. CANADA FUEL CELL BALANCE OF PLANT (BOP) MARKET, BY COMPONENT, 2022-2032 ($MILLION)
- TABLE 23. MEXICO FUEL CELL BALANCE OF PLANT (BOP) MARKET, BY MATERIAL, 2022-2032 ($MILLION)
- TABLE 24. MEXICO FUEL CELL BALANCE OF PLANT (BOP) MARKET, BY COMPONENT, 2022-2032 ($MILLION)
- TABLE 25. EUROPE FUEL CELL BALANCE OF PLANT (BOP) MARKET, BY MATERIAL, 2022-2032 ($MILLION)
- TABLE 26. EUROPE FUEL CELL BALANCE OF PLANT (BOP) MARKET, BY COMPONENT, 2022-2032 ($MILLION)
- TABLE 27. EUROPE FUEL CELL BALANCE OF PLANT (BOP) MARKET, BY COUNTRY, 2022-2032 ($MILLION)
- TABLE 28. GERMANY FUEL CELL BALANCE OF PLANT (BOP) MARKET, BY MATERIAL, 2022-2032 ($MILLION)
- TABLE 29. GERMANY FUEL CELL BALANCE OF PLANT (BOP) MARKET, BY COMPONENT, 2022-2032 ($MILLION)
- TABLE 30. UK FUEL CELL BALANCE OF PLANT (BOP) MARKET, BY MATERIAL, 2022-2032 ($MILLION)
- TABLE 31. UK FUEL CELL BALANCE OF PLANT (BOP) MARKET, BY COMPONENT, 2022-2032 ($MILLION)
- TABLE 32. FRANCE FUEL CELL BALANCE OF PLANT (BOP) MARKET, BY MATERIAL, 2022-2032 ($MILLION)
- TABLE 33. FRANCE FUEL CELL BALANCE OF PLANT (BOP) MARKET, BY COMPONENT, 2022-2032 ($MILLION)
- TABLE 34. ITALY FUEL CELL BALANCE OF PLANT (BOP) MARKET, BY MATERIAL, 2022-2032 ($MILLION)
- TABLE 35. ITALY FUEL CELL BALANCE OF PLANT (BOP) MARKET, BY COMPONENT, 2022-2032 ($MILLION)
- TABLE 36. SPAIN FUEL CELL BALANCE OF PLANT (BOP) MARKET, BY MATERIAL, 2022-2032 ($MILLION)
- TABLE 37. SPAIN FUEL CELL BALANCE OF PLANT (BOP) MARKET, BY COMPONENT, 2022-2032 ($MILLION)
- TABLE 38. REST OF EUROPE FUEL CELL BALANCE OF PLANT (BOP) MARKET, BY MATERIAL, 2022-2032 ($MILLION)
- TABLE 39. REST OF EUROPE FUEL CELL BALANCE OF PLANT (BOP) MARKET, BY COMPONENT, 2022-2032 ($MILLION)
- TABLE 40. ASIA-PACIFIC FUEL CELL BALANCE OF PLANT (BOP) MARKET, BY MATERIAL, 2022-2032 ($MILLION)
- TABLE 41. ASIA-PACIFIC FUEL CELL BALANCE OF PLANT (BOP) MARKET, BY COMPONENT, 2022-2032 ($MILLION)
- TABLE 42. ASIA-PACIFIC FUEL CELL BALANCE OF PLANT (BOP) MARKET, BY COUNTRY, 2022-2032 ($MILLION)
- TABLE 43. CHINA FUEL CELL BALANCE OF PLANT (BOP) MARKET, BY MATERIAL, 2022-2032 ($MILLION)
- TABLE 44. CHINA FUEL CELL BALANCE OF PLANT (BOP) MARKET, BY COMPONENT, 2022-2032 ($MILLION)
- TABLE 45. JAPAN FUEL CELL BALANCE OF PLANT (BOP) MARKET, BY MATERIAL, 2022-2032 ($MILLION)
- TABLE 46. JAPAN FUEL CELL BALANCE OF PLANT (BOP) MARKET, BY COMPONENT, 2022-2032 ($MILLION)
- TABLE 47. INDIA FUEL CELL BALANCE OF PLANT (BOP) MARKET, BY MATERIAL, 2022-2032 ($MILLION)
- TABLE 48. INDIA FUEL CELL BALANCE OF PLANT (BOP) MARKET, BY COMPONENT, 2022-2032 ($MILLION)
- TABLE 49. SOUTH KOREA FUEL CELL BALANCE OF PLANT (BOP) MARKET, BY MATERIAL, 2022-2032 ($MILLION)
- TABLE 50. SOUTH KOREA FUEL CELL BALANCE OF PLANT (BOP) MARKET, BY COMPONENT, 2022-2032 ($MILLION)
- TABLE 51. AUSTRALIA FUEL CELL BALANCE OF PLANT (BOP) MARKET, BY MATERIAL, 2022-2032 ($MILLION)
- TABLE 52. AUSTRALIA FUEL CELL BALANCE OF PLANT (BOP) MARKET, BY COMPONENT, 2022-2032 ($MILLION)
- TABLE 53. REST OF ASIA-PACIFIC FUEL CELL BALANCE OF PLANT (BOP) MARKET, BY MATERIAL, 2022-2032 ($MILLION)
- TABLE 54. REST OF ASIA-PACIFIC FUEL CELL BALANCE OF PLANT (BOP) MARKET, BY COMPONENT, 2022-2032 ($MILLION)
- TABLE 55. LAMEA FUEL CELL BALANCE OF PLANT (BOP) MARKET, BY MATERIAL, 2022-2032 ($MILLION)
- TABLE 56. LAMEA FUEL CELL BALANCE OF PLANT (BOP) MARKET, BY COMPONENT, 2022-2032 ($MILLION)
- TABLE 57. LAMEA FUEL CELL BALANCE OF PLANT (BOP) MARKET, BY COUNTRY, 2022-2032 ($MILLION)
- TABLE 58. BRAZIL FUEL CELL BALANCE OF PLANT (BOP) MARKET, BY MATERIAL, 2022-2032 ($MILLION)
- TABLE 59. BRAZIL FUEL CELL BALANCE OF PLANT (BOP) MARKET, BY COMPONENT, 2022-2032 ($MILLION)
- TABLE 60. SAUDI ARABIA FUEL CELL BALANCE OF PLANT (BOP) MARKET, BY MATERIAL, 2022-2032 ($MILLION)
- TABLE 61. SAUDI ARABIA FUEL CELL BALANCE OF PLANT (BOP) MARKET, BY COMPONENT, 2022-2032 ($MILLION)
- TABLE 62. SOUTH AFRICA FUEL CELL BALANCE OF PLANT (BOP) MARKET, BY MATERIAL, 2022-2032 ($MILLION)
- TABLE 63. SOUTH AFRICA FUEL CELL BALANCE OF PLANT (BOP) MARKET, BY COMPONENT, 2022-2032 ($MILLION)
- TABLE 64. REST OF LAMEA FUEL CELL BALANCE OF PLANT (BOP) MARKET, BY MATERIAL, 2022-2032 ($MILLION)
- TABLE 65. REST OF LAMEA FUEL CELL BALANCE OF PLANT (BOP) MARKET, BY COMPONENT, 2022-2032 ($MILLION)
- TABLE 66. INN BALANCE: KEY EXECUTIVES
- TABLE 67. INN BALANCE: COMPANY SNAPSHOT
- TABLE 68. INN BALANCE: PRODUCT SEGMENTS
- TABLE 69. INN BALANCE: PRODUCT PORTFOLIO
- TABLE 70. CUMMINS, INC.: KEY EXECUTIVES
- TABLE 71. CUMMINS, INC.: COMPANY SNAPSHOT
- TABLE 72. CUMMINS, INC.: PRODUCT SEGMENTS
- TABLE 73. CUMMINS, INC.: PRODUCT PORTFOLIO
- TABLE 74. CUMMINS, INC.: KEY STRATERGIES
- TABLE 75. HYDROGENICS CORPORATION: KEY EXECUTIVES
- TABLE 76. HYDROGENICS CORPORATION: COMPANY SNAPSHOT
- TABLE 77. HYDROGENICS CORPORATION: PRODUCT SEGMENTS
- TABLE 78. HYDROGENICS CORPORATION: PRODUCT PORTFOLIO
- TABLE 79. BALLARD POWER SYSTEMS: KEY EXECUTIVES
- TABLE 80. BALLARD POWER SYSTEMS: COMPANY SNAPSHOT
- TABLE 81. BALLARD POWER SYSTEMS: PRODUCT SEGMENTS
- TABLE 82. BALLARD POWER SYSTEMS: PRODUCT PORTFOLIO
- TABLE 83. BALLARD POWER SYSTEMS: KEY STRATERGIES
- TABLE 84. BLOOM ENERGY: KEY EXECUTIVES
- TABLE 85. BLOOM ENERGY: COMPANY SNAPSHOT
- TABLE 86. BLOOM ENERGY: SERVICE SEGMENTS
- TABLE 87. BLOOM ENERGY: PRODUCT PORTFOLIO
- TABLE 88. BLOOM ENERGY: KEY STRATERGIES
- TABLE 89. SFC ENERGY AG: KEY EXECUTIVES
- TABLE 90. SFC ENERGY AG: COMPANY SNAPSHOT
- TABLE 91. SFC ENERGY AG: PRODUCT SEGMENTS
- TABLE 92. SFC ENERGY AG: PRODUCT PORTFOLIO
- TABLE 93. DOOSAN FUEL CELL CO., LTD.: KEY EXECUTIVES
- TABLE 94. DOOSAN FUEL CELL CO., LTD.: COMPANY SNAPSHOT
- TABLE 95. DOOSAN FUEL CELL CO., LTD.: SERVICE SEGMENTS
- TABLE 96. DOOSAN FUEL CELL CO., LTD.: PRODUCT PORTFOLIO
- TABLE 97. DOOSAN FUEL CELL CO., LTD.: KEY STRATERGIES
- TABLE 98. HORIBA FUELCON GMBH: KEY EXECUTIVES
- TABLE 99. HORIBA FUELCON GMBH: COMPANY SNAPSHOT
- TABLE 100. HORIBA FUELCON GMBH: SERVICE SEGMENTS
- TABLE 101. HORIBA FUELCON GMBH: PRODUCT PORTFOLIO
- TABLE 102. ELCOGEN AS: KEY EXECUTIVES
- TABLE 103. ELCOGEN AS: COMPANY SNAPSHOT
- TABLE 104. ELCOGEN AS: PRODUCT SEGMENTS
- TABLE 105. ELCOGEN AS: PRODUCT PORTFOLIO
- TABLE 106. DANA LIMITED: KEY EXECUTIVES
- TABLE 107. DANA LIMITED: COMPANY SNAPSHOT
- TABLE 108. DANA LIMITED: PRODUCT SEGMENTS
- TABLE 109. DANA LIMITED: PRODUCT PORTFOLIO
- TABLE 110. DANA LIMITED: KEY STRATERGIES
LIST OF FIGURES
- FIGURE 01. FUEL CELL BALANCE OF PLANT (BOP) MARKET, 2022-2032
- FIGURE 02. SEGMENTATION OF FUEL CELL BALANCE OF PLANT (BOP) MARKET, 2022-2032
- FIGURE 03. TOP INVESTMENT POCKETS IN FUEL CELL BALANCE OF PLANT (BOP) MARKET (2023-2032)
- FIGURE 04. LOW BARGAINING POWER OF SUPPLIERS
- FIGURE 05. LOW THREAT OF NEW ENTRANTS
- FIGURE 06. LOW THREAT OF SUBSTITUTES
- FIGURE 07. LOW INTENSITY OF RIVALRY
- FIGURE 08. LOW BARGAINING POWER OF BUYERS
- FIGURE 09. DRIVERS, RESTRAINTS AND OPPORTUNITIES: GLOBALFUEL CELL BALANCE OF PLANT (BOP) MARKET
- FIGURE 10. PATENT ANALYSIS BY COMPANY
- FIGURE 11. PATENT ANALYSIS BY COUNTRY
- FIGURE 12. REGULATORY GUIDELINES: FUEL CELL BALANCE OF PLANT (BOP) MARKET
- FIGURE 12. FUEL CELL BALANCE OF PLANT (BOP) MARKET, BY MATERIAL, 2022(%)
- FIGURE 13. COMPARATIVE SHARE ANALYSIS OF FUEL CELL BALANCE OF PLANT (BOP) MARKET FOR STRUCTURAL PLASTICS, BY COUNTRY 2022 AND 2032(%)
- FIGURE 14. COMPARATIVE SHARE ANALYSIS OF FUEL CELL BALANCE OF PLANT (BOP) MARKET FOR ELASTOMERS, BY COUNTRY 2022 AND 2032(%)
- FIGURE 15. COMPARATIVE SHARE ANALYSIS OF FUEL CELL BALANCE OF PLANT (BOP) MARKET FOR COOLANTS, BY COUNTRY 2022 AND 2032(%)
- FIGURE 16. COMPARATIVE SHARE ANALYSIS OF FUEL CELL BALANCE OF PLANT (BOP) MARKET FOR ASSEMBLY AIDS, BY COUNTRY 2022 AND 2032(%)
- FIGURE 17. COMPARATIVE SHARE ANALYSIS OF FUEL CELL BALANCE OF PLANT (BOP) MARKET FOR METALS, BY COUNTRY 2022 AND 2032(%)
- FIGURE 18. COMPARATIVE SHARE ANALYSIS OF FUEL CELL BALANCE OF PLANT (BOP) MARKET FOR OTHERS, BY COUNTRY 2022 AND 2032(%)
- FIGURE 19. FUEL CELL BALANCE OF PLANT (BOP) MARKET, BY COMPONENT, 2022(%)
- FIGURE 20. COMPARATIVE SHARE ANALYSIS OF FUEL CELL BALANCE OF PLANT (BOP) MARKET FOR POWER SUPPLY, BY COUNTRY 2022 AND 2032(%)
- FIGURE 21. COMPARATIVE SHARE ANALYSIS OF FUEL CELL BALANCE OF PLANT (BOP) MARKET FOR WATER CIRCULATION, BY COUNTRY 2022 AND 2032(%)
- FIGURE 22. COMPARATIVE SHARE ANALYSIS OF FUEL CELL BALANCE OF PLANT (BOP) MARKET FOR HYDROGEN PROCESSING, BY COUNTRY 2022 AND 2032(%)
- FIGURE 23. COMPARATIVE SHARE ANALYSIS OF FUEL CELL BALANCE OF PLANT (BOP) MARKET FOR COOLING, BY COUNTRY 2022 AND 2032(%)
- FIGURE 24. COMPARATIVE SHARE ANALYSIS OF FUEL CELL BALANCE OF PLANT (BOP) MARKET FOR HEAT STABILIZERS, BY COUNTRY 2022 AND 2032(%)
- FIGURE 25. COMPARATIVE SHARE ANALYSIS OF FUEL CELL BALANCE OF PLANT (BOP) MARKET FOR OTHERS, BY COUNTRY 2022 AND 2032(%)
- FIGURE 26. FUEL CELL BALANCE OF PLANT (BOP) MARKET BY REGION, 2022
- FIGURE 27. U.S. FUEL CELL BALANCE OF PLANT (BOP) MARKET, 2022-2032 ($MILLION)
- FIGURE 28. CANADA FUEL CELL BALANCE OF PLANT (BOP) MARKET, 2022-2032 ($MILLION)
- FIGURE 29. MEXICO FUEL CELL BALANCE OF PLANT (BOP) MARKET, 2022-2032 ($MILLION)
- FIGURE 30. GERMANY FUEL CELL BALANCE OF PLANT (BOP) MARKET, 2022-2032 ($MILLION)
- FIGURE 31. UK FUEL CELL BALANCE OF PLANT (BOP) MARKET, 2022-2032 ($MILLION)
- FIGURE 32. FRANCE FUEL CELL BALANCE OF PLANT (BOP) MARKET, 2022-2032 ($MILLION)
- FIGURE 33. ITALY FUEL CELL BALANCE OF PLANT (BOP) MARKET, 2022-2032 ($MILLION)
- FIGURE 34. SPAIN FUEL CELL BALANCE OF PLANT (BOP) MARKET, 2022-2032 ($MILLION)
- FIGURE 35. REST OF EUROPE FUEL CELL BALANCE OF PLANT (BOP) MARKET, 2022-2032 ($MILLION)
- FIGURE 36. CHINA FUEL CELL BALANCE OF PLANT (BOP) MARKET, 2022-2032 ($MILLION)
- FIGURE 37. JAPAN FUEL CELL BALANCE OF PLANT (BOP) MARKET, 2022-2032 ($MILLION)
- FIGURE 38. INDIA FUEL CELL BALANCE OF PLANT (BOP) MARKET, 2022-2032 ($MILLION)
- FIGURE 39. SOUTH KOREA FUEL CELL BALANCE OF PLANT (BOP) MARKET, 2022-2032 ($MILLION)
- FIGURE 40. AUSTRALIA FUEL CELL BALANCE OF PLANT (BOP) MARKET, 2022-2032 ($MILLION)
- FIGURE 41. REST OF ASIA-PACIFIC FUEL CELL BALANCE OF PLANT (BOP) MARKET, 2022-2032 ($MILLION)
- FIGURE 42. BRAZIL FUEL CELL BALANCE OF PLANT (BOP) MARKET, 2022-2032 ($MILLION)
- FIGURE 43. SAUDI ARABIA FUEL CELL BALANCE OF PLANT (BOP) MARKET, 2022-2032 ($MILLION)
- FIGURE 44. SOUTH AFRICA FUEL CELL BALANCE OF PLANT (BOP) MARKET, 2022-2032 ($MILLION)
- FIGURE 45. REST OF LAMEA FUEL CELL BALANCE OF PLANT (BOP) MARKET, 2022-2032 ($MILLION)
- FIGURE 46. TOP WINNING STRATEGIES, BY YEAR
- FIGURE 47. TOP WINNING STRATEGIES, BY DEVELOPMENT
- FIGURE 48. TOP WINNING STRATEGIES, BY COMPANY
- FIGURE 49. PRODUCT MAPPING OF TOP 10 PLAYERS
- FIGURE 50. COMPETITIVE DASHBOARD
- FIGURE 51. COMPETITIVE HEATMAP: FUEL CELL BALANCE OF PLANT (BOP) MARKET
- FIGURE 52. TOP PLAYER POSITIONING, 2022
- FIGURE 53. CUMMINS, INC.: RESEARCH & DEVELOPMENT EXPENDITURE, 2020-2022 ($MILLION)
- FIGURE 54. CUMMINS, INC.: NET REVENUE, 2020-2022 ($MILLION)
- FIGURE 55. CUMMINS, INC.: REVENUE SHARE BY SEGMENT, 2021 (%)
- FIGURE 56. CUMMINS, INC.: REVENUE SHARE BY REGION, 2021 (%)
- FIGURE 57. BALLARD POWER SYSTEMS: NET REVENUE, 2020-2022 ($MILLION)
- FIGURE 58. BALLARD POWER SYSTEMS: REVENUE SHARE BY SEGMENT, 2021 (%)
- FIGURE 59. BALLARD POWER SYSTEMS: REVENUE SHARE BY REGION, 2021 (%)
- FIGURE 60. BLOOM ENERGY: NET REVENUE, 2020-2022 ($MILLION)
- FIGURE 61. BLOOM ENERGY: REVENUE SHARE BY SEGMENT, 2022 (%)
- FIGURE 62. SFC ENERGY AG: NET SALES, 2020-2022 ($MILLION)
- FIGURE 63. SFC ENERGY AG: REVENUE SHARE BY SEGMENT, 2021 (%)
- FIGURE 64. SFC ENERGY AG: REVENUE SHARE BY REGION, 2021 (%)
- FIGURE 65. DOOSAN FUEL CELL CO., LTD.: NET SALES, 2020-2022 ($MILLION)
- FIGURE 66. DOOSAN FUEL CELL CO., LTD.: REVENUE SHARE BY SEGMENT, 2021 (%)
- FIGURE 67. DANA LIMITED: NET SALES, 2020-2022 ($MILLION)
- FIGURE 68. DANA LIMITED: RESEARCH & DEVELOPMENT EXPENDITURE, 2020-2022 ($MILLION)
- FIGURE 69. DANA LIMITED: REVENUE SHARE BY SEGMENT, 2022 (%)
- FIGURE 70. DANA LIMITED: REVENUE SHARE BY REGION, 2022 (%)
 燃料电池工厂全球市场平衡
 2025年再生燃料电池全球市场报告
 2025-2035年全球燃料电池市场燃料电池市场分析及预测(至2034年):类型、产品、服务、技术、组件、应用、材料类型、部署、最终用户、安装类型
 燃料电池市场按类型、组件、分销管道、应用和最终用户产业划分-2025-2030 年全球预测
 燃料电池市场规模、份额、成长分析(按组件、按类型、按燃料、按规模、按应用、按最终用途行业、按地区)- 行业预测 2025-2032
 燃料电池-市场占有率分析、产业趋势与统计、成长预测(2025-2030 年)
 全球燃料电池市场研究报告 - 产业分析、规模、份额、成长、趋势和预测 2025 年至 2033 年全球燃料电池平衡工厂市场研究报告 - 产业分析、规模、份额、成长、趋势和预测 2025 年至 2033 年
 工业和军用燃料电池市场(2025-2029)