


 |
市场调查报告书
商品编码
1344428
阻燃防护衣市场:依材料、分产品、最终用途产业:2023-2032年全球机会分析与产业预测Flame Retardant Protective Wear Market By Material, By Product, By End-use Industry : Global Opportunity Analysis and Industry Forecast, 2023-2032 |
||||||
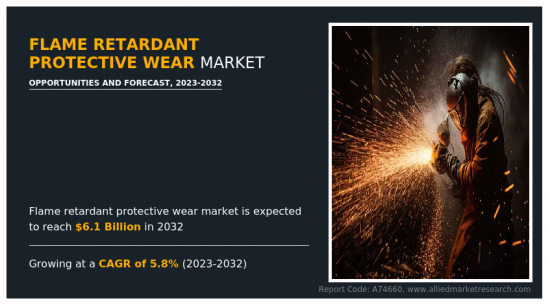
根据Allied Market Research发布的最新报告《阻燃防护服市场》,2022年阻燃防护服市场价值将达到35亿美元,并且从2023年到2032年将持续增长。预计2020 年复合年增长率为5.8%,2032 年达61 亿美元。
阻燃防护服是指保护穿着者免受衝击和火灾等危险的连身衣、飞行员夹克、高能见度夹克等服装。 对阻燃防护服的需求主要是由于对工人安全的日益关注以及职业安全与健康管理局 (OSHA) 法规的加强而推动的。 根据OSHA的规定,在电气、製造、石油和天然气行业工作的工人必须穿着阻燃防护服以确保安全。
对个人防护装备的需求预计会增加,以避免可避免的死亡和火灾危险。 随着越来越多的消费者和企业意识到在进行工业工作时穿着阻燃防护服的好处,阻燃防护服市场正在不断发展。 随着对更软、更轻、更耐热材料的需求增加,市场参与者正在投资研发以提高产品品质。 由于具有高机械和化学耐受性的耐用多用途服装的趋势不断增长,预计在预测期内对阻燃服装的需求将会上升。
在工业领域,越来越多地接受个人防护设备和配件等更便宜的替代品,预计将成为阻燃防护服市场扩张的障碍。 用于生产阻燃防护服的原材料价格上涨是鼓励最终用户选择更实惠的替代品的关键因素。 阻燃防护服的成长预计将受到价格合理的替代品的阻碍。
由于住宅和商业家具对防火织物的需求不断增加、严格的工业织物标准以及采矿业需求的增加,预计未来几年市场将增长。 由于与药物开发、疫苗製造和製药相关的一系列正在进行的研发活动,对阻燃服装的需求正在增加。 实验室工作人员穿着阻燃服装,免受熊熊火焰的强烈影响。 工业部门的需求增加也是推动市场扩张的因素之一,工业部门对工人安全非常重视。 因此,製药和工业领域对阻燃服装的需求不断增加将加速市场成长。
COVID-19大流行对阻燃防护衣市场产生了负面影响。 作为大流行的情况,一些国家已进入封锁状态以阻止病毒的传播。 整个供应和需求链被扰乱,对市场成长产生负面影响。 COVID-19 的爆发预计将对许多行业产生直接和长期的影响,包括交通、采矿和其他工业製造部门。 所有这些影响也可能影响疫情后阻燃防护衣市场的成长。
目录
第一章简介
第 2 章执行摘要
第三章市场概述
- 市场定义和范围
- 主要发现
- 影响因素
- 主要投资机会
- 波特五力分析
- 市场动态
- 促进因素
- 抑制因素
- 机会
- 新冠肺炎 (COVID-19) 造成的市场影响分析
- 品牌占有率分析
- 主要监理分析
- 市占率分析
- 专利情况
- 监理指南
- 价值链分析
第四章阻燃防护衣市场:依材料划分
- 凯夫拉縴维
- 变性丙烯酸酯
- 诺梅克斯
- 其他
第五章阻燃防护衣市场:依产品分类
- 围裙
- 外套
- 裤子
- 夹克
- 袖子
- 其他
第 6 章阻燃防护衣市场:依最终用途产业划分
- 电力
- 石油和天然气
- 建筑/製造
- 采矿
- 其他
第七章阻燃防护衣市场:依地区
- 北美
- 美国
- 加拿大
- 墨西哥
- 欧洲
- 德国
- 英国
- 法国
- 西班牙
- 义大利
- 欧洲其他地区
- 亚太地区
- 中国
- 日本
- 印度
- 韩国
- 澳大利亚
- 其他亚太地区
- 拉丁美洲/中东/非洲
- 巴西
- 沙乌地阿拉伯
- 阿联酋
- 南非
- 其他领域
第八章竞争态势
- 简介
- 关键成功策略
- 10家主要公司的产品图谱
- 竞争对手仪表板
- 竞争热图
- 2022 年主要公司的定位
第九章公司简介
- Ansell Ltd.
- 3M
- VF Corporation
- Honeywell International Inc.
- Lakeland Inc.
- Kimberly-Clark Corporation
- DuPont
- Solvay
- International Enviroguard
- W. L. Gore & Associates Inc.
According to a new report published by Allied Market Research, titled, "Flame Retardant Protective Wear Market," The flame retardant protective wear market was valued at $3.5 billion in 2022, and is estimated to reach $6.1 billion by 2032, growing at a CAGR of 5.8% from 2023 to 2032. Flame retardant protective wear refers to the garments such as coveralls, bomber-jackers, high-visibility jackets, and others that offers protection to the wearers from hazards such as shock or fire. Demand for flame retardant protective wear is majorly attributed to rising safety concerns among workers and increasing regulations laid down by Occupational Safety and Health Administration (OSHA). According to OSHA, the workers working in the electrical, manufacturing, and oil & gas sector must use flame retardant protective wear to ensure their safety.
In order to avoid avoidable deaths or the dangers of flames, the demand for personal protective clothing is likely to increase. The market for flame retardant protective wear is developing as more consumers and businesses become aware of the benefits of wearing flame-resistant clothing when performing industrial tasks. Market players are investing in R&D to improve the quality of their products as demand for cozy, light, and more heat-resistant materials rises. The demand for flame retardant clothing is anticipated to rise during the forecast period due to the rising trend towards long-lasting, multipurpose clothing with high mechanical and chemical resistance.
The increasing acceptance of less expensive alternatives, such as personal protective equipment and accessories, in the industrial sector, is predicted to act as a barrier to the market expansion for flame retardant protective wear. The rise in the price of the raw materials used to manufacture flame retardant clothing is a significant factor encouraging end users to select more affordable alternatives. The growth of the flame retardant protective wear is predicted to be hampered due to the availability of reasonably priced alternatives.
The market is expected to grow in the future due to rising demand for fire-resistant fabrics in residential and commercial furnishings, strict industrial fabric standards, and rising demand from the mining industry. The demand for flame retardant clothing has increased due to numerous ongoing R&D initiatives related to drug development, vaccine creation, and pharmaceuticals. The laboratory staff is shielded from the intensified effects of the burning flame by flame-resistant clothing. Increase in demand from the industrial sector, where workers' safety is highly valued is another factor driving the market expansion. Therefore, the market growth is accelerated by an increase in demand for flame retardant clothing from the pharmaceutical and industrial sectors.
The COVID-19 pandemic had a negative effect on the flame retardant protective wear market. As of the pandemic situation, several nations went into lockdown to stop the virus from spreading. The entire supply and demand chain was disturbed, which had a negative impact on the market growth. The COVID-19 outbreak is anticipated to have a number of immediate and long-term effects on a number of industries, including transportation, mining, and other industrial manufacturing sectors. All of these effects could have an impact on the market for flame retardant protective wear market growth in the post-pandemic period as well.
The key players profiled in this report include: ANSELL LTD, 3M, VF CORPORATION , Honeywell International Inc., Lakeland Inc, Kimberly Clark Corp, DuPont, SOLVAY International Enviroguard, and W. L. Gore & Associates Inc.
Key Benefits For Stakeholders
- This report provides a quantitative analysis of the market segments, current trends, estimations, and dynamics of the flame retardant protective wear market analysis from 2022 to 2032 to identify the prevailing flame retardant protective wear market opportunities.
- The market research is offered along with information related to key drivers, restraints, and opportunities.
- Porter's five forces analysis highlights the potency of buyers and suppliers to enable stakeholders make profit-oriented business decisions and strengthen their supplier-buyer network.
- In-depth analysis of the flame retardant protective wear market segmentation assists to determine the prevailing market opportunities.
- Major countries in each region are mapped according to their revenue contribution to the global market.
- Market player positioning facilitates benchmarking and provides a clear understanding of the present position of the market players.
- The report includes the analysis of the regional as well as global flame retardant protective wear market trends, key players, market segments, application areas, and market growth strategies.
Key Market Segments
By Product
- Apron
- Coat
- Pant
- Jacket
- Sleeves
- Others
By End-use Industry
- Electrical
- Oil and Gas
- Construction and Manufacturing
- Mining
- Others
By Material
- Kevlar
- Modacrylic
- Nomex
- Others
By Region
- North America
- U.S.
- Canada
- Mexico
- Europe
- Germany
- UK
- France
- Spain
- Italy
- Rest of Europe
- Asia-Pacific
- China
- Japan
- India
- South Korea
- Australia
- Rest of Asia-Pacific
- LAMEA
- Brazil
- Saudi Arabia
- UAE
- South Africa
- Rest of LAMEA
Key Market Players:
- Ansell Ltd.
- 3M
- VF Corporation
- Honeywell International Inc.
- Lakeland Inc.
- Kimberly-Clark Corporation
- DuPont
- Solvay
- International Enviroguard
- W. L. Gore & Associates Inc.
TABLE OF CONTENTS
CHAPTER 1: INTRODUCTION
- 1.1. Report description
- 1.2. Key market segments
- 1.3. Key benefits to the stakeholders
- 1.4. Research Methodology
- 1.4.1. Primary research
- 1.4.2. Secondary research
- 1.4.3. Analyst tools and models
CHAPTER 2: EXECUTIVE SUMMARY
- 2.1. CXO Perspective
CHAPTER 3: MARKET OVERVIEW
- 3.1. Market definition and scope
- 3.2. Key findings
- 3.2.1. Top impacting factors
- 3.2.2. Top investment pockets
- 3.3. Porter's five forces analysis
- 3.4. Market dynamics
- 3.4.1. Drivers
- 3.4.2. Restraints
- 3.4.3. Opportunities
- 3.5. COVID-19 Impact Analysis on the market
- 3.6. Brand Share Analysis
- 3.7. Key Regulation Analysis
- 3.8. Market Share Analysis
- 3.9. Patent Landscape
- 3.10. Regulatory Guidelines
- 3.11. Value Chain Analysis
CHAPTER 4: FLAME RETARDANT PROTECTIVE WEAR MARKET, BY MATERIAL
- 4.1. Overview
- 4.1.1. Market size and forecast
- 4.2. Kevlar
- 4.2.1. Key market trends, growth factors and opportunities
- 4.2.2. Market size and forecast, by region
- 4.2.3. Market share analysis by country
- 4.3. Modacrylic
- 4.3.1. Key market trends, growth factors and opportunities
- 4.3.2. Market size and forecast, by region
- 4.3.3. Market share analysis by country
- 4.4. Nomex
- 4.4.1. Key market trends, growth factors and opportunities
- 4.4.2. Market size and forecast, by region
- 4.4.3. Market share analysis by country
- 4.5. Others
- 4.5.1. Key market trends, growth factors and opportunities
- 4.5.2. Market size and forecast, by region
- 4.5.3. Market share analysis by country
CHAPTER 5: FLAME RETARDANT PROTECTIVE WEAR MARKET, BY PRODUCT
- 5.1. Overview
- 5.1.1. Market size and forecast
- 5.2. Apron
- 5.2.1. Key market trends, growth factors and opportunities
- 5.2.2. Market size and forecast, by region
- 5.2.3. Market share analysis by country
- 5.3. Coat
- 5.3.1. Key market trends, growth factors and opportunities
- 5.3.2. Market size and forecast, by region
- 5.3.3. Market share analysis by country
- 5.4. Pant
- 5.4.1. Key market trends, growth factors and opportunities
- 5.4.2. Market size and forecast, by region
- 5.4.3. Market share analysis by country
- 5.5. Jacket
- 5.5.1. Key market trends, growth factors and opportunities
- 5.5.2. Market size and forecast, by region
- 5.5.3. Market share analysis by country
- 5.6. Sleeves
- 5.6.1. Key market trends, growth factors and opportunities
- 5.6.2. Market size and forecast, by region
- 5.6.3. Market share analysis by country
- 5.7. Others
- 5.7.1. Key market trends, growth factors and opportunities
- 5.7.2. Market size and forecast, by region
- 5.7.3. Market share analysis by country
CHAPTER 6: FLAME RETARDANT PROTECTIVE WEAR MARKET, BY END-USE INDUSTRY
- 6.1. Overview
- 6.1.1. Market size and forecast
- 6.2. Electrical
- 6.2.1. Key market trends, growth factors and opportunities
- 6.2.2. Market size and forecast, by region
- 6.2.3. Market share analysis by country
- 6.3. Oil and Gas
- 6.3.1. Key market trends, growth factors and opportunities
- 6.3.2. Market size and forecast, by region
- 6.3.3. Market share analysis by country
- 6.4. Construction and Manufacturing
- 6.4.1. Key market trends, growth factors and opportunities
- 6.4.2. Market size and forecast, by region
- 6.4.3. Market share analysis by country
- 6.5. Mining
- 6.5.1. Key market trends, growth factors and opportunities
- 6.5.2. Market size and forecast, by region
- 6.5.3. Market share analysis by country
- 6.6. Others
- 6.6.1. Key market trends, growth factors and opportunities
- 6.6.2. Market size and forecast, by region
- 6.6.3. Market share analysis by country
CHAPTER 7: FLAME RETARDANT PROTECTIVE WEAR MARKET, BY REGION
- 7.1. Overview
- 7.1.1. Market size and forecast By Region
- 7.2. North America
- 7.2.1. Key trends and opportunities
- 7.2.2. Market size and forecast, by Material
- 7.2.3. Market size and forecast, by Product
- 7.2.4. Market size and forecast, by End-use Industry
- 7.2.5. Market size and forecast, by country
- 7.2.5.1. U.S.
- 7.2.5.1.1. Key market trends, growth factors and opportunities
- 7.2.5.1.2. Market size and forecast, by Material
- 7.2.5.1.3. Market size and forecast, by Product
- 7.2.5.1.4. Market size and forecast, by End-use Industry
- 7.2.5.2. Canada
- 7.2.5.2.1. Key market trends, growth factors and opportunities
- 7.2.5.2.2. Market size and forecast, by Material
- 7.2.5.2.3. Market size and forecast, by Product
- 7.2.5.2.4. Market size and forecast, by End-use Industry
- 7.2.5.3. Mexico
- 7.2.5.3.1. Key market trends, growth factors and opportunities
- 7.2.5.3.2. Market size and forecast, by Material
- 7.2.5.3.3. Market size and forecast, by Product
- 7.2.5.3.4. Market size and forecast, by End-use Industry
- 7.3. Europe
- 7.3.1. Key trends and opportunities
- 7.3.2. Market size and forecast, by Material
- 7.3.3. Market size and forecast, by Product
- 7.3.4. Market size and forecast, by End-use Industry
- 7.3.5. Market size and forecast, by country
- 7.3.5.1. Germany
- 7.3.5.1.1. Key market trends, growth factors and opportunities
- 7.3.5.1.2. Market size and forecast, by Material
- 7.3.5.1.3. Market size and forecast, by Product
- 7.3.5.1.4. Market size and forecast, by End-use Industry
- 7.3.5.2. UK
- 7.3.5.2.1. Key market trends, growth factors and opportunities
- 7.3.5.2.2. Market size and forecast, by Material
- 7.3.5.2.3. Market size and forecast, by Product
- 7.3.5.2.4. Market size and forecast, by End-use Industry
- 7.3.5.3. France
- 7.3.5.3.1. Key market trends, growth factors and opportunities
- 7.3.5.3.2. Market size and forecast, by Material
- 7.3.5.3.3. Market size and forecast, by Product
- 7.3.5.3.4. Market size and forecast, by End-use Industry
- 7.3.5.4. Spain
- 7.3.5.4.1. Key market trends, growth factors and opportunities
- 7.3.5.4.2. Market size and forecast, by Material
- 7.3.5.4.3. Market size and forecast, by Product
- 7.3.5.4.4. Market size and forecast, by End-use Industry
- 7.3.5.5. Italy
- 7.3.5.5.1. Key market trends, growth factors and opportunities
- 7.3.5.5.2. Market size and forecast, by Material
- 7.3.5.5.3. Market size and forecast, by Product
- 7.3.5.5.4. Market size and forecast, by End-use Industry
- 7.3.5.6. Rest of Europe
- 7.3.5.6.1. Key market trends, growth factors and opportunities
- 7.3.5.6.2. Market size and forecast, by Material
- 7.3.5.6.3. Market size and forecast, by Product
- 7.3.5.6.4. Market size and forecast, by End-use Industry
- 7.4. Asia-Pacific
- 7.4.1. Key trends and opportunities
- 7.4.2. Market size and forecast, by Material
- 7.4.3. Market size and forecast, by Product
- 7.4.4. Market size and forecast, by End-use Industry
- 7.4.5. Market size and forecast, by country
- 7.4.5.1. China
- 7.4.5.1.1. Key market trends, growth factors and opportunities
- 7.4.5.1.2. Market size and forecast, by Material
- 7.4.5.1.3. Market size and forecast, by Product
- 7.4.5.1.4. Market size and forecast, by End-use Industry
- 7.4.5.2. Japan
- 7.4.5.2.1. Key market trends, growth factors and opportunities
- 7.4.5.2.2. Market size and forecast, by Material
- 7.4.5.2.3. Market size and forecast, by Product
- 7.4.5.2.4. Market size and forecast, by End-use Industry
- 7.4.5.3. India
- 7.4.5.3.1. Key market trends, growth factors and opportunities
- 7.4.5.3.2. Market size and forecast, by Material
- 7.4.5.3.3. Market size and forecast, by Product
- 7.4.5.3.4. Market size and forecast, by End-use Industry
- 7.4.5.4. South Korea
- 7.4.5.4.1. Key market trends, growth factors and opportunities
- 7.4.5.4.2. Market size and forecast, by Material
- 7.4.5.4.3. Market size and forecast, by Product
- 7.4.5.4.4. Market size and forecast, by End-use Industry
- 7.4.5.5. Australia
- 7.4.5.5.1. Key market trends, growth factors and opportunities
- 7.4.5.5.2. Market size and forecast, by Material
- 7.4.5.5.3. Market size and forecast, by Product
- 7.4.5.5.4. Market size and forecast, by End-use Industry
- 7.4.5.6. Rest of Asia-Pacific
- 7.4.5.6.1. Key market trends, growth factors and opportunities
- 7.4.5.6.2. Market size and forecast, by Material
- 7.4.5.6.3. Market size and forecast, by Product
- 7.4.5.6.4. Market size and forecast, by End-use Industry
- 7.5. LAMEA
- 7.5.1. Key trends and opportunities
- 7.5.2. Market size and forecast, by Material
- 7.5.3. Market size and forecast, by Product
- 7.5.4. Market size and forecast, by End-use Industry
- 7.5.5. Market size and forecast, by country
- 7.5.5.1. Brazil
- 7.5.5.1.1. Key market trends, growth factors and opportunities
- 7.5.5.1.2. Market size and forecast, by Material
- 7.5.5.1.3. Market size and forecast, by Product
- 7.5.5.1.4. Market size and forecast, by End-use Industry
- 7.5.5.2. Saudi Arabia
- 7.5.5.2.1. Key market trends, growth factors and opportunities
- 7.5.5.2.2. Market size and forecast, by Material
- 7.5.5.2.3. Market size and forecast, by Product
- 7.5.5.2.4. Market size and forecast, by End-use Industry
- 7.5.5.3. UAE
- 7.5.5.3.1. Key market trends, growth factors and opportunities
- 7.5.5.3.2. Market size and forecast, by Material
- 7.5.5.3.3. Market size and forecast, by Product
- 7.5.5.3.4. Market size and forecast, by End-use Industry
- 7.5.5.4. South Africa
- 7.5.5.4.1. Key market trends, growth factors and opportunities
- 7.5.5.4.2. Market size and forecast, by Material
- 7.5.5.4.3. Market size and forecast, by Product
- 7.5.5.4.4. Market size and forecast, by End-use Industry
- 7.5.5.5. Rest of LAMEA
- 7.5.5.5.1. Key market trends, growth factors and opportunities
- 7.5.5.5.2. Market size and forecast, by Material
- 7.5.5.5.3. Market size and forecast, by Product
- 7.5.5.5.4. Market size and forecast, by End-use Industry
CHAPTER 8: COMPETITIVE LANDSCAPE
- 8.1. Introduction
- 8.2. Top winning strategies
- 8.3. Product Mapping of Top 10 Player
- 8.4. Competitive Dashboard
- 8.5. Competitive Heatmap
- 8.6. Top player positioning, 2022
CHAPTER 9: COMPANY PROFILES
- 9.1. Ansell Ltd.
- 9.1.1. Company overview
- 9.1.2. Key Executives
- 9.1.3. Company snapshot
- 9.2. 3M
- 9.2.1. Company overview
- 9.2.2. Key Executives
- 9.2.3. Company snapshot
- 9.3. VF Corporation
- 9.3.1. Company overview
- 9.3.2. Key Executives
- 9.3.3. Company snapshot
- 9.4. Honeywell International Inc.
- 9.4.1. Company overview
- 9.4.2. Key Executives
- 9.4.3. Company snapshot
- 9.5. Lakeland Inc.
- 9.5.1. Company overview
- 9.5.2. Key Executives
- 9.5.3. Company snapshot
- 9.6. Kimberly-Clark Corporation
- 9.6.1. Company overview
- 9.6.2. Key Executives
- 9.6.3. Company snapshot
- 9.7. DuPont
- 9.7.1. Company overview
- 9.7.2. Key Executives
- 9.7.3. Company snapshot
- 9.8. Solvay
- 9.8.1. Company overview
- 9.8.2. Key Executives
- 9.8.3. Company snapshot
- 9.9. International Enviroguard
- 9.9.1. Company overview
- 9.9.2. Key Executives
- 9.9.3. Company snapshot
- 9.10. W. L. Gore & Associates Inc.
- 9.10.1. Company overview
- 9.10.2. Key Executives
- 9.10.3. Company snapshot
LIST OF TABLES
- TABLE 01. GLOBAL FLAME RETARDANT PROTECTIVE WEAR MARKET, BY MATERIAL, 2022-2032 ($MILLION)
- TABLE 02. FLAME RETARDANT PROTECTIVE WEAR MARKET FOR KEVLAR, BY REGION, 2022-2032 ($MILLION)
- TABLE 03. FLAME RETARDANT PROTECTIVE WEAR MARKET FOR MODACRYLIC, BY REGION, 2022-2032 ($MILLION)
- TABLE 04. FLAME RETARDANT PROTECTIVE WEAR MARKET FOR NOMEX, BY REGION, 2022-2032 ($MILLION)
- TABLE 05. FLAME RETARDANT PROTECTIVE WEAR MARKET FOR OTHERS, BY REGION, 2022-2032 ($MILLION)
- TABLE 06. GLOBAL FLAME RETARDANT PROTECTIVE WEAR MARKET, BY PRODUCT, 2022-2032 ($MILLION)
- TABLE 07. FLAME RETARDANT PROTECTIVE WEAR MARKET FOR APRON, BY REGION, 2022-2032 ($MILLION)
- TABLE 08. FLAME RETARDANT PROTECTIVE WEAR MARKET FOR COAT, BY REGION, 2022-2032 ($MILLION)
- TABLE 09. FLAME RETARDANT PROTECTIVE WEAR MARKET FOR PANT, BY REGION, 2022-2032 ($MILLION)
- TABLE 10. FLAME RETARDANT PROTECTIVE WEAR MARKET FOR JACKET, BY REGION, 2022-2032 ($MILLION)
- TABLE 11. FLAME RETARDANT PROTECTIVE WEAR MARKET FOR SLEEVES, BY REGION, 2022-2032 ($MILLION)
- TABLE 12. FLAME RETARDANT PROTECTIVE WEAR MARKET FOR OTHERS, BY REGION, 2022-2032 ($MILLION)
- TABLE 13. GLOBAL FLAME RETARDANT PROTECTIVE WEAR MARKET, BY END-USE INDUSTRY, 2022-2032 ($MILLION)
- TABLE 14. FLAME RETARDANT PROTECTIVE WEAR MARKET FOR ELECTRICAL, BY REGION, 2022-2032 ($MILLION)
- TABLE 15. FLAME RETARDANT PROTECTIVE WEAR MARKET FOR OIL AND GAS, BY REGION, 2022-2032 ($MILLION)
- TABLE 16. FLAME RETARDANT PROTECTIVE WEAR MARKET FOR CONSTRUCTION AND MANUFACTURING, BY REGION, 2022-2032 ($MILLION)
- TABLE 17. FLAME RETARDANT PROTECTIVE WEAR MARKET FOR MINING, BY REGION, 2022-2032 ($MILLION)
- TABLE 18. FLAME RETARDANT PROTECTIVE WEAR MARKET FOR OTHERS, BY REGION, 2022-2032 ($MILLION)
- TABLE 19. FLAME RETARDANT PROTECTIVE WEAR MARKET, BY REGION, 2022-2032 ($MILLION)
- TABLE 20. NORTH AMERICA FLAME RETARDANT PROTECTIVE WEAR MARKET, BY MATERIAL, 2022-2032 ($MILLION)
- TABLE 21. NORTH AMERICA FLAME RETARDANT PROTECTIVE WEAR MARKET, BY PRODUCT, 2022-2032 ($MILLION)
- TABLE 22. NORTH AMERICA FLAME RETARDANT PROTECTIVE WEAR MARKET, BY END-USE INDUSTRY, 2022-2032 ($MILLION)
- TABLE 23. NORTH AMERICA FLAME RETARDANT PROTECTIVE WEAR MARKET, BY COUNTRY, 2022-2032 ($MILLION)
- TABLE 24. U.S. FLAME RETARDANT PROTECTIVE WEAR MARKET, BY MATERIAL, 2022-2032 ($MILLION)
- TABLE 25. U.S. FLAME RETARDANT PROTECTIVE WEAR MARKET, BY PRODUCT, 2022-2032 ($MILLION)
- TABLE 26. U.S. FLAME RETARDANT PROTECTIVE WEAR MARKET, BY END-USE INDUSTRY, 2022-2032 ($MILLION)
- TABLE 27. CANADA FLAME RETARDANT PROTECTIVE WEAR MARKET, BY MATERIAL, 2022-2032 ($MILLION)
- TABLE 28. CANADA FLAME RETARDANT PROTECTIVE WEAR MARKET, BY PRODUCT, 2022-2032 ($MILLION)
- TABLE 29. CANADA FLAME RETARDANT PROTECTIVE WEAR MARKET, BY END-USE INDUSTRY, 2022-2032 ($MILLION)
- TABLE 30. MEXICO FLAME RETARDANT PROTECTIVE WEAR MARKET, BY MATERIAL, 2022-2032 ($MILLION)
- TABLE 31. MEXICO FLAME RETARDANT PROTECTIVE WEAR MARKET, BY PRODUCT, 2022-2032 ($MILLION)
- TABLE 32. MEXICO FLAME RETARDANT PROTECTIVE WEAR MARKET, BY END-USE INDUSTRY, 2022-2032 ($MILLION)
- TABLE 33. EUROPE FLAME RETARDANT PROTECTIVE WEAR MARKET, BY MATERIAL, 2022-2032 ($MILLION)
- TABLE 34. EUROPE FLAME RETARDANT PROTECTIVE WEAR MARKET, BY PRODUCT, 2022-2032 ($MILLION)
- TABLE 35. EUROPE FLAME RETARDANT PROTECTIVE WEAR MARKET, BY END-USE INDUSTRY, 2022-2032 ($MILLION)
- TABLE 36. EUROPE FLAME RETARDANT PROTECTIVE WEAR MARKET, BY COUNTRY, 2022-2032 ($MILLION)
- TABLE 37. GERMANY FLAME RETARDANT PROTECTIVE WEAR MARKET, BY MATERIAL, 2022-2032 ($MILLION)
- TABLE 38. GERMANY FLAME RETARDANT PROTECTIVE WEAR MARKET, BY PRODUCT, 2022-2032 ($MILLION)
- TABLE 39. GERMANY FLAME RETARDANT PROTECTIVE WEAR MARKET, BY END-USE INDUSTRY, 2022-2032 ($MILLION)
- TABLE 40. UK FLAME RETARDANT PROTECTIVE WEAR MARKET, BY MATERIAL, 2022-2032 ($MILLION)
- TABLE 41. UK FLAME RETARDANT PROTECTIVE WEAR MARKET, BY PRODUCT, 2022-2032 ($MILLION)
- TABLE 42. UK FLAME RETARDANT PROTECTIVE WEAR MARKET, BY END-USE INDUSTRY, 2022-2032 ($MILLION)
- TABLE 43. FRANCE FLAME RETARDANT PROTECTIVE WEAR MARKET, BY MATERIAL, 2022-2032 ($MILLION)
- TABLE 44. FRANCE FLAME RETARDANT PROTECTIVE WEAR MARKET, BY PRODUCT, 2022-2032 ($MILLION)
- TABLE 45. FRANCE FLAME RETARDANT PROTECTIVE WEAR MARKET, BY END-USE INDUSTRY, 2022-2032 ($MILLION)
- TABLE 46. SPAIN FLAME RETARDANT PROTECTIVE WEAR MARKET, BY MATERIAL, 2022-2032 ($MILLION)
- TABLE 47. SPAIN FLAME RETARDANT PROTECTIVE WEAR MARKET, BY PRODUCT, 2022-2032 ($MILLION)
- TABLE 48. SPAIN FLAME RETARDANT PROTECTIVE WEAR MARKET, BY END-USE INDUSTRY, 2022-2032 ($MILLION)
- TABLE 49. ITALY FLAME RETARDANT PROTECTIVE WEAR MARKET, BY MATERIAL, 2022-2032 ($MILLION)
- TABLE 50. ITALY FLAME RETARDANT PROTECTIVE WEAR MARKET, BY PRODUCT, 2022-2032 ($MILLION)
- TABLE 51. ITALY FLAME RETARDANT PROTECTIVE WEAR MARKET, BY END-USE INDUSTRY, 2022-2032 ($MILLION)
- TABLE 52. REST OF EUROPE FLAME RETARDANT PROTECTIVE WEAR MARKET, BY MATERIAL, 2022-2032 ($MILLION)
- TABLE 53. REST OF EUROPE FLAME RETARDANT PROTECTIVE WEAR MARKET, BY PRODUCT, 2022-2032 ($MILLION)
- TABLE 54. REST OF EUROPE FLAME RETARDANT PROTECTIVE WEAR MARKET, BY END-USE INDUSTRY, 2022-2032 ($MILLION)
- TABLE 55. ASIA-PACIFIC FLAME RETARDANT PROTECTIVE WEAR MARKET, BY MATERIAL, 2022-2032 ($MILLION)
- TABLE 56. ASIA-PACIFIC FLAME RETARDANT PROTECTIVE WEAR MARKET, BY PRODUCT, 2022-2032 ($MILLION)
- TABLE 57. ASIA-PACIFIC FLAME RETARDANT PROTECTIVE WEAR MARKET, BY END-USE INDUSTRY, 2022-2032 ($MILLION)
- TABLE 58. ASIA-PACIFIC FLAME RETARDANT PROTECTIVE WEAR MARKET, BY COUNTRY, 2022-2032 ($MILLION)
- TABLE 59. CHINA FLAME RETARDANT PROTECTIVE WEAR MARKET, BY MATERIAL, 2022-2032 ($MILLION)
- TABLE 60. CHINA FLAME RETARDANT PROTECTIVE WEAR MARKET, BY PRODUCT, 2022-2032 ($MILLION)
- TABLE 61. CHINA FLAME RETARDANT PROTECTIVE WEAR MARKET, BY END-USE INDUSTRY, 2022-2032 ($MILLION)
- TABLE 62. JAPAN FLAME RETARDANT PROTECTIVE WEAR MARKET, BY MATERIAL, 2022-2032 ($MILLION)
- TABLE 63. JAPAN FLAME RETARDANT PROTECTIVE WEAR MARKET, BY PRODUCT, 2022-2032 ($MILLION)
- TABLE 64. JAPAN FLAME RETARDANT PROTECTIVE WEAR MARKET, BY END-USE INDUSTRY, 2022-2032 ($MILLION)
- TABLE 65. INDIA FLAME RETARDANT PROTECTIVE WEAR MARKET, BY MATERIAL, 2022-2032 ($MILLION)
- TABLE 66. INDIA FLAME RETARDANT PROTECTIVE WEAR MARKET, BY PRODUCT, 2022-2032 ($MILLION)
- TABLE 67. INDIA FLAME RETARDANT PROTECTIVE WEAR MARKET, BY END-USE INDUSTRY, 2022-2032 ($MILLION)
- TABLE 68. SOUTH KOREA FLAME RETARDANT PROTECTIVE WEAR MARKET, BY MATERIAL, 2022-2032 ($MILLION)
- TABLE 69. SOUTH KOREA FLAME RETARDANT PROTECTIVE WEAR MARKET, BY PRODUCT, 2022-2032 ($MILLION)
- TABLE 70. SOUTH KOREA FLAME RETARDANT PROTECTIVE WEAR MARKET, BY END-USE INDUSTRY, 2022-2032 ($MILLION)
- TABLE 71. AUSTRALIA FLAME RETARDANT PROTECTIVE WEAR MARKET, BY MATERIAL, 2022-2032 ($MILLION)
- TABLE 72. AUSTRALIA FLAME RETARDANT PROTECTIVE WEAR MARKET, BY PRODUCT, 2022-2032 ($MILLION)
- TABLE 73. AUSTRALIA FLAME RETARDANT PROTECTIVE WEAR MARKET, BY END-USE INDUSTRY, 2022-2032 ($MILLION)
- TABLE 74. REST OF ASIA-PACIFIC FLAME RETARDANT PROTECTIVE WEAR MARKET, BY MATERIAL, 2022-2032 ($MILLION)
- TABLE 75. REST OF ASIA-PACIFIC FLAME RETARDANT PROTECTIVE WEAR MARKET, BY PRODUCT, 2022-2032 ($MILLION)
- TABLE 76. REST OF ASIA-PACIFIC FLAME RETARDANT PROTECTIVE WEAR MARKET, BY END-USE INDUSTRY, 2022-2032 ($MILLION)
- TABLE 77. LAMEA FLAME RETARDANT PROTECTIVE WEAR MARKET, BY MATERIAL, 2022-2032 ($MILLION)
- TABLE 78. LAMEA FLAME RETARDANT PROTECTIVE WEAR MARKET, BY PRODUCT, 2022-2032 ($MILLION)
- TABLE 79. LAMEA FLAME RETARDANT PROTECTIVE WEAR MARKET, BY END-USE INDUSTRY, 2022-2032 ($MILLION)
- TABLE 80. LAMEA FLAME RETARDANT PROTECTIVE WEAR MARKET, BY COUNTRY, 2022-2032 ($MILLION)
- TABLE 81. BRAZIL FLAME RETARDANT PROTECTIVE WEAR MARKET, BY MATERIAL, 2022-2032 ($MILLION)
- TABLE 82. BRAZIL FLAME RETARDANT PROTECTIVE WEAR MARKET, BY PRODUCT, 2022-2032 ($MILLION)
- TABLE 83. BRAZIL FLAME RETARDANT PROTECTIVE WEAR MARKET, BY END-USE INDUSTRY, 2022-2032 ($MILLION)
- TABLE 84. SAUDI ARABIA FLAME RETARDANT PROTECTIVE WEAR MARKET, BY MATERIAL, 2022-2032 ($MILLION)
- TABLE 85. SAUDI ARABIA FLAME RETARDANT PROTECTIVE WEAR MARKET, BY PRODUCT, 2022-2032 ($MILLION)
- TABLE 86. SAUDI ARABIA FLAME RETARDANT PROTECTIVE WEAR MARKET, BY END-USE INDUSTRY, 2022-2032 ($MILLION)
- TABLE 87. UAE FLAME RETARDANT PROTECTIVE WEAR MARKET, BY MATERIAL, 2022-2032 ($MILLION)
- TABLE 88. UAE FLAME RETARDANT PROTECTIVE WEAR MARKET, BY PRODUCT, 2022-2032 ($MILLION)
- TABLE 89. UAE FLAME RETARDANT PROTECTIVE WEAR MARKET, BY END-USE INDUSTRY, 2022-2032 ($MILLION)
- TABLE 90. SOUTH AFRICA FLAME RETARDANT PROTECTIVE WEAR MARKET, BY MATERIAL, 2022-2032 ($MILLION)
- TABLE 91. SOUTH AFRICA FLAME RETARDANT PROTECTIVE WEAR MARKET, BY PRODUCT, 2022-2032 ($MILLION)
- TABLE 92. SOUTH AFRICA FLAME RETARDANT PROTECTIVE WEAR MARKET, BY END-USE INDUSTRY, 2022-2032 ($MILLION)
- TABLE 93. REST OF LAMEA FLAME RETARDANT PROTECTIVE WEAR MARKET, BY MATERIAL, 2022-2032 ($MILLION)
- TABLE 94. REST OF LAMEA FLAME RETARDANT PROTECTIVE WEAR MARKET, BY PRODUCT, 2022-2032 ($MILLION)
- TABLE 95. REST OF LAMEA FLAME RETARDANT PROTECTIVE WEAR MARKET, BY END-USE INDUSTRY, 2022-2032 ($MILLION)
- TABLE 96. ANSELL LTD.: KEY EXECUTIVES
- TABLE 97. ANSELL LTD.: COMPANY SNAPSHOT
- TABLE 98. 3M: KEY EXECUTIVES
- TABLE 99. 3M: COMPANY SNAPSHOT
- TABLE 100. VF CORPORATION: KEY EXECUTIVES
- TABLE 101. VF CORPORATION: COMPANY SNAPSHOT
- TABLE 102. HONEYWELL INTERNATIONAL INC.: KEY EXECUTIVES
- TABLE 103. HONEYWELL INTERNATIONAL INC.: COMPANY SNAPSHOT
- TABLE 104. LAKELAND INC.: KEY EXECUTIVES
- TABLE 105. LAKELAND INC.: COMPANY SNAPSHOT
- TABLE 106. KIMBERLY-CLARK CORPORATION: KEY EXECUTIVES
- TABLE 107. KIMBERLY-CLARK CORPORATION: COMPANY SNAPSHOT
- TABLE 108. DUPONT: KEY EXECUTIVES
- TABLE 109. DUPONT: COMPANY SNAPSHOT
- TABLE 110. SOLVAY: KEY EXECUTIVES
- TABLE 111. SOLVAY: COMPANY SNAPSHOT
- TABLE 112. INTERNATIONAL ENVIROGUARD: KEY EXECUTIVES
- TABLE 113. INTERNATIONAL ENVIROGUARD: COMPANY SNAPSHOT
- TABLE 114. W. L. GORE & ASSOCIATES INC.: KEY EXECUTIVES
- TABLE 115. W. L. GORE & ASSOCIATES INC.: COMPANY SNAPSHOT
LIST OF FIGURES
- FIGURE 01. FLAME RETARDANT PROTECTIVE WEAR MARKET, 2022-2032
- FIGURE 02. SEGMENTATION OF FLAME RETARDANT PROTECTIVE WEAR MARKET, 2022-2032
- FIGURE 03. TOP INVESTMENT POCKETS IN FLAME RETARDANT PROTECTIVE WEAR MARKET (2023-2032)
- FIGURE 04. PORTER FIVE-1
- FIGURE 05. PORTER FIVE-2
- FIGURE 06. PORTER FIVE-3
- FIGURE 07. PORTER FIVE-4
- FIGURE 08. PORTER FIVE-5
- FIGURE 09. DRIVERS, RESTRAINTS AND OPPORTUNITIES: GLOBALFLAME RETARDANT PROTECTIVE WEAR MARKET
- FIGURE 10. IMPACT OF KEY REGULATION: FLAME RETARDANT PROTECTIVE WEAR MARKET
- FIGURE 11. MARKET SHARE ANALYSIS: FLAME RETARDANT PROTECTIVE WEAR MARKET
- FIGURE 12. PATENT ANALYSIS BY COMPANY
- FIGURE 13. PATENT ANALYSIS BY COUNTRY
- FIGURE 14. REGULATORY GUIDELINES: FLAME RETARDANT PROTECTIVE WEAR MARKET
- FIGURE 15. VALUE CHAIN ANALYSIS: FLAME RETARDANT PROTECTIVE WEAR MARKET
- FIGURE 16. FLAME RETARDANT PROTECTIVE WEAR MARKET, BY MATERIAL, 2022(%)
- FIGURE 17. COMPARATIVE SHARE ANALYSIS OF FLAME RETARDANT PROTECTIVE WEAR MARKET FOR KEVLAR, BY COUNTRY 2022 AND 2032(%)
- FIGURE 18. COMPARATIVE SHARE ANALYSIS OF FLAME RETARDANT PROTECTIVE WEAR MARKET FOR MODACRYLIC, BY COUNTRY 2022 AND 2032(%)
- FIGURE 19. COMPARATIVE SHARE ANALYSIS OF FLAME RETARDANT PROTECTIVE WEAR MARKET FOR NOMEX, BY COUNTRY 2022 AND 2032(%)
- FIGURE 20. COMPARATIVE SHARE ANALYSIS OF FLAME RETARDANT PROTECTIVE WEAR MARKET FOR OTHERS, BY COUNTRY 2022 AND 2032(%)
- FIGURE 21. FLAME RETARDANT PROTECTIVE WEAR MARKET, BY PRODUCT, 2022(%)
- FIGURE 22. COMPARATIVE SHARE ANALYSIS OF FLAME RETARDANT PROTECTIVE WEAR MARKET FOR APRON, BY COUNTRY 2022 AND 2032(%)
- FIGURE 23. COMPARATIVE SHARE ANALYSIS OF FLAME RETARDANT PROTECTIVE WEAR MARKET FOR COAT, BY COUNTRY 2022 AND 2032(%)
- FIGURE 24. COMPARATIVE SHARE ANALYSIS OF FLAME RETARDANT PROTECTIVE WEAR MARKET FOR PANT, BY COUNTRY 2022 AND 2032(%)
- FIGURE 25. COMPARATIVE SHARE ANALYSIS OF FLAME RETARDANT PROTECTIVE WEAR MARKET FOR JACKET, BY COUNTRY 2022 AND 2032(%)
- FIGURE 26. COMPARATIVE SHARE ANALYSIS OF FLAME RETARDANT PROTECTIVE WEAR MARKET FOR SLEEVES, BY COUNTRY 2022 AND 2032(%)
- FIGURE 27. COMPARATIVE SHARE ANALYSIS OF FLAME RETARDANT PROTECTIVE WEAR MARKET FOR OTHERS, BY COUNTRY 2022 AND 2032(%)
- FIGURE 28. FLAME RETARDANT PROTECTIVE WEAR MARKET, BY END-USE INDUSTRY, 2022(%)
- FIGURE 29. COMPARATIVE SHARE ANALYSIS OF FLAME RETARDANT PROTECTIVE WEAR MARKET FOR ELECTRICAL, BY COUNTRY 2022 AND 2032(%)
- FIGURE 30. COMPARATIVE SHARE ANALYSIS OF FLAME RETARDANT PROTECTIVE WEAR MARKET FOR OIL AND GAS, BY COUNTRY 2022 AND 2032(%)
- FIGURE 31. COMPARATIVE SHARE ANALYSIS OF FLAME RETARDANT PROTECTIVE WEAR MARKET FOR CONSTRUCTION AND MANUFACTURING, BY COUNTRY 2022 AND 2032(%)
- FIGURE 32. COMPARATIVE SHARE ANALYSIS OF FLAME RETARDANT PROTECTIVE WEAR MARKET FOR MINING, BY COUNTRY 2022 AND 2032(%)
- FIGURE 33. COMPARATIVE SHARE ANALYSIS OF FLAME RETARDANT PROTECTIVE WEAR MARKET FOR OTHERS, BY COUNTRY 2022 AND 2032(%)
- FIGURE 34. FLAME RETARDANT PROTECTIVE WEAR MARKET BY REGION, 2022
- FIGURE 35. U.S. FLAME RETARDANT PROTECTIVE WEAR MARKET, 2022-2032 ($MILLION)
- FIGURE 36. CANADA FLAME RETARDANT PROTECTIVE WEAR MARKET, 2022-2032 ($MILLION)
- FIGURE 37. MEXICO FLAME RETARDANT PROTECTIVE WEAR MARKET, 2022-2032 ($MILLION)
- FIGURE 38. GERMANY FLAME RETARDANT PROTECTIVE WEAR MARKET, 2022-2032 ($MILLION)
- FIGURE 39. UK FLAME RETARDANT PROTECTIVE WEAR MARKET, 2022-2032 ($MILLION)
- FIGURE 40. FRANCE FLAME RETARDANT PROTECTIVE WEAR MARKET, 2022-2032 ($MILLION)
- FIGURE 41. SPAIN FLAME RETARDANT PROTECTIVE WEAR MARKET, 2022-2032 ($MILLION)
- FIGURE 42. ITALY FLAME RETARDANT PROTECTIVE WEAR MARKET, 2022-2032 ($MILLION)
- FIGURE 43. REST OF EUROPE FLAME RETARDANT PROTECTIVE WEAR MARKET, 2022-2032 ($MILLION)
- FIGURE 44. CHINA FLAME RETARDANT PROTECTIVE WEAR MARKET, 2022-2032 ($MILLION)
- FIGURE 45. JAPAN FLAME RETARDANT PROTECTIVE WEAR MARKET, 2022-2032 ($MILLION)
- FIGURE 46. INDIA FLAME RETARDANT PROTECTIVE WEAR MARKET, 2022-2032 ($MILLION)
- FIGURE 47. SOUTH KOREA FLAME RETARDANT PROTECTIVE WEAR MARKET, 2022-2032 ($MILLION)
- FIGURE 48. AUSTRALIA FLAME RETARDANT PROTECTIVE WEAR MARKET, 2022-2032 ($MILLION)
- FIGURE 49. REST OF ASIA-PACIFIC FLAME RETARDANT PROTECTIVE WEAR MARKET, 2022-2032 ($MILLION)
- FIGURE 50. BRAZIL FLAME RETARDANT PROTECTIVE WEAR MARKET, 2022-2032 ($MILLION)
- FIGURE 51. SAUDI ARABIA FLAME RETARDANT PROTECTIVE WEAR MARKET, 2022-2032 ($MILLION)
- FIGURE 52. UAE FLAME RETARDANT PROTECTIVE WEAR MARKET, 2022-2032 ($MILLION)
- FIGURE 53. SOUTH AFRICA FLAME RETARDANT PROTECTIVE WEAR MARKET, 2022-2032 ($MILLION)
- FIGURE 54. REST OF LAMEA FLAME RETARDANT PROTECTIVE WEAR MARKET, 2022-2032 ($MILLION)
- FIGURE 55. TOP WINNING STRATEGIES, BY YEAR
- FIGURE 56. TOP WINNING STRATEGIES, BY DEVELOPMENT
- FIGURE 57. TOP WINNING STRATEGIES, BY COMPANY
- FIGURE 58. PRODUCT MAPPING OF TOP 10 PLAYERS
- FIGURE 59. COMPETITIVE DASHBOARD
- FIGURE 60. COMPETITIVE HEATMAP: FLAME RETARDANT PROTECTIVE WEAR MARKET
- FIGURE 61. TOP PLAYER POSITIONING, 2022
 防火胶带市场:按材料、涂层类型、最终应用分类 - 2024-2030 年全球预测
 全球防火胶带市场:按涂层类型、类型、最终用途行业、地区划分 - 预测至 2028 年
 耐火液压油市场报告:2030 年趋势、预测与竞争分析
 2024 年防火布料全球市场报告
 防火织物市场:按类型、应用和最终用途行业划分 - 2024-2030 年全球预测
 耐火液压液市场(产品类型:水基和无水基;应用:金属加工、航空、船舶、采矿等)- 2023-2031 年全球产业分析、规模、份额、成长、趋势和预测
 全球耐火流体市场
 全球防火织物市场 - 2023-2030年
![防火织物市场:趋势、机遇、竞争分析 [2023-2028]](/sample/img/cover/42/1289737.png) 防火织物市场:趋势、机遇、竞争分析 [2023-2028]
防火织物市场:趋势、机遇、竞争分析 [2023-2028]![耐火材料市场:趋势、机遇、竞争分析 [2023-2028]](/sample/img/cover/42/1285030.png) 耐火材料市场:趋势、机遇、竞争分析 [2023-2028]
耐火材料市场:趋势、机遇、竞争分析 [2023-2028]