


 |
市场调查报告书
商品编码
1344468
防打鼾设备市场:各产品,各终端用户:全球机会分析与产业预测,2023-2032年Anti-Snoring Devices Market By Product (Mouthguard, Nasal devices, EPAP Device, Others), By End User (Homecare, Others): Global Opportunity Analysis and Industry Forecast, 2023-2032 |
||||||
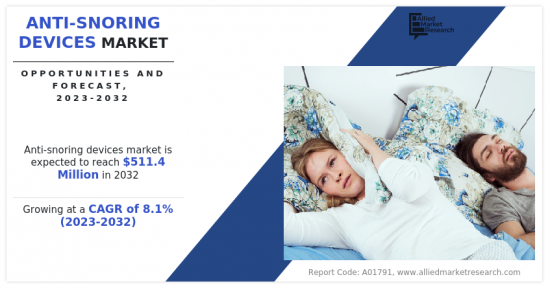
根据 Allied Market Research 发布的研究报告,2022 年止鼾器市值为 2.339 亿美元,2023 年至 2032 年复合年增长率为 8.1%,预计还将继续增长到2032年,预计2019年将达到5.114亿美元。
防打鼾设备旨在透过解决根本原因来减少或消除睡眠期间的打鼾。当透过口腔和鼻子的气流部分受阻,促使喉咙组织振动时,就会发生打鼾。市面上有各种类型的止鼾装置,包括下颚前突装置、舌头稳定装置、鼻扩张器和鼻带、持续性呼吸道正压通气(CPAP)装置和体位治疗装置。这些设备旨在透过解决打鼾的根本原因来改善打鼾者及其伴侣的睡眠品质。这些设备的有效性取决于个人和打鼾的具体原因。打鼾是一种常见病症,其特征是睡眠期间空气流动受阻促使呼吸结构振动。
目录
第1章 简介
第2章 摘要整理
第3章 市场概要
- 市场定义和范围
- 主要调查结果
- 影响要素
- 主要的投资机会
- 波特的五力分析
- 供给企业谈判力
- 买方议价能力
- 替代品的威胁
- 新加入厂商业者的威胁
- 竞争激烈度
- 市场动态
- 促进因素
- 打鼾的盛行率上升
- 打鼾相关风险的认识提升
- 阻碍因素
- 防打鼾设备伴随的不舒服和不便
- 机会
- 防打鼾设备的技术进步
- 促进因素
- COVID-19对市场的影响分析
第4章 防打鼾设备市场:各产品
- 概要
- 牙套
- 鼻腔设备
- EPAP设备
- 其他
第5章 防打鼾设备市场:各终端用户
- 概要
- 居家照护
- 其他
第6章 防打鼾设备市场:各地区
- 概要
- 北美
- 美国
- 加拿大
- 墨西哥
- 欧洲
- 德国
- 法国
- 英国
- 义大利
- 西班牙
- 其他欧洲
- 亚太地区
- 日本
- 中国
- 澳洲
- 印度
- 韩国
- 其他亚太地区
- 南美·中东·非洲
- 巴西
- 沙乌地阿拉伯
- 南非
- 其他地区
第7章 竞争情形
- 简介
- 主要成功策略
- 主要十大公司的产品製图
- 竞争仪表板
- 竞争热图
- 主要企业的定位,2022年
第8章 企业简介
- Apnea Sciences
- SomnoMed
- Airway Management, Inc
- ResMed Inc.
- Koninklijke Philips N.V.
- VVFLY Snore Circle
- Pure Sleep, LLC
- ZQuiet
- Rhinomed
- DentCare Dental Lab Pvt. Ltd
According to a new report published by Allied Market Research, titled, "Anti-Snoring Devices Market," The anti-snoring devices market was valued at $233.9 million in 2022, and is estimated to reach $511.4 million by 2032, growing at a CAGR of 8.1% from 2023 to 2032. Anti-snoring devices are designed to reduce or eliminate snoring during sleep by addressing the underlying causes. Snoring occurs when the flow of air through the mouth and nose is partially blocked, leading to vibrations in the throat tissues. There are various types of anti-snoring devices available in the market such as mandibular advancement devices, tongue stabilizing devices, nasal dilators and strips, continuous positive airway pressure (CPAP) machines, and positional therapy devices. By targeting the root causes of snoring, these devices aim to improve sleep quality for both the snorer and their sleep partner. The effectiveness of these devices varies depending on the individual and the specific causes of their snoring. Snoring is a common condition characterized by the vibration of respiratory structures due to obstructed air movement during sleep.
In addition, surge in awareness about health risks associated with snoring such as sleep apnea, high blood pressure, heart disease, and stroke further boost the market growth. For instance, according to Sleep Alliance about 90 million Americans suffer from snoring and half of them have obstructive sleep apnea (OSA). Thus, increase in awareness leads to high demand for anti-snoring devices as people actively seek treatment to reduce the risks associated with snoring.
However, anti-snoring devices may not work effectively for everyone due to different snoring patterns of each individual. Therefore, some individuals require more advanced treatments, such as surgery or continuous positive airway pressure (CPAP) machines, to manage their snoring. This limited efficacy for certain individuals limit the anti-snoring devices market growth. In addition, discomfort issues with certain anti-snoring devices lead to low usage rates and decreased satisfaction with the devices which negatively impact the market growth.
On the other hand, development of advanced anti-snoring devices and advancements in materials and manufacturing techniques lead to development of user-friendly anti-snoring devices which are expected to create immense opportunities for the growth of anti-snoring devices market during the forecast period. For instance, Dreem is a wearable device that combines a headband and mandibular advancement devices (MAD) technology. It incorporates sensors to monitor sleep patterns and detect snoring. This device helps to adjusts the position of lower jaw to reduce snoring during sleep.
The anti-snoring devices market is segmented on the basis of product, end user, and region. On the basis of product, the market is classified into mouthguard, nasal devices, EPAP device, and others. Others include sleeping aids, mask, chin strip, and other accessories. As per end user, the market is bifurcated into homecare and others. Others include hospital & clinic and sleep laboratory.
Region wise, the market is analyzed across North America (the U.S., Canada, and Mexico), Europe (Germany, France, the UK, Italy, Spain, and rest of Europe), Asia-Pacific (China, Japan, Australia, India, South Korea, and rest of Asia-Pacific), and LAMEA (Brazil, South Africa, Saudi Arabia, and rest of LAMEA).
Major key players that operate in the global anti-snoring devices market are SomnoMed, ResMed Inc., Koninklijke Philips N.V., VVFLY Snore Circle, ZQuiet, The Pure Sleep Company, Apnea Sciences, Airway Management, Inc., Rhinomed, and DentCare Dental Lab Pvt. Ltd.
Key Benefits For Stakeholders
- This report provides a quantitative analysis of the market segments, current trends, estimations, and dynamics of the anti-snoring devices market analysis from 2022 to 2032 to identify the prevailing anti-snoring devices market opportunities.
- The market research is offered along with information related to key drivers, restraints, and opportunities.
- Porter's five forces analysis highlights the potency of buyers and suppliers to enable stakeholders make profit-oriented business decisions and strengthen their supplier-buyer network.
- In-depth analysis of the anti-snoring devices market segmentation assists to determine the prevailing market opportunities.
- Major countries in each region are mapped according to their revenue contribution to the global market.
- Market player positioning facilitates benchmarking and provides a clear understanding of the present position of the market players.
- The report includes the analysis of the regional as well as global anti-snoring devices market trends, key players, market segments, application areas, and market growth strategies.
Key Market Segments
By Product
- Mouthguard
- Type
- Mandibular advancement devices
- Tongue retaining device
- Nasal devices
- EPAP Device
- Others
By End User
- Homecare
- Others
By Region
- North America
- U.S.
- Canada
- Mexico
- Europe
- Germany
- France
- UK
- Italy
- Spain
- Rest of Europe
- Asia-Pacific
- Japan
- China
- Australia
- India
- South Korea
- Rest of Asia-Pacific
- LAMEA
- Brazil
- Saudi Arabia
- South Africa
- Rest of LAMEA
Key Market Players:
- Pure Sleep, LLC
- ZQuiet
- ResMed Inc.
- Airway Management, Inc
- VVFLY Snore Circle
- Rhinomed
- DentCare Dental Lab Pvt. Ltd
- Koninklijke Philips N.V.
- Apnea Sciences
- SomnoMed
TABLE OF CONTENTS
CHAPTER 1: INTRODUCTION
- 1.1. Report description
- 1.2. Key market segments
- 1.3. Key benefits to the stakeholders
- 1.4. Research Methodology
- 1.4.1. Primary research
- 1.4.2. Secondary research
- 1.4.3. Analyst tools and models
CHAPTER 2: EXECUTIVE SUMMARY
- 2.1. CXO Perspective
CHAPTER 3: MARKET OVERVIEW
- 3.1. Market definition and scope
- 3.2. Key findings
- 3.2.1. Top impacting factors
- 3.2.2. Top investment pockets
- 3.3. Porter's five forces analysis
- 3.3.1. Bargaining power of suppliers
- 3.3.2. Bargaining power of buyers
- 3.3.3. Threat of substitutes
- 3.3.4. Threat of new entrants
- 3.3.5. Intensity of rivalry
- 3.4. Market dynamics
- 3.4.1. Drivers
- 3.4.1.1. Rise in prevalence of snoring
- 3.4.1.2. Increase in awareness about the risks associated with snoring
- 3.4.1. Drivers
- 3.4.2. Restraints
- 3.4.2.1. Discomfort and inconvenience associated with anti-snoring devices
- 3.4.3. Opportunities
- 3.4.3.1. Technological advancements in anti-snoring devices
- 3.5. COVID-19 Impact Analysis on the market
CHAPTER 4: ANTI-SNORING DEVICES MARKET, BY PRODUCT
- 4.1. Overview
- 4.1.1. Market size and forecast
- 4.2. Mouthguard
- 4.2.1. Key market trends, growth factors and opportunities
- 4.2.2. Market size and forecast, by region
- 4.2.3. Market share analysis by country
- 4.2.4. Mouthguard Anti-Snoring Devices Market by Type
- 4.3. Nasal devices
- 4.3.1. Key market trends, growth factors and opportunities
- 4.3.2. Market size and forecast, by region
- 4.3.3. Market share analysis by country
- 4.4. EPAP Device
- 4.4.1. Key market trends, growth factors and opportunities
- 4.4.2. Market size and forecast, by region
- 4.4.3. Market share analysis by country
- 4.5. Others
- 4.5.1. Key market trends, growth factors and opportunities
- 4.5.2. Market size and forecast, by region
- 4.5.3. Market share analysis by country
CHAPTER 5: ANTI-SNORING DEVICES MARKET, BY END USER
- 5.1. Overview
- 5.1.1. Market size and forecast
- 5.2. Homecare
- 5.2.1. Key market trends, growth factors and opportunities
- 5.2.2. Market size and forecast, by region
- 5.2.3. Market share analysis by country
- 5.3. Others
- 5.3.1. Key market trends, growth factors and opportunities
- 5.3.2. Market size and forecast, by region
- 5.3.3. Market share analysis by country
CHAPTER 6: ANTI-SNORING DEVICES MARKET, BY REGION
- 6.1. Overview
- 6.1.1. Market size and forecast By Region
- 6.2. North America
- 6.2.1. Key trends and opportunities
- 6.2.2. Market size and forecast, by Product
- 6.2.3. Market size and forecast, by End User
- 6.2.4. Market size and forecast, by country
- 6.2.4.1. U.S.
- 6.2.4.1.1. Key market trends, growth factors and opportunities
- 6.2.4.1.2. Market size and forecast, by Product
- 6.2.4.1.3. Market size and forecast, by End User
- 6.2.4.2. Canada
- 6.2.4.2.1. Key market trends, growth factors and opportunities
- 6.2.4.2.2. Market size and forecast, by Product
- 6.2.4.2.3. Market size and forecast, by End User
- 6.2.4.3. Mexico
- 6.2.4.3.1. Key market trends, growth factors and opportunities
- 6.2.4.3.2. Market size and forecast, by Product
- 6.2.4.3.3. Market size and forecast, by End User
- 6.3. Europe
- 6.3.1. Key trends and opportunities
- 6.3.2. Market size and forecast, by Product
- 6.3.3. Market size and forecast, by End User
- 6.3.4. Market size and forecast, by country
- 6.3.4.1. Germany
- 6.3.4.1.1. Key market trends, growth factors and opportunities
- 6.3.4.1.2. Market size and forecast, by Product
- 6.3.4.1.3. Market size and forecast, by End User
- 6.3.4.2. France
- 6.3.4.2.1. Key market trends, growth factors and opportunities
- 6.3.4.2.2. Market size and forecast, by Product
- 6.3.4.2.3. Market size and forecast, by End User
- 6.3.4.3. UK
- 6.3.4.3.1. Key market trends, growth factors and opportunities
- 6.3.4.3.2. Market size and forecast, by Product
- 6.3.4.3.3. Market size and forecast, by End User
- 6.3.4.4. Italy
- 6.3.4.4.1. Key market trends, growth factors and opportunities
- 6.3.4.4.2. Market size and forecast, by Product
- 6.3.4.4.3. Market size and forecast, by End User
- 6.3.4.5. Spain
- 6.3.4.5.1. Key market trends, growth factors and opportunities
- 6.3.4.5.2. Market size and forecast, by Product
- 6.3.4.5.3. Market size and forecast, by End User
- 6.3.4.6. Rest of Europe
- 6.3.4.6.1. Key market trends, growth factors and opportunities
- 6.3.4.6.2. Market size and forecast, by Product
- 6.3.4.6.3. Market size and forecast, by End User
- 6.4. Asia-Pacific
- 6.4.1. Key trends and opportunities
- 6.4.2. Market size and forecast, by Product
- 6.4.3. Market size and forecast, by End User
- 6.4.4. Market size and forecast, by country
- 6.4.4.1. Japan
- 6.4.4.1.1. Key market trends, growth factors and opportunities
- 6.4.4.1.2. Market size and forecast, by Product
- 6.4.4.1.3. Market size and forecast, by End User
- 6.4.4.2. China
- 6.4.4.2.1. Key market trends, growth factors and opportunities
- 6.4.4.2.2. Market size and forecast, by Product
- 6.4.4.2.3. Market size and forecast, by End User
- 6.4.4.3. Australia
- 6.4.4.3.1. Key market trends, growth factors and opportunities
- 6.4.4.3.2. Market size and forecast, by Product
- 6.4.4.3.3. Market size and forecast, by End User
- 6.4.4.4. India
- 6.4.4.4.1. Key market trends, growth factors and opportunities
- 6.4.4.4.2. Market size and forecast, by Product
- 6.4.4.4.3. Market size and forecast, by End User
- 6.4.4.5. South Korea
- 6.4.4.5.1. Key market trends, growth factors and opportunities
- 6.4.4.5.2. Market size and forecast, by Product
- 6.4.4.5.3. Market size and forecast, by End User
- 6.4.4.6. Rest of Asia-Pacific
- 6.4.4.6.1. Key market trends, growth factors and opportunities
- 6.4.4.6.2. Market size and forecast, by Product
- 6.4.4.6.3. Market size and forecast, by End User
- 6.5. LAMEA
- 6.5.1. Key trends and opportunities
- 6.5.2. Market size and forecast, by Product
- 6.5.3. Market size and forecast, by End User
- 6.5.4. Market size and forecast, by country
- 6.5.4.1. Brazil
- 6.5.4.1.1. Key market trends, growth factors and opportunities
- 6.5.4.1.2. Market size and forecast, by Product
- 6.5.4.1.3. Market size and forecast, by End User
- 6.5.4.2. Saudi Arabia
- 6.5.4.2.1. Key market trends, growth factors and opportunities
- 6.5.4.2.2. Market size and forecast, by Product
- 6.5.4.2.3. Market size and forecast, by End User
- 6.5.4.3. South Africa
- 6.5.4.3.1. Key market trends, growth factors and opportunities
- 6.5.4.3.2. Market size and forecast, by Product
- 6.5.4.3.3. Market size and forecast, by End User
- 6.5.4.4. Rest of LAMEA
- 6.5.4.4.1. Key market trends, growth factors and opportunities
- 6.5.4.4.2. Market size and forecast, by Product
- 6.5.4.4.3. Market size and forecast, by End User
CHAPTER 7: COMPETITIVE LANDSCAPE
- 7.1. Introduction
- 7.2. Top winning strategies
- 7.3. Product Mapping of Top 10 Player
- 7.4. Competitive Dashboard
- 7.5. Competitive Heatmap
- 7.6. Top player positioning, 2022
CHAPTER 8: COMPANY PROFILES
- 8.1. Apnea Sciences
- 8.1.1. Company overview
- 8.1.2. Key Executives
- 8.1.3. Company snapshot
- 8.1.4. Operating business segments
- 8.1.5. Product portfolio
- 8.1.6. Key strategic moves and developments
- 8.2. SomnoMed
- 8.2.1. Company overview
- 8.2.2. Key Executives
- 8.2.3. Company snapshot
- 8.2.4. Operating business segments
- 8.2.5. Product portfolio
- 8.2.6. Business performance
- 8.3. Airway Management, Inc
- 8.3.1. Company overview
- 8.3.2. Key Executives
- 8.3.3. Company snapshot
- 8.3.4. Operating business segments
- 8.3.5. Product portfolio
- 8.4. ResMed Inc.
- 8.4.1. Company overview
- 8.4.2. Key Executives
- 8.4.3. Company snapshot
- 8.4.4. Operating business segments
- 8.4.5. Product portfolio
- 8.4.6. Business performance
- 8.5. Koninklijke Philips N.V.
- 8.5.1. Company overview
- 8.5.2. Key Executives
- 8.5.3. Company snapshot
- 8.5.4. Operating business segments
- 8.5.5. Product portfolio
- 8.5.6. Business performance
- 8.6. VVFLY Snore Circle
- 8.6.1. Company overview
- 8.6.2. Key Executives
- 8.6.3. Company snapshot
- 8.6.4. Operating business segments
- 8.6.5. Product portfolio
- 8.7. Pure Sleep, LLC
- 8.7.1. Company overview
- 8.7.2. Key Executives
- 8.7.3. Company snapshot
- 8.7.4. Operating business segments
- 8.7.5. Product portfolio
- 8.8. ZQuiet
- 8.8.1. Company overview
- 8.8.2. Key Executives
- 8.8.3. Company snapshot
- 8.8.4. Operating business segments
- 8.8.5. Product portfolio
- 8.9. Rhinomed
- 8.9.1. Company overview
- 8.9.2. Key Executives
- 8.9.3. Company snapshot
- 8.9.4. Operating business segments
- 8.9.5. Product portfolio
- 8.9.6. Business performance
- 8.10. DentCare Dental Lab Pvt. Ltd
- 8.10.1. Company overview
- 8.10.2. Key Executives
- 8.10.3. Company snapshot
- 8.10.4. Operating business segments
- 8.10.5. Product portfolio
LIST OF TABLES
- TABLE 01. GLOBAL ANTI-SNORING DEVICES MARKET, BY PRODUCT, 2022-2032 ($MILLION)
- TABLE 02. ANTI-SNORING DEVICES MARKET FOR MOUTHGUARD, BY REGION, 2022-2032 ($MILLION)
- TABLE 03. GLOBAL MOUTHGUARD ANTI-SNORING DEVICES MARKET, BY TYPE, 2022-2032 ($MILLION)
- TABLE 04. ANTI-SNORING DEVICES MARKET FOR NASAL DEVICES, BY REGION, 2022-2032 ($MILLION)
- TABLE 05. ANTI-SNORING DEVICES MARKET FOR EPAP DEVICE, BY REGION, 2022-2032 ($MILLION)
- TABLE 06. ANTI-SNORING DEVICES MARKET FOR OTHERS, BY REGION, 2022-2032 ($MILLION)
- TABLE 07. GLOBAL ANTI-SNORING DEVICES MARKET, BY END USER, 2022-2032 ($MILLION)
- TABLE 08. ANTI-SNORING DEVICES MARKET FOR HOMECARE, BY REGION, 2022-2032 ($MILLION)
- TABLE 09. ANTI-SNORING DEVICES MARKET FOR OTHERS, BY REGION, 2022-2032 ($MILLION)
- TABLE 10. ANTI-SNORING DEVICES MARKET, BY REGION, 2022-2032 ($MILLION)
- TABLE 11. NORTH AMERICA ANTI-SNORING DEVICES MARKET, BY PRODUCT, 2022-2032 ($MILLION)
- TABLE 12. NORTH AMERICA ANTI-SNORING DEVICES MARKET, BY END USER, 2022-2032 ($MILLION)
- TABLE 13. NORTH AMERICA ANTI-SNORING DEVICES MARKET, BY COUNTRY, 2022-2032 ($MILLION)
- TABLE 14. U.S. ANTI-SNORING DEVICES MARKET, BY PRODUCT, 2022-2032 ($MILLION)
- TABLE 15. U.S. ANTI-SNORING DEVICES MARKET, BY END USER, 2022-2032 ($MILLION)
- TABLE 16. CANADA ANTI-SNORING DEVICES MARKET, BY PRODUCT, 2022-2032 ($MILLION)
- TABLE 17. CANADA ANTI-SNORING DEVICES MARKET, BY END USER, 2022-2032 ($MILLION)
- TABLE 18. MEXICO ANTI-SNORING DEVICES MARKET, BY PRODUCT, 2022-2032 ($MILLION)
- TABLE 19. MEXICO ANTI-SNORING DEVICES MARKET, BY END USER, 2022-2032 ($MILLION)
- TABLE 20. EUROPE ANTI-SNORING DEVICES MARKET, BY PRODUCT, 2022-2032 ($MILLION)
- TABLE 21. EUROPE ANTI-SNORING DEVICES MARKET, BY END USER, 2022-2032 ($MILLION)
- TABLE 22. EUROPE ANTI-SNORING DEVICES MARKET, BY COUNTRY, 2022-2032 ($MILLION)
- TABLE 23. GERMANY ANTI-SNORING DEVICES MARKET, BY PRODUCT, 2022-2032 ($MILLION)
- TABLE 24. GERMANY ANTI-SNORING DEVICES MARKET, BY END USER, 2022-2032 ($MILLION)
- TABLE 25. FRANCE ANTI-SNORING DEVICES MARKET, BY PRODUCT, 2022-2032 ($MILLION)
- TABLE 26. FRANCE ANTI-SNORING DEVICES MARKET, BY END USER, 2022-2032 ($MILLION)
- TABLE 27. UK ANTI-SNORING DEVICES MARKET, BY PRODUCT, 2022-2032 ($MILLION)
- TABLE 28. UK ANTI-SNORING DEVICES MARKET, BY END USER, 2022-2032 ($MILLION)
- TABLE 29. ITALY ANTI-SNORING DEVICES MARKET, BY PRODUCT, 2022-2032 ($MILLION)
- TABLE 30. ITALY ANTI-SNORING DEVICES MARKET, BY END USER, 2022-2032 ($MILLION)
- TABLE 31. SPAIN ANTI-SNORING DEVICES MARKET, BY PRODUCT, 2022-2032 ($MILLION)
- TABLE 32. SPAIN ANTI-SNORING DEVICES MARKET, BY END USER, 2022-2032 ($MILLION)
- TABLE 33. REST OF EUROPE ANTI-SNORING DEVICES MARKET, BY PRODUCT, 2022-2032 ($MILLION)
- TABLE 34. REST OF EUROPE ANTI-SNORING DEVICES MARKET, BY END USER, 2022-2032 ($MILLION)
- TABLE 35. ASIA-PACIFIC ANTI-SNORING DEVICES MARKET, BY PRODUCT, 2022-2032 ($MILLION)
- TABLE 36. ASIA-PACIFIC ANTI-SNORING DEVICES MARKET, BY END USER, 2022-2032 ($MILLION)
- TABLE 37. ASIA-PACIFIC ANTI-SNORING DEVICES MARKET, BY COUNTRY, 2022-2032 ($MILLION)
- TABLE 38. JAPAN ANTI-SNORING DEVICES MARKET, BY PRODUCT, 2022-2032 ($MILLION)
- TABLE 39. JAPAN ANTI-SNORING DEVICES MARKET, BY END USER, 2022-2032 ($MILLION)
- TABLE 40. CHINA ANTI-SNORING DEVICES MARKET, BY PRODUCT, 2022-2032 ($MILLION)
- TABLE 41. CHINA ANTI-SNORING DEVICES MARKET, BY END USER, 2022-2032 ($MILLION)
- TABLE 42. AUSTRALIA ANTI-SNORING DEVICES MARKET, BY PRODUCT, 2022-2032 ($MILLION)
- TABLE 43. AUSTRALIA ANTI-SNORING DEVICES MARKET, BY END USER, 2022-2032 ($MILLION)
- TABLE 44. INDIA ANTI-SNORING DEVICES MARKET, BY PRODUCT, 2022-2032 ($MILLION)
- TABLE 45. INDIA ANTI-SNORING DEVICES MARKET, BY END USER, 2022-2032 ($MILLION)
- TABLE 46. SOUTH KOREA ANTI-SNORING DEVICES MARKET, BY PRODUCT, 2022-2032 ($MILLION)
- TABLE 47. SOUTH KOREA ANTI-SNORING DEVICES MARKET, BY END USER, 2022-2032 ($MILLION)
- TABLE 48. REST OF ASIA-PACIFIC ANTI-SNORING DEVICES MARKET, BY PRODUCT, 2022-2032 ($MILLION)
- TABLE 49. REST OF ASIA-PACIFIC ANTI-SNORING DEVICES MARKET, BY END USER, 2022-2032 ($MILLION)
- TABLE 50. LAMEA ANTI-SNORING DEVICES MARKET, BY PRODUCT, 2022-2032 ($MILLION)
- TABLE 51. LAMEA ANTI-SNORING DEVICES MARKET, BY END USER, 2022-2032 ($MILLION)
- TABLE 52. LAMEA ANTI-SNORING DEVICES MARKET, BY COUNTRY, 2022-2032 ($MILLION)
- TABLE 53. BRAZIL ANTI-SNORING DEVICES MARKET, BY PRODUCT, 2022-2032 ($MILLION)
- TABLE 54. BRAZIL ANTI-SNORING DEVICES MARKET, BY END USER, 2022-2032 ($MILLION)
- TABLE 55. SAUDI ARABIA ANTI-SNORING DEVICES MARKET, BY PRODUCT, 2022-2032 ($MILLION)
- TABLE 56. SAUDI ARABIA ANTI-SNORING DEVICES MARKET, BY END USER, 2022-2032 ($MILLION)
- TABLE 57. SOUTH AFRICA ANTI-SNORING DEVICES MARKET, BY PRODUCT, 2022-2032 ($MILLION)
- TABLE 58. SOUTH AFRICA ANTI-SNORING DEVICES MARKET, BY END USER, 2022-2032 ($MILLION)
- TABLE 59. REST OF LAMEA ANTI-SNORING DEVICES MARKET, BY PRODUCT, 2022-2032 ($MILLION)
- TABLE 60. REST OF LAMEA ANTI-SNORING DEVICES MARKET, BY END USER, 2022-2032 ($MILLION)
- TABLE 61. APNEA SCIENCES: KEY EXECUTIVES
- TABLE 62. APNEA SCIENCES: COMPANY SNAPSHOT
- TABLE 63. APNEA SCIENCES: PRODUCT SEGMENTS
- TABLE 64. APNEA SCIENCES: PRODUCT PORTFOLIO
- TABLE 65. APNEA SCIENCES: KEY STRATERGIES
- TABLE 66. SOMNOMED: KEY EXECUTIVES
- TABLE 67. SOMNOMED: COMPANY SNAPSHOT
- TABLE 68. SOMNOMED: PRODUCT SEGMENTS
- TABLE 69. SOMNOMED: PRODUCT PORTFOLIO
- TABLE 70. AIRWAY MANAGEMENT, INC: KEY EXECUTIVES
- TABLE 71. AIRWAY MANAGEMENT, INC: COMPANY SNAPSHOT
- TABLE 72. AIRWAY MANAGEMENT, INC: PRODUCT SEGMENTS
- TABLE 73. AIRWAY MANAGEMENT, INC: PRODUCT PORTFOLIO
- TABLE 74. RESMED INC.: KEY EXECUTIVES
- TABLE 75. RESMED INC.: COMPANY SNAPSHOT
- TABLE 76. RESMED INC.: PRODUCT SEGMENTS
- TABLE 77. RESMED INC.: PRODUCT PORTFOLIO
- TABLE 78. KONINKLIJKE PHILIPS N.V.: KEY EXECUTIVES
- TABLE 79. KONINKLIJKE PHILIPS N.V.: COMPANY SNAPSHOT
- TABLE 80. KONINKLIJKE PHILIPS N.V.: PRODUCT SEGMENTS
- TABLE 81. KONINKLIJKE PHILIPS N.V.: PRODUCT PORTFOLIO
- TABLE 82. VVFLY SNORE CIRCLE: KEY EXECUTIVES
- TABLE 83. VVFLY SNORE CIRCLE: COMPANY SNAPSHOT
- TABLE 84. VVFLY SNORE CIRCLE: PRODUCT SEGMENTS
- TABLE 85. VVFLY SNORE CIRCLE: PRODUCT PORTFOLIO
- TABLE 86. PURE SLEEP, LLC: KEY EXECUTIVES
- TABLE 87. PURE SLEEP, LLC: COMPANY SNAPSHOT
- TABLE 88. PURE SLEEP, LLC: PRODUCT SEGMENTS
- TABLE 89. PURE SLEEP, LLC: PRODUCT PORTFOLIO
- TABLE 90. ZQUIET: KEY EXECUTIVES
- TABLE 91. ZQUIET: COMPANY SNAPSHOT
- TABLE 92. ZQUIET: PRODUCT SEGMENTS
- TABLE 93. ZQUIET: PRODUCT PORTFOLIO
- TABLE 94. RHINOMED: KEY EXECUTIVES
- TABLE 95. RHINOMED: COMPANY SNAPSHOT
- TABLE 96. RHINOMED: PRODUCT SEGMENTS
- TABLE 97. RHINOMED: PRODUCT PORTFOLIO
- TABLE 98. DENTCARE DENTAL LAB PVT. LTD: KEY EXECUTIVES
- TABLE 99. DENTCARE DENTAL LAB PVT. LTD: COMPANY SNAPSHOT
- TABLE 100. DENTCARE DENTAL LAB PVT. LTD: PRODUCT SEGMENTS
- TABLE 101. DENTCARE DENTAL LAB PVT. LTD: PRODUCT PORTFOLIO
LIST OF FIGURES
- FIGURE 01. ANTI-SNORING DEVICES MARKET, 2022-2032
- FIGURE 02. SEGMENTATION OF ANTI-SNORING DEVICES MARKET, 2022-2032
- FIGURE 03. TOP INVESTMENT POCKETS IN ANTI-SNORING DEVICES MARKET (2023-2032)
- FIGURE 04. MODERATE BARGAINING POWER OF SUPPLIERS
- FIGURE 05. MODERATE BARGAINING POWER OF BUYERS
- FIGURE 06. LOW THREAT OF SUBSTITUTES
- FIGURE 07. MODERATE THREAT OF NEW ENTRANTS
- FIGURE 08. LOW INTENSITY OF RIVALRY
- FIGURE 09. DRIVERS, RESTRAINTS AND OPPORTUNITIES: GLOBALANTI-SNORING DEVICES MARKET
- FIGURE 10. ANTI-SNORING DEVICES MARKET, BY PRODUCT, 2022(%)
- FIGURE 11. COMPARATIVE SHARE ANALYSIS OF ANTI-SNORING DEVICES MARKET FOR MOUTHGUARD, BY COUNTRY 2022 AND 2032(%)
- FIGURE 12. COMPARATIVE SHARE ANALYSIS OF ANTI-SNORING DEVICES MARKET FOR NASAL DEVICES, BY COUNTRY 2022 AND 2032(%)
- FIGURE 13. COMPARATIVE SHARE ANALYSIS OF ANTI-SNORING DEVICES MARKET FOR EPAP DEVICE, BY COUNTRY 2022 AND 2032(%)
- FIGURE 14. COMPARATIVE SHARE ANALYSIS OF ANTI-SNORING DEVICES MARKET FOR OTHERS, BY COUNTRY 2022 AND 2032(%)
- FIGURE 15. ANTI-SNORING DEVICES MARKET, BY END USER, 2022(%)
- FIGURE 16. COMPARATIVE SHARE ANALYSIS OF ANTI-SNORING DEVICES MARKET FOR HOMECARE, BY COUNTRY 2022 AND 2032(%)
- FIGURE 17. COMPARATIVE SHARE ANALYSIS OF ANTI-SNORING DEVICES MARKET FOR OTHERS, BY COUNTRY 2022 AND 2032(%)
- FIGURE 18. ANTI-SNORING DEVICES MARKET BY REGION, 2022
- FIGURE 19. U.S. ANTI-SNORING DEVICES MARKET, 2022-2032 ($MILLION)
- FIGURE 20. CANADA ANTI-SNORING DEVICES MARKET, 2022-2032 ($MILLION)
- FIGURE 21. MEXICO ANTI-SNORING DEVICES MARKET, 2022-2032 ($MILLION)
- FIGURE 22. GERMANY ANTI-SNORING DEVICES MARKET, 2022-2032 ($MILLION)
- FIGURE 23. FRANCE ANTI-SNORING DEVICES MARKET, 2022-2032 ($MILLION)
- FIGURE 24. UK ANTI-SNORING DEVICES MARKET, 2022-2032 ($MILLION)
- FIGURE 25. ITALY ANTI-SNORING DEVICES MARKET, 2022-2032 ($MILLION)
- FIGURE 26. SPAIN ANTI-SNORING DEVICES MARKET, 2022-2032 ($MILLION)
- FIGURE 27. REST OF EUROPE ANTI-SNORING DEVICES MARKET, 2022-2032 ($MILLION)
- FIGURE 28. JAPAN ANTI-SNORING DEVICES MARKET, 2022-2032 ($MILLION)
- FIGURE 29. CHINA ANTI-SNORING DEVICES MARKET, 2022-2032 ($MILLION)
- FIGURE 30. AUSTRALIA ANTI-SNORING DEVICES MARKET, 2022-2032 ($MILLION)
- FIGURE 31. INDIA ANTI-SNORING DEVICES MARKET, 2022-2032 ($MILLION)
- FIGURE 32. SOUTH KOREA ANTI-SNORING DEVICES MARKET, 2022-2032 ($MILLION)
- FIGURE 33. REST OF ASIA-PACIFIC ANTI-SNORING DEVICES MARKET, 2022-2032 ($MILLION)
- FIGURE 34. BRAZIL ANTI-SNORING DEVICES MARKET, 2022-2032 ($MILLION)
- FIGURE 35. SAUDI ARABIA ANTI-SNORING DEVICES MARKET, 2022-2032 ($MILLION)
- FIGURE 36. SOUTH AFRICA ANTI-SNORING DEVICES MARKET, 2022-2032 ($MILLION)
- FIGURE 37. REST OF LAMEA ANTI-SNORING DEVICES MARKET, 2022-2032 ($MILLION)
- FIGURE 38. TOP WINNING STRATEGIES, BY YEAR
- FIGURE 39. TOP WINNING STRATEGIES, BY DEVELOPMENT
- FIGURE 40. TOP WINNING STRATEGIES, BY COMPANY
- FIGURE 41. PRODUCT MAPPING OF TOP 10 PLAYERS
- FIGURE 42. COMPETITIVE DASHBOARD
- FIGURE 43. COMPETITIVE HEATMAP: ANTI-SNORING DEVICES MARKET
- FIGURE 44. TOP PLAYER POSITIONING, 2022
- FIGURE 45. SOMNOMED: NET REVENUE, 2020-2022 ($MILLION)
- FIGURE 46. RESMED INC.: NET REVENUE, 2020-2022 ($MILLION)
- FIGURE 47. RESMED INC.: REVENUE SHARE BY SEGMENT, 2022 (%)
- FIGURE 48. RESMED INC.: REVENUE SHARE BY REGION, 2022 (%)
- FIGURE 49. KONINKLIJKE PHILIPS N.V.: NET SALES, 2020-2022 ($MILLION)
- FIGURE 50. KONINKLIJKE PHILIPS N.V.: REVENUE SHARE BY SEGMENT, 2022 (%)
- FIGURE 51. KONINKLIJKE PHILIPS N.V.: REVENUE SHARE BY REGION, 2022 (%)
- FIGURE 52. RHINOMED: NET REVENUE, 2020-2022 ($MILLION)
 2032 年防打鼾设备市场预测:按产品类型、分销管道、最终用户和地区进行的全球分析
 防打鼾设备和打鼾手术市场 - 全球产业规模、份额、趋势、机会和预测,按类型、地区和竞争细分,2020-2030 年2025 年全球防打鼾设备市场报告
 防打鼾设备市场按设备类型、性别、年龄层、分销管道、最终用户和地区划分 - 预测至 2029 年防打鼾设备和打鼾手术市场规模、份额、成长分析(按设备类型、手术方法、最终用户、地区)- 2025-2032 年产业预测
 防打鼾治疗市场机会、成长动力、产业趋势分析与 2025 - 2034 年预测
 防打鼾设备市场:依产品、分布 - 全球预测 2025-2030防打鼾设备和打鼾手术市场:按设备类型、手术方法和最终用户划分 - 全球预测 2025-2030
 全球防打鼾设备和打鼾手术市场研究报告 - 2024 年至 2032 年行业分析、规模、份额、成长、趋势和预测
 打鼾防止设备:市场洞察·竞争环境·市场预测 (~2030年)