


 |
市场调查报告书
商品编码
1344486
智慧家庭硬体市场:2023-2032年按产品类型划分的全球机会分析及产业预测Smart Home Hardware Market By Product Type (Security and Surveillance, Smart Appliances, Smart Infotainment, Utility Management, Others): Global Opportunity Analysis and Industry Forecast, 2023-2032 |
||||||
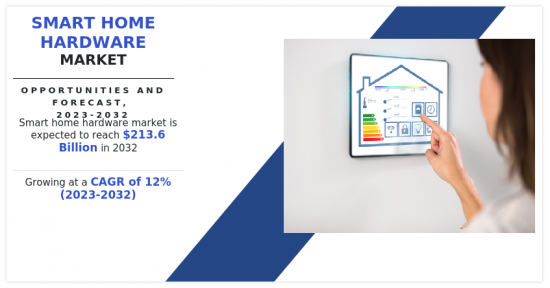
2022 年智慧家庭硬体市场价值 724 亿美元,预估 2023 年至 2032 年复合年增长率为 12%,到 2032 年将达到 2,136 亿美元。
智慧家庭硬体由许多互连的系统和技术组成,允许房主控製家中的多个设备。 例如,恆温器就是智慧家庭设备的一个例子,它可以根据个人喜好管理温度,确保舒适性和能源经济性。 另一个例子是智慧照明系统,当有人进入房间时,它可以打开灯或更改设定。 能源监控和管理也是智慧家庭设备的重要功能。 智慧插头、智慧电錶和能源监控系统使房主能够测量和优化其能源使用。 这有助于减少能源使用并促进永续性。
智慧家庭市场的成长得益于多种因素,包括网路、智慧型手机和社群网路的使用不断增加。 市场成长是由世界日益城市化和新兴国家收入增加所推动的,新兴国家正在迎来新的生活方式。 智慧家庭技术的主要趋势之一是家庭人工智慧系统的使用增加。 人工智慧可用于将人工智慧家庭自动化提升到一个新的水平。 它可以是电脑视觉或由 NLP 引擎驱动的语音控制智慧型设备,该引擎可以分析语音,从而使 Samsung Family Hub 能够检测冰箱中的物品并建立购物清单。 此类系统中使用人工智慧来改善智慧家庭用户的用户体验。 这些因素预计将提高智慧家居硬体的市场份额。
智慧家庭设备在很大程度上依赖稳定可靠的网路连线才能发挥最佳功能。 Internet 连线故障可能会影响这些装置的效能和功能。 断电或网路中断可能会导致智慧家庭设备暂时无法存取或无法操作,从而影响使用者体验。 随着技术的快速进步,智慧家居硬体设备可能变得无法使用。 随着新技术的出现并成为主流,旧设备可能不相容或无法利用新功能和功能。
智慧家庭硬体市场正在扩展到健康和保健应用,例如远端健康监测、环境辅助生活和个人化医疗保健。 智慧家庭设备可以追踪生命体征,提供用药提醒,并创造支持健康和就地老化的周围环境。 将智慧家居硬体与智慧电网和智慧城市基础设施集成为能源管理、需求响应和电网优化提供了机会。 透过参与动态定价计画、负载管理和再生能源整合,智慧家庭可以在创建更永续、更有效率的能源生态系统方面发挥重要作用。
COVID-19 大流行扰乱了全球供应链,影响了智慧家庭硬体的製造和分销。 封锁、旅行限制和临时工厂关闭扰乱了零件的生产和交付,导致产品上市延迟和某些设备短缺。 这些供应链挑战影响了市场上智慧家庭硬体的可用性和可近性。 疫情期间,市场参与者发现智慧家庭系统的安装量下降。 有些智慧家庭产品需要专业安装或现场编程。 因此,买家对于安装这些设备犹豫不决,以避免在 COVID-19 大流行期间与外界接触。
目录
第1章简介
第 2 章执行摘要
第3章市场概述
- 市场定义和范围
- 主要发现
- 影响因素
- 主要投资机会
- 波特五力分析
- 市场动态
- 促进因素
- 抑制因素
- 机会
- 新冠肺炎 (COVID-19) 市场影响分析
- 平均售价
- 市占率分析
- 品牌占有率分析
- 价值链分析
- 主要监理分析
- 专利情况
- 监理指南
- 贸易资料分析
第 4 章智慧家庭硬体市场:依产品类型
- 摘要
- 安全与监控
- 智慧家电
- 智慧资讯娱乐系统
- 公用事业管理
- 其他
第5章智慧家庭硬体市场:依地区
- 摘要
- 北美
- 美国
- 加拿大
- 墨西哥
- 欧洲
- 德国
- 英国
- 法国
- 西班牙
- 义大利
- 欧洲其他地区
- 亚太地区
- 中国
- 日本
- 印度
- 韩国
- 澳大利亚
- 其他亚太地区
- 拉丁美洲/中东/非洲
- 巴西
- 阿联酋
- 沙乌地阿拉伯
- 南非
- 其他领域
第6章竞争态势
- 简介
- 关键成功策略
- 10家主要公司的产品图谱
- 竞争对手仪表板
- 竞争热图
- 2022 年主要公司的定位
第7章公司简介
- Google LLC(Alphabet)
- HONEYWELL CORPORATION, INC.
- Amazon.com Inc.
- Schneider Electric SE.
- Johnson Controls International plc
- ABB Ltd.
- Legrand SA
- Panasonic Corporation
- Samsung Electronics Co Ltd
- General Electric
According to a new report published by Allied Market Research, titled, "Smart Home Hardware Market," The smart home hardware market was valued at $72.4 billion in 2022, and is estimated to reach $213.6 billion by 2032, growing at a CAGR of 12% from 2023 to 2032.
Smart home hardware consists of a number of interconnected systems and technologies that enable homeowners to control several devices at their homes. Thermostats, for example, are examples of smart home equipment that can manage temperature based on personal preferences, assuring comfort and energy economy. Another example is smart lighting systems, which may turn on or alter lighting settings when someone enters a room. Also, energy monitoring and management are important features of smart home gear. Smart plugs, smart meters, and energy monitoring systems enable homeowners to measure and optimize their energy usage. This aids in the reduction of energy use and the promotion of sustainability..
The smart home market is growing due to a number of factors include increase in use of the Internet, smartphones, and social networks. The market growth is being driven by increasing global urbanization and rising incomes in developing countries, which have resulted in new ways of living. One of the primary smart home technology trends is the increase in use of home artificial intelligence systems. Artificial intelligence can be used to take AI home automation to the next level. It might be either computer vision or voice-controlled smart devices employing NLP engines to analyze speech that allows a Samsung Family Hub to detect things in the fridge and produce a shopping list. AI is used in such systems to improve the user experience for smart home users. These factors are anticipated to boost the smart home hardware market share.
Smart home devices heavily rely on a stable and reliable Internet connection to function optimally. Any disruption in Internet connectivity can impact the performance and functionality of these devices. Power outages or network outages can temporarily render smart home devices inaccessible or non-functional, affecting the user experience. The rapid pace of technological advancements can lead to the uselessness of smart home hardware devices. As new technologies emerge and become mainstream, older devices may lack compatibility or miss out on new features and functionalities.
The smart home hardware market is expanding into health & wellness applications, such as remote health monitoring, ambient-assisted living, and personalized healthcare. Smart home devices can track vital signs, provide medication reminders, and create ambient environments to support well-being and aging-in-place. The integration of smart home hardware with smart grids and smart city infrastructure presents opportunities for energy management, demand response, and grid optimization. Smart homes can play a vital role in creating more sustainable and efficient energy ecosystems by participating in dynamic pricing programs, load management, and renewable energy integration.
The COVID-19 pandemic led to disruptions in global supply chains, affecting the manufacturing and distribution of smart home hardware. Lockdowns, travel restrictions, and temporary factory closures disrupted the production and delivery of components, leading to delays in product launches and shortages of certain devices. These supply chain challenges affected the availability and accessibility of smart home hardware in the market. During the pandemic, market participants have seen a decrease in smart home system installations. Some smart home products require professional installation and programming on-site. Therefore, buyers have been hesitant to install these devices in order to avoid contact with outside people during the COVID-19 pandemic.
The key players profiled in this report include: Google LLC (Alphabet), Honeywell Corporation, Inc., Amazon.com Inc., Schneider Electric SE., Johnson Controls International plc, ABB Ltd., Legrand SA, Panasonic Corporation, Samsung Electronics Co Ltd, and General Electric. The market players are continuously striving to achieve a dominant position in this competitive market using strategies such as collaborations and acquisitions.
Key Benefits For Stakeholders
- This report provides a quantitative analysis of the market segments, current trends, estimations, and dynamics of the smart home hardware market analysis from 2022 to 2032 to identify the prevailing smart home hardware market opportunities.
- The market research is offered along with information related to key drivers, restraints, and opportunities.
- Porter's five forces analysis highlights the potency of buyers and suppliers to enable stakeholders make profit-oriented business decisions and strengthen their supplier-buyer network.
- In-depth analysis of the smart home hardware market segmentation assists to determine the prevailing market opportunities.
- Major countries in each region are mapped according to their revenue contribution to the global market.
- Market player positioning facilitates benchmarking and provides a clear understanding of the present position of the market players.
- The report includes the analysis of the regional as well as global smart home hardware market trends, key players, market segments, application areas, and market growth strategies.
Key Market Segments
By Product Type
- Security and Surveillance
- Smart Appliances
- Smart Infotainment
- Utility Management
- Others
By Region
- North America
- U.S.
- Canada
- Mexico
- Europe
- Germany
- UK
- France
- Spain
- Italy
- Rest of Europe
- Asia-Pacific
- China
- Japan
- India
- South Korea
- Australia
- Rest of Asia-Pacific
- LAMEA
- Brazil
- UAE
- Saudi Arabia
- South Africa
- Rest of LAMEA
Key Market Players:
- ABB Ltd.
- Amazon.com Inc.
- General Electric
- Google LLC (Alphabet)
- HONEYWELL CORPORATION, INC.
- Johnson Controls International plc
- Legrand SA
- Panasonic Corporation
- Samsung Electronics Co Ltd
- Schneider Electric SE.
TABLE OF CONTENTS
CHAPTER 1: INTRODUCTION
- 1.1. Report description
- 1.2. Key market segments
- 1.3. Key benefits to the stakeholders
- 1.4. Research Methodology
- 1.4.1. Primary research
- 1.4.2. Secondary research
- 1.4.3. Analyst tools and models
CHAPTER 2: EXECUTIVE SUMMARY
- 2.1. CXO Perspective
CHAPTER 3: MARKET OVERVIEW
- 3.1. Market definition and scope
- 3.2. Key findings
- 3.2.1. Top impacting factors
- 3.2.2. Top investment pockets
- 3.3. Porter's five forces analysis
- 3.4. Market dynamics
- 3.4.1. Drivers
- 3.4.2. Restraints
- 3.4.3. Opportunities
- 3.5. COVID-19 Impact Analysis on the market
- 3.6. Average Selling Price
- 3.7. Market Share Analysis
- 3.8. Brand Share Analysis
- 3.9. Value Chain Analysis
- 3.10. Key Regulation Analysis
- 3.11. Patent Landscape
- 3.12. Regulatory Guidelines
- 3.13. Trade Data Analysis
CHAPTER 4: SMART HOME HARDWARE MARKET, BY PRODUCT TYPE
- 4.1. Overview
- 4.1.1. Market size and forecast
- 4.2. Security and Surveillance
- 4.2.1. Key market trends, growth factors and opportunities
- 4.2.2. Market size and forecast, by region
- 4.2.3. Market share analysis by country
- 4.3. Smart Appliances
- 4.3.1. Key market trends, growth factors and opportunities
- 4.3.2. Market size and forecast, by region
- 4.3.3. Market share analysis by country
- 4.4. Smart Infotainment
- 4.4.1. Key market trends, growth factors and opportunities
- 4.4.2. Market size and forecast, by region
- 4.4.3. Market share analysis by country
- 4.5. Utility Management
- 4.5.1. Key market trends, growth factors and opportunities
- 4.5.2. Market size and forecast, by region
- 4.5.3. Market share analysis by country
- 4.6. Others
- 4.6.1. Key market trends, growth factors and opportunities
- 4.6.2. Market size and forecast, by region
- 4.6.3. Market share analysis by country
CHAPTER 5: SMART HOME HARDWARE MARKET, BY REGION
- 5.1. Overview
- 5.1.1. Market size and forecast By Region
- 5.2. North America
- 5.2.1. Key trends and opportunities
- 5.2.2. Market size and forecast, by Product Type
- 5.2.3. Market size and forecast, by country
- 5.2.3.1. U.S.
- 5.2.3.1.1. Key market trends, growth factors and opportunities
- 5.2.3.1.2. Market size and forecast, by Product Type
- 5.2.3.2. Canada
- 5.2.3.2.1. Key market trends, growth factors and opportunities
- 5.2.3.2.2. Market size and forecast, by Product Type
- 5.2.3.3. Mexico
- 5.2.3.3.1. Key market trends, growth factors and opportunities
- 5.2.3.3.2. Market size and forecast, by Product Type
- 5.3. Europe
- 5.3.1. Key trends and opportunities
- 5.3.2. Market size and forecast, by Product Type
- 5.3.3. Market size and forecast, by country
- 5.3.3.1. Germany
- 5.3.3.1.1. Key market trends, growth factors and opportunities
- 5.3.3.1.2. Market size and forecast, by Product Type
- 5.3.3.2. UK
- 5.3.3.2.1. Key market trends, growth factors and opportunities
- 5.3.3.2.2. Market size and forecast, by Product Type
- 5.3.3.3. France
- 5.3.3.3.1. Key market trends, growth factors and opportunities
- 5.3.3.3.2. Market size and forecast, by Product Type
- 5.3.3.4. Spain
- 5.3.3.4.1. Key market trends, growth factors and opportunities
- 5.3.3.4.2. Market size and forecast, by Product Type
- 5.3.3.5. Italy
- 5.3.3.5.1. Key market trends, growth factors and opportunities
- 5.3.3.5.2. Market size and forecast, by Product Type
- 5.3.3.6. Rest of Europe
- 5.3.3.6.1. Key market trends, growth factors and opportunities
- 5.3.3.6.2. Market size and forecast, by Product Type
- 5.4. Asia-Pacific
- 5.4.1. Key trends and opportunities
- 5.4.2. Market size and forecast, by Product Type
- 5.4.3. Market size and forecast, by country
- 5.4.3.1. China
- 5.4.3.1.1. Key market trends, growth factors and opportunities
- 5.4.3.1.2. Market size and forecast, by Product Type
- 5.4.3.2. Japan
- 5.4.3.2.1. Key market trends, growth factors and opportunities
- 5.4.3.2.2. Market size and forecast, by Product Type
- 5.4.3.3. India
- 5.4.3.3.1. Key market trends, growth factors and opportunities
- 5.4.3.3.2. Market size and forecast, by Product Type
- 5.4.3.4. South Korea
- 5.4.3.4.1. Key market trends, growth factors and opportunities
- 5.4.3.4.2. Market size and forecast, by Product Type
- 5.4.3.5. Australia
- 5.4.3.5.1. Key market trends, growth factors and opportunities
- 5.4.3.5.2. Market size and forecast, by Product Type
- 5.4.3.6. Rest of Asia-Pacific
- 5.4.3.6.1. Key market trends, growth factors and opportunities
- 5.4.3.6.2. Market size and forecast, by Product Type
- 5.5. LAMEA
- 5.5.1. Key trends and opportunities
- 5.5.2. Market size and forecast, by Product Type
- 5.5.3. Market size and forecast, by country
- 5.5.3.1. Brazil
- 5.5.3.1.1. Key market trends, growth factors and opportunities
- 5.5.3.1.2. Market size and forecast, by Product Type
- 5.5.3.2. UAE
- 5.5.3.2.1. Key market trends, growth factors and opportunities
- 5.5.3.2.2. Market size and forecast, by Product Type
- 5.5.3.3. Saudi Arabia
- 5.5.3.3.1. Key market trends, growth factors and opportunities
- 5.5.3.3.2. Market size and forecast, by Product Type
- 5.5.3.4. South Africa
- 5.5.3.4.1. Key market trends, growth factors and opportunities
- 5.5.3.4.2. Market size and forecast, by Product Type
- 5.5.3.5. Rest of LAMEA
- 5.5.3.5.1. Key market trends, growth factors and opportunities
- 5.5.3.5.2. Market size and forecast, by Product Type
CHAPTER 6: COMPETITIVE LANDSCAPE
- 6.1. Introduction
- 6.2. Top winning strategies
- 6.3. Product Mapping of Top 10 Player
- 6.4. Competitive Dashboard
- 6.5. Competitive Heatmap
- 6.6. Top player positioning, 2022
CHAPTER 7: COMPANY PROFILES
- 7.1. Google LLC (Alphabet)
- 7.1.1. Company overview
- 7.1.2. Key Executives
- 7.1.3. Company snapshot
- 7.2. HONEYWELL CORPORATION, INC.
- 7.2.1. Company overview
- 7.2.2. Key Executives
- 7.2.3. Company snapshot
- 7.3. Amazon.com Inc.
- 7.3.1. Company overview
- 7.3.2. Key Executives
- 7.3.3. Company snapshot
- 7.4. Schneider Electric SE.
- 7.4.1. Company overview
- 7.4.2. Key Executives
- 7.4.3. Company snapshot
- 7.5. Johnson Controls International plc
- 7.5.1. Company overview
- 7.5.2. Key Executives
- 7.5.3. Company snapshot
- 7.6. ABB Ltd.
- 7.6.1. Company overview
- 7.6.2. Key Executives
- 7.6.3. Company snapshot
- 7.7. Legrand SA
- 7.7.1. Company overview
- 7.7.2. Key Executives
- 7.7.3. Company snapshot
- 7.8. Panasonic Corporation
- 7.8.1. Company overview
- 7.8.2. Key Executives
- 7.8.3. Company snapshot
- 7.9. Samsung Electronics Co Ltd
- 7.9.1. Company overview
- 7.9.2. Key Executives
- 7.9.3. Company snapshot
- 7.10. General Electric
- 7.10.1. Company overview
- 7.10.2. Key Executives
- 7.10.3. Company snapshot
LIST OF TABLES
- TABLE 01. GLOBAL SMART HOME HARDWARE MARKET, BY PRODUCT TYPE, 2022-2032 ($MILLION)
- TABLE 02. SMART HOME HARDWARE MARKET FOR SECURITY AND SURVEILLANCE, BY REGION, 2022-2032 ($MILLION)
- TABLE 03. SMART HOME HARDWARE MARKET FOR SMART APPLIANCES, BY REGION, 2022-2032 ($MILLION)
- TABLE 04. SMART HOME HARDWARE MARKET FOR SMART INFOTAINMENT, BY REGION, 2022-2032 ($MILLION)
- TABLE 05. SMART HOME HARDWARE MARKET FOR UTILITY MANAGEMENT, BY REGION, 2022-2032 ($MILLION)
- TABLE 06. SMART HOME HARDWARE MARKET FOR OTHERS, BY REGION, 2022-2032 ($MILLION)
- TABLE 07. SMART HOME HARDWARE MARKET, BY REGION, 2022-2032 ($MILLION)
- TABLE 08. NORTH AMERICA SMART HOME HARDWARE MARKET, BY PRODUCT TYPE, 2022-2032 ($MILLION)
- TABLE 09. NORTH AMERICA SMART HOME HARDWARE MARKET, BY COUNTRY, 2022-2032 ($MILLION)
- TABLE 10. U.S. SMART HOME HARDWARE MARKET, BY PRODUCT TYPE, 2022-2032 ($MILLION)
- TABLE 11. CANADA SMART HOME HARDWARE MARKET, BY PRODUCT TYPE, 2022-2032 ($MILLION)
- TABLE 12. MEXICO SMART HOME HARDWARE MARKET, BY PRODUCT TYPE, 2022-2032 ($MILLION)
- TABLE 13. EUROPE SMART HOME HARDWARE MARKET, BY PRODUCT TYPE, 2022-2032 ($MILLION)
- TABLE 14. EUROPE SMART HOME HARDWARE MARKET, BY COUNTRY, 2022-2032 ($MILLION)
- TABLE 15. GERMANY SMART HOME HARDWARE MARKET, BY PRODUCT TYPE, 2022-2032 ($MILLION)
- TABLE 16. UK SMART HOME HARDWARE MARKET, BY PRODUCT TYPE, 2022-2032 ($MILLION)
- TABLE 17. FRANCE SMART HOME HARDWARE MARKET, BY PRODUCT TYPE, 2022-2032 ($MILLION)
- TABLE 18. SPAIN SMART HOME HARDWARE MARKET, BY PRODUCT TYPE, 2022-2032 ($MILLION)
- TABLE 19. ITALY SMART HOME HARDWARE MARKET, BY PRODUCT TYPE, 2022-2032 ($MILLION)
- TABLE 20. REST OF EUROPE SMART HOME HARDWARE MARKET, BY PRODUCT TYPE, 2022-2032 ($MILLION)
- TABLE 21. ASIA-PACIFIC SMART HOME HARDWARE MARKET, BY PRODUCT TYPE, 2022-2032 ($MILLION)
- TABLE 22. ASIA-PACIFIC SMART HOME HARDWARE MARKET, BY COUNTRY, 2022-2032 ($MILLION)
- TABLE 23. CHINA SMART HOME HARDWARE MARKET, BY PRODUCT TYPE, 2022-2032 ($MILLION)
- TABLE 24. JAPAN SMART HOME HARDWARE MARKET, BY PRODUCT TYPE, 2022-2032 ($MILLION)
- TABLE 25. INDIA SMART HOME HARDWARE MARKET, BY PRODUCT TYPE, 2022-2032 ($MILLION)
- TABLE 26. SOUTH KOREA SMART HOME HARDWARE MARKET, BY PRODUCT TYPE, 2022-2032 ($MILLION)
- TABLE 27. AUSTRALIA SMART HOME HARDWARE MARKET, BY PRODUCT TYPE, 2022-2032 ($MILLION)
- TABLE 28. REST OF ASIA-PACIFIC SMART HOME HARDWARE MARKET, BY PRODUCT TYPE, 2022-2032 ($MILLION)
- TABLE 29. LAMEA SMART HOME HARDWARE MARKET, BY PRODUCT TYPE, 2022-2032 ($MILLION)
- TABLE 30. LAMEA SMART HOME HARDWARE MARKET, BY COUNTRY, 2022-2032 ($MILLION)
- TABLE 31. BRAZIL SMART HOME HARDWARE MARKET, BY PRODUCT TYPE, 2022-2032 ($MILLION)
- TABLE 32. UAE SMART HOME HARDWARE MARKET, BY PRODUCT TYPE, 2022-2032 ($MILLION)
- TABLE 33. SAUDI ARABIA SMART HOME HARDWARE MARKET, BY PRODUCT TYPE, 2022-2032 ($MILLION)
- TABLE 34. SOUTH AFRICA SMART HOME HARDWARE MARKET, BY PRODUCT TYPE, 2022-2032 ($MILLION)
- TABLE 35. REST OF LAMEA SMART HOME HARDWARE MARKET, BY PRODUCT TYPE, 2022-2032 ($MILLION)
- TABLE 36. GOOGLE LLC (ALPHABET): KEY EXECUTIVES
- TABLE 37. GOOGLE LLC (ALPHABET): COMPANY SNAPSHOT
- TABLE 38. HONEYWELL CORPORATION, INC.: KEY EXECUTIVES
- TABLE 39. HONEYWELL CORPORATION, INC.: COMPANY SNAPSHOT
- TABLE 40. AMAZON.COM INC.: KEY EXECUTIVES
- TABLE 41. AMAZON.COM INC.: COMPANY SNAPSHOT
- TABLE 42. SCHNEIDER ELECTRIC SE.: KEY EXECUTIVES
- TABLE 43. SCHNEIDER ELECTRIC SE.: COMPANY SNAPSHOT
- TABLE 44. JOHNSON CONTROLS INTERNATIONAL PLC: KEY EXECUTIVES
- TABLE 45. JOHNSON CONTROLS INTERNATIONAL PLC: COMPANY SNAPSHOT
- TABLE 46. ABB LTD.: KEY EXECUTIVES
- TABLE 47. ABB LTD.: COMPANY SNAPSHOT
- TABLE 48. LEGRAND SA: KEY EXECUTIVES
- TABLE 49. LEGRAND SA: COMPANY SNAPSHOT
- TABLE 50. PANASONIC CORPORATION: KEY EXECUTIVES
- TABLE 51. PANASONIC CORPORATION: COMPANY SNAPSHOT
- TABLE 52. SAMSUNG ELECTRONICS CO LTD: KEY EXECUTIVES
- TABLE 53. SAMSUNG ELECTRONICS CO LTD: COMPANY SNAPSHOT
- TABLE 54. GENERAL ELECTRIC: KEY EXECUTIVES
- TABLE 55. GENERAL ELECTRIC: COMPANY SNAPSHOT
LIST OF FIGURES
- FIGURE 01. SMART HOME HARDWARE MARKET, 2022-2032
- FIGURE 02. SEGMENTATION OF SMART HOME HARDWARE MARKET, 2022-2032
- FIGURE 03. TOP INVESTMENT POCKETS IN SMART HOME HARDWARE MARKET (2023-2032)
- FIGURE 04. BARGAINING POWER OF SUPPLIERS
- FIGURE 05. BARGAINING POWER OF BUYERS
- FIGURE 06. THREAT OF SUBSTITUTION
- FIGURE 07. THREAT OF SUBSTITUTION
- FIGURE 08. COMPETITIVE RIVALRY
- FIGURE 09. DRIVERS, RESTRAINTS AND OPPORTUNITIES: GLOBALSMART HOME HARDWARE MARKET
- FIGURE 10. IMPACT OF KEY REGULATION: SMART HOME HARDWARE MARKET
- FIGURE 11. PATENT ANALYSIS BY COMPANY
- FIGURE 12. PATENT ANALYSIS BY COUNTRY
- FIGURE 13. REGULATORY GUIDELINES: SMART HOME HARDWARE MARKET
- FIGURE 13. SMART HOME HARDWARE MARKET, BY PRODUCT TYPE, 2022(%)
- FIGURE 14. COMPARATIVE SHARE ANALYSIS OF SMART HOME HARDWARE MARKET FOR SECURITY AND SURVEILLANCE, BY COUNTRY 2022 AND 2032(%)
- FIGURE 15. COMPARATIVE SHARE ANALYSIS OF SMART HOME HARDWARE MARKET FOR SMART APPLIANCES, BY COUNTRY 2022 AND 2032(%)
- FIGURE 16. COMPARATIVE SHARE ANALYSIS OF SMART HOME HARDWARE MARKET FOR SMART INFOTAINMENT, BY COUNTRY 2022 AND 2032(%)
- FIGURE 17. COMPARATIVE SHARE ANALYSIS OF SMART HOME HARDWARE MARKET FOR UTILITY MANAGEMENT, BY COUNTRY 2022 AND 2032(%)
- FIGURE 18. COMPARATIVE SHARE ANALYSIS OF SMART HOME HARDWARE MARKET FOR OTHERS, BY COUNTRY 2022 AND 2032(%)
- FIGURE 19. SMART HOME HARDWARE MARKET BY REGION, 2022
- FIGURE 20. U.S. SMART HOME HARDWARE MARKET, 2022-2032 ($MILLION)
- FIGURE 21. CANADA SMART HOME HARDWARE MARKET, 2022-2032 ($MILLION)
- FIGURE 22. MEXICO SMART HOME HARDWARE MARKET, 2022-2032 ($MILLION)
- FIGURE 23. GERMANY SMART HOME HARDWARE MARKET, 2022-2032 ($MILLION)
- FIGURE 24. UK SMART HOME HARDWARE MARKET, 2022-2032 ($MILLION)
- FIGURE 25. FRANCE SMART HOME HARDWARE MARKET, 2022-2032 ($MILLION)
- FIGURE 26. SPAIN SMART HOME HARDWARE MARKET, 2022-2032 ($MILLION)
- FIGURE 27. ITALY SMART HOME HARDWARE MARKET, 2022-2032 ($MILLION)
- FIGURE 28. REST OF EUROPE SMART HOME HARDWARE MARKET, 2022-2032 ($MILLION)
- FIGURE 29. CHINA SMART HOME HARDWARE MARKET, 2022-2032 ($MILLION)
- FIGURE 30. JAPAN SMART HOME HARDWARE MARKET, 2022-2032 ($MILLION)
- FIGURE 31. INDIA SMART HOME HARDWARE MARKET, 2022-2032 ($MILLION)
- FIGURE 32. SOUTH KOREA SMART HOME HARDWARE MARKET, 2022-2032 ($MILLION)
- FIGURE 33. AUSTRALIA SMART HOME HARDWARE MARKET, 2022-2032 ($MILLION)
- FIGURE 34. REST OF ASIA-PACIFIC SMART HOME HARDWARE MARKET, 2022-2032 ($MILLION)
- FIGURE 35. BRAZIL SMART HOME HARDWARE MARKET, 2022-2032 ($MILLION)
- FIGURE 36. UAE SMART HOME HARDWARE MARKET, 2022-2032 ($MILLION)
- FIGURE 37. SAUDI ARABIA SMART HOME HARDWARE MARKET, 2022-2032 ($MILLION)
- FIGURE 38. SOUTH AFRICA SMART HOME HARDWARE MARKET, 2022-2032 ($MILLION)
- FIGURE 39. REST OF LAMEA SMART HOME HARDWARE MARKET, 2022-2032 ($MILLION)
- FIGURE 40. TOP WINNING STRATEGIES, BY YEAR
- FIGURE 41. TOP WINNING STRATEGIES, BY DEVELOPMENT
- FIGURE 42. TOP WINNING STRATEGIES, BY COMPANY
- FIGURE 43. PRODUCT MAPPING OF TOP 10 PLAYERS
- FIGURE 44. COMPETITIVE DASHBOARD
- FIGURE 45. COMPETITIVE HEATMAP: SMART HOME HARDWARE MARKET
- FIGURE 46. TOP PLAYER POSITIONING, 2022