


 |
市场调查报告书
商品编码
1344549
脊髓刺激 (SCS) 设备市场:按产品、按适应症、按最终用户:2023-2032 年全球机会分析和产业预测Spinal Cord Stimulation Devices Market By Product, By Indication, By End User : Global Opportunity Analysis and Industry Forecast, 2023-2032 |
||||||
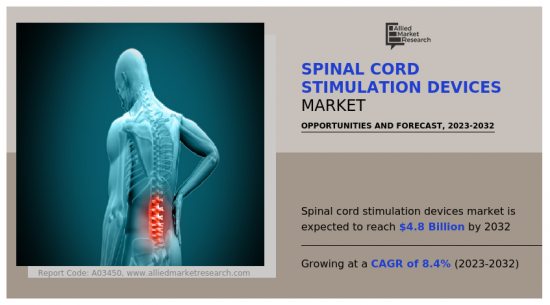
根据 Allied Market Research 发布的最新报告,2022 年 脊髓刺激 (SCS) 设备市场价值为 21 亿美元,2023 年至 2032 年复合年增长率为 8.4%,2022 年将达到 48 亿美元。2032 年。 ,预计将达到10亿美元。
推动脊髓刺激器市场成长的主要因素是患有慢性疼痛的人数不断增加、脊髓刺激 (SCS) 设备的技术进步以及脊髓刺激器的采用不断增加。 慢性疼痛可由多种原因引起,包括术后脊椎疼痛症候群 (FBSS)、复杂性区域疼痛症候群 (CRPS)、退化性椎间盘疾病 (DDD) 和糖尿病神经病变。 这些情况可能会使人衰弱,影响人们的生活质量,并且需要长期管理。 脊髓刺激(SCS)设备正在成为一种有效的治疗选择,适用于其他治疗方法无效的慢性疼痛患者。 此外,脊髓刺激(SCS)设备的工作原理是向脊髓发送电脉衝并阻止疼痛讯号向大脑的传输。
此外,脊髓刺激 (SCS) 设备的技术进步使其变得更小、更灵活且更有效。 例如,较新的设备使用高频刺激来缓解疼痛,而不会引起与传统低频刺激相关的刺痛或刺痛感。 此外,其他进步,例如可充电电池和无线设备的开发,正在提高患者的舒适度和便利性。 随着患者和医生寻求更有效、更易于使用的设备,这些技术进步预计将推动对脊髓刺激 (SCS) 设备的需求。
此外,世界人口正在迅速老化,这种人口变化预计将推动对脊髓刺激 (SCS) 设备的需求。 老年人更有可能患有慢性疼痛,随着人口老化,需要脊髓刺激治疗的人数预计会增加。 例如,根据美国人口普查局(2022)的数据,美国有超过 5,600 万 65 岁及以上的成年人居住,约占美国人口的 16.9%。
目录
第一章简介
第 2 章执行摘要
第三章市场概述
- 市场定义和范围
- 主要发现
- 影响因素
- 主要投资机会
- 波特五力分析
- 供应商的议价能力
- 买方的议价能力
- 替代品的威胁
- 新进入者的威胁
- 竞争强度
- 市场动态
- 促进因素
- 慢性疼痛疾病增加
- 脊髓刺激 (SCS) 设备的技术进步
- 医疗报销系统的可用性
- 抑制因素
- 脊髓刺激 (SCS) 设备成本高且副作用大
- 慢性疼痛替代疗法的可用性
- 机会
- 新兴市场的成长机会
- 促进因素
- 新冠肺炎 (COVID-19):市场影响分析
第 4 章脊髓刺激 (SCS) 设备市场:依产品
- 摘要
- 充电
- 不可充电
第 5 章脊髓刺激 (SCS) 设备市场:依适应症分类
- 摘要
- 脊椎手术后疼痛症候群 (FBSS)
- 复杂性局部疼痛症候群 (CRPS)
- 退化性椎间盘疾病 (DDD)
- 其他
第 6 章脊髓刺激 (SCS) 设备市场:依最终使用者划分
- 摘要
- 医院
- 门诊手术中心
- 其他
第 7 章脊髓刺激 (SCS) 设备市场:按地区
- 摘要
- 北美
- 美国
- 加拿大
- 墨西哥
- 欧洲
- 德国
- 法国
- 英国
- 义大利
- 西班牙
- 欧洲其他地区
- 亚太地区
- 日本
- 中国
- 印度
- 澳大利亚
- 韩国
- 其他亚太地区
- 拉丁美洲
- 拉丁美洲
- 中东非洲
第八章竞争态势
- 简介
- 关键成功策略
- 10家主要公司的产品图谱
- 竞争对手仪表板
- 竞争热图
- 2022 年主要公司的定位
第九章公司简介
- Boston Scientific Corporation
- Medtronic plc
- Abbott Laboratories
- Nevro Corporation
- Beijing PINS Medical Co., Ltd
- Saluda Medical Pty Ltd.
- Nalu Medical, Inc.
- Teliatry, Inc.
- GIMER MEDICAL
- BIOTRONIK SE & Co. KG
According to a new report published by Allied Market Research, titled, "Spinal Cord Stimulation Devices Market," The spinal cord stimulation devices market was valued at $2.1 billion in 2022, and is estimated to reach $4.8 billion by 2032, growing at a CAGR of 8.4% from 2023 to 2032.
The major factors driving the growth of spinal cord stimulation devices market are increase in number of people suffering from chronic pain conditions, technological advancements in spinal cord stimulation devices, and rise in adoption of spinal cord stimulation devices. Chronic pain can be caused by a variety of conditions, such as failed back surgery syndrome (FBSS), complex regional pain syndrome (CRPS), degenerative disc disease (DDD), and diabetic neuropathy. These conditions can be debilitating, affecting a person's quality of life and requiring long-term management. Spinal cord stimulation devices have emerged as an effective treatment option for patients suffering from chronic pain conditions who have not responded to other forms of therapy. In addition, spinal cord stimulation devices work by delivering electrical impulses to the spinal cord, disrupting the transmission of pain signals to the brain.
Further, technological advancements in spinal cord stimulation devices have made the devices smaller, flexible, and more effective. For instance, newer devices use high-frequency stimulation, which can provide pain relief without causing the tingling or prickling sensations associated with traditional low-frequency stimulation. In addition, other advances include the development of rechargeable batteries and wireless devices, which improve patient comfort and convenience. These technological advancements are expected to drive the demand for spinal cord stimulation devices as patients and physicians seek out more effective and user-friendly devices.
Moreover, the world's population is aging rapidly, and this demographic shift is expected to drive the demand for spinal cord stimulation devices. Older adults are more likely to suffer from chronic pain conditions, and as the population ages, the number of people in need of spinal cord stimulation therapy is expected to grow. For instance, according to the U.S. Census Bureau 2022, more than 56 million adults aged 65 and older live in the U.S., accounting for about 16.9% of the nation's population; thus, rise in geriatric population is anticipated to fuel the growth of market.
The spinal cord stimulation devices market is segmented into product, indication, end user, and region. On the basis of product, the market is bifurcated into rechargeable devices and non-rechargeable devices. Depending on indication, it is categorized into failed back surgery syndrome, complex regional pain syndrome, degenerative disc disease, and others. By end user, it is segregated into hospital, ambulatory surgical centers, and others. Region wise, the market is analyzed across North America (the U.S., Canada, and Mexico), Europe (Germany, France, the UK, Italy, Spain, and rest of Europe), Asia-Pacific (Japan, China, Australia, India, South Korea, and rest of Asia-Pacific), and LAMEA (Latin America and Middle East Africa)
Major key players that operate in the global spinal cord stimulation devices market are Medtronic Plc, Boston Scientific Corporation, Abbott Laboratories, Nevro Corporation, Beijing PINS Medical Co., Ltd, Saluda Medical Pty Ltd., Nalu Medical, Inc., BIOTRONIK, GIMER MEDICAL, and Teliatry, Inc. The key players have adopted strategies such as acquisition, product launch, product approval, and expansion to expand their product portfolio.
Key Benefits For Stakeholders
- This report provides a quantitative analysis of the market segments, current trends, estimations, and dynamics of the spinal cord stimulation devices market analysis from 2022 to 2032 to identify the prevailing spinal cord stimulation devices market opportunities.
- The market research is offered along with information related to key drivers, restraints, and opportunities.
- Porter's five forces analysis highlights the potency of buyers and suppliers to enable stakeholders make profit-oriented business decisions and strengthen their supplier-buyer network.
- In-depth analysis of the spinal cord stimulation devices market segmentation assists to determine the prevailing market opportunities.
- Major countries in each region are mapped according to their revenue contribution to the global market.
- Market player positioning facilitates benchmarking and provides a clear understanding of the present position of the market players.
- The report includes the analysis of the regional as well as global spinal cord stimulation devices market trends, key players, market segments, application areas, and market growth strategies.
Key Market Segments
By Indication
- Failed back surgery syndrome
- Complex regional pain syndrome
- Degenerative disc disease
- Others
By Product
- Rechargeable devices
- Non-rechargeable devices
By End User
- Hospitals
- Ambulatory surgical centers
- Others
By Region
- North America
- U.S.
- Canada
- Mexico
- Europe
- Germany
- France
- UK
- Italy
- Spain
- Rest of Europe
- Asia-Pacific
- Japan
- China
- India
- Australia
- South Korea
- Rest of Asia-Pacific
- LAMEA
- Latin America
- Middle East Africa
Key Market Players:
- Boston Scientific Corporation
- Beijing PINS Medical Co., Ltd
- Medtronic plc
- Abbott Laboratories
- BIOTRONIK SE & Co. KG
- Saluda Medical Pty Ltd.
- Nalu Medical, Inc.
- GIMER MEDICAL
- Teliatry, Inc.
- Nevro Corporation
TABLE OF CONTENTS
CHAPTER 1: INTRODUCTION
- 1.1. Report description
- 1.2. Key market segments
- 1.3. Key benefits to the stakeholders
- 1.4. Research Methodology
- 1.4.1. Primary research
- 1.4.2. Secondary research
- 1.4.3. Analyst tools and models
CHAPTER 2: EXECUTIVE SUMMARY
- 2.1. CXO Perspective
CHAPTER 3: MARKET OVERVIEW
- 3.1. Market definition and scope
- 3.2. Key findings
- 3.2.1. Top impacting factors
- 3.2.2. Top investment pockets
- 3.3. Porter's five forces analysis
- 3.3.1. Bargaining power of suppliers
- 3.3.2. Bargaining power of buyers
- 3.3.3. Threat of substitutes
- 3.3.4. Threat of new entrants
- 3.3.5. Intensity of rivalry
- 3.4. Market dynamics
- 3.4.1. Drivers
- 3.4.1.1. Increase in prevalence of chronic pain conditions
- 3.4.1.2. Technological advancements in spinal cord stimulation devices
- 3.4.1.3. Availability of medical reimbursement schemes
- 3.4.1. Drivers
- 3.4.2. Restraints
- 3.4.2.1. High cost and side effects of spinal cord stimulation devices
- 3.4.2.2. Availability of alternative treatment options for chronic pain
- 3.4.3. Opportunities
- 3.4.3.1. Growth opportunities in emerging markets
- 3.5. COVID-19 Impact Analysis on the market
CHAPTER 4: SPINAL CORD STIMULATION DEVICES MARKET, BY PRODUCT
- 4.1. Overview
- 4.1.1. Market size and forecast
- 4.2. Rechargeable devices
- 4.2.1. Key market trends, growth factors and opportunities
- 4.2.2. Market size and forecast, by region
- 4.2.3. Market share analysis by country
- 4.3. Non-rechargeable devices
- 4.3.1. Key market trends, growth factors and opportunities
- 4.3.2. Market size and forecast, by region
- 4.3.3. Market share analysis by country
CHAPTER 5: SPINAL CORD STIMULATION DEVICES MARKET, BY INDICATION
- 5.1. Overview
- 5.1.1. Market size and forecast
- 5.2. Failed back surgery syndrome
- 5.2.1. Key market trends, growth factors and opportunities
- 5.2.2. Market size and forecast, by region
- 5.2.3. Market share analysis by country
- 5.3. Complex regional pain syndrome
- 5.3.1. Key market trends, growth factors and opportunities
- 5.3.2. Market size and forecast, by region
- 5.3.3. Market share analysis by country
- 5.4. Degenerative disc disease
- 5.4.1. Key market trends, growth factors and opportunities
- 5.4.2. Market size and forecast, by region
- 5.4.3. Market share analysis by country
- 5.5. Others
- 5.5.1. Key market trends, growth factors and opportunities
- 5.5.2. Market size and forecast, by region
- 5.5.3. Market share analysis by country
CHAPTER 6: SPINAL CORD STIMULATION DEVICES MARKET, BY END USER
- 6.1. Overview
- 6.1.1. Market size and forecast
- 6.2. Hospitals
- 6.2.1. Key market trends, growth factors and opportunities
- 6.2.2. Market size and forecast, by region
- 6.2.3. Market share analysis by country
- 6.3. Ambulatory surgical centers
- 6.3.1. Key market trends, growth factors and opportunities
- 6.3.2. Market size and forecast, by region
- 6.3.3. Market share analysis by country
- 6.4. Others
- 6.4.1. Key market trends, growth factors and opportunities
- 6.4.2. Market size and forecast, by region
- 6.4.3. Market share analysis by country
CHAPTER 7: SPINAL CORD STIMULATION DEVICES MARKET, BY REGION
- 7.1. Overview
- 7.1.1. Market size and forecast By Region
- 7.2. North America
- 7.2.1. Key trends and opportunities
- 7.2.2. Market size and forecast, by Product
- 7.2.3. Market size and forecast, by Indication
- 7.2.4. Market size and forecast, by End User
- 7.2.5. Market size and forecast, by country
- 7.2.5.1. U.S.
- 7.2.5.1.1. Key market trends, growth factors and opportunities
- 7.2.5.1.2. Market size and forecast, by Product
- 7.2.5.1.3. Market size and forecast, by Indication
- 7.2.5.1.4. Market size and forecast, by End User
- 7.2.5.2. Canada
- 7.2.5.2.1. Key market trends, growth factors and opportunities
- 7.2.5.2.2. Market size and forecast, by Product
- 7.2.5.2.3. Market size and forecast, by Indication
- 7.2.5.2.4. Market size and forecast, by End User
- 7.2.5.3. Mexico
- 7.2.5.3.1. Key market trends, growth factors and opportunities
- 7.2.5.3.2. Market size and forecast, by Product
- 7.2.5.3.3. Market size and forecast, by Indication
- 7.2.5.3.4. Market size and forecast, by End User
- 7.3. Europe
- 7.3.1. Key trends and opportunities
- 7.3.2. Market size and forecast, by Product
- 7.3.3. Market size and forecast, by Indication
- 7.3.4. Market size and forecast, by End User
- 7.3.5. Market size and forecast, by country
- 7.3.5.1. Germany
- 7.3.5.1.1. Key market trends, growth factors and opportunities
- 7.3.5.1.2. Market size and forecast, by Product
- 7.3.5.1.3. Market size and forecast, by Indication
- 7.3.5.1.4. Market size and forecast, by End User
- 7.3.5.2. France
- 7.3.5.2.1. Key market trends, growth factors and opportunities
- 7.3.5.2.2. Market size and forecast, by Product
- 7.3.5.2.3. Market size and forecast, by Indication
- 7.3.5.2.4. Market size and forecast, by End User
- 7.3.5.3. UK
- 7.3.5.3.1. Key market trends, growth factors and opportunities
- 7.3.5.3.2. Market size and forecast, by Product
- 7.3.5.3.3. Market size and forecast, by Indication
- 7.3.5.3.4. Market size and forecast, by End User
- 7.3.5.4. Italy
- 7.3.5.4.1. Key market trends, growth factors and opportunities
- 7.3.5.4.2. Market size and forecast, by Product
- 7.3.5.4.3. Market size and forecast, by Indication
- 7.3.5.4.4. Market size and forecast, by End User
- 7.3.5.5. Spain
- 7.3.5.5.1. Key market trends, growth factors and opportunities
- 7.3.5.5.2. Market size and forecast, by Product
- 7.3.5.5.3. Market size and forecast, by Indication
- 7.3.5.5.4. Market size and forecast, by End User
- 7.3.5.6. Rest of Europe
- 7.3.5.6.1. Key market trends, growth factors and opportunities
- 7.3.5.6.2. Market size and forecast, by Product
- 7.3.5.6.3. Market size and forecast, by Indication
- 7.3.5.6.4. Market size and forecast, by End User
- 7.4. Asia-Pacific
- 7.4.1. Key trends and opportunities
- 7.4.2. Market size and forecast, by Product
- 7.4.3. Market size and forecast, by Indication
- 7.4.4. Market size and forecast, by End User
- 7.4.5. Market size and forecast, by country
- 7.4.5.1. Japan
- 7.4.5.1.1. Key market trends, growth factors and opportunities
- 7.4.5.1.2. Market size and forecast, by Product
- 7.4.5.1.3. Market size and forecast, by Indication
- 7.4.5.1.4. Market size and forecast, by End User
- 7.4.5.2. China
- 7.4.5.2.1. Key market trends, growth factors and opportunities
- 7.4.5.2.2. Market size and forecast, by Product
- 7.4.5.2.3. Market size and forecast, by Indication
- 7.4.5.2.4. Market size and forecast, by End User
- 7.4.5.3. India
- 7.4.5.3.1. Key market trends, growth factors and opportunities
- 7.4.5.3.2. Market size and forecast, by Product
- 7.4.5.3.3. Market size and forecast, by Indication
- 7.4.5.3.4. Market size and forecast, by End User
- 7.4.5.4. Australia
- 7.4.5.4.1. Key market trends, growth factors and opportunities
- 7.4.5.4.2. Market size and forecast, by Product
- 7.4.5.4.3. Market size and forecast, by Indication
- 7.4.5.4.4. Market size and forecast, by End User
- 7.4.5.5. South Korea
- 7.4.5.5.1. Key market trends, growth factors and opportunities
- 7.4.5.5.2. Market size and forecast, by Product
- 7.4.5.5.3. Market size and forecast, by Indication
- 7.4.5.5.4. Market size and forecast, by End User
- 7.4.5.6. Rest of Asia-Pacific
- 7.4.5.6.1. Key market trends, growth factors and opportunities
- 7.4.5.6.2. Market size and forecast, by Product
- 7.4.5.6.3. Market size and forecast, by Indication
- 7.4.5.6.4. Market size and forecast, by End User
- 7.5. LAMEA
- 7.5.1. Key trends and opportunities
- 7.5.2. Market size and forecast, by Product
- 7.5.3. Market size and forecast, by Indication
- 7.5.4. Market size and forecast, by End User
- 7.5.5. Market size and forecast, by country
- 7.5.5.1. Latin America
- 7.5.5.1.1. Key market trends, growth factors and opportunities
- 7.5.5.1.2. Market size and forecast, by Product
- 7.5.5.1.3. Market size and forecast, by Indication
- 7.5.5.1.4. Market size and forecast, by End User
- 7.5.5.2. Middle East Africa
- 7.5.5.2.1. Key market trends, growth factors and opportunities
- 7.5.5.2.2. Market size and forecast, by Product
- 7.5.5.2.3. Market size and forecast, by Indication
- 7.5.5.2.4. Market size and forecast, by End User
CHAPTER 8: COMPETITIVE LANDSCAPE
- 8.1. Introduction
- 8.2. Top winning strategies
- 8.3. Product Mapping of Top 10 Player
- 8.4. Competitive Dashboard
- 8.5. Competitive Heatmap
- 8.6. Top player positioning, 2022
CHAPTER 9: COMPANY PROFILES
- 9.1. Boston Scientific Corporation
- 9.1.1. Company overview
- 9.1.2. Key Executives
- 9.1.3. Company snapshot
- 9.1.4. Operating business segments
- 9.1.5. Product portfolio
- 9.1.6. Business performance
- 9.1.7. Key strategic moves and developments
- 9.2. Medtronic plc
- 9.2.1. Company overview
- 9.2.2. Key Executives
- 9.2.3. Company snapshot
- 9.2.4. Operating business segments
- 9.2.5. Product portfolio
- 9.2.6. Business performance
- 9.2.7. Key strategic moves and developments
- 9.3. Abbott Laboratories
- 9.3.1. Company overview
- 9.3.2. Key Executives
- 9.3.3. Company snapshot
- 9.3.4. Operating business segments
- 9.3.5. Product portfolio
- 9.3.6. Business performance
- 9.3.7. Key strategic moves and developments
- 9.4. Nevro Corporation
- 9.4.1. Company overview
- 9.4.2. Key Executives
- 9.4.3. Company snapshot
- 9.4.4. Operating business segments
- 9.4.5. Product portfolio
- 9.4.6. Business performance
- 9.4.7. Key strategic moves and developments
- 9.5. Beijing PINS Medical Co., Ltd
- 9.5.1. Company overview
- 9.5.2. Key Executives
- 9.5.3. Company snapshot
- 9.5.4. Operating business segments
- 9.5.5. Product portfolio
- 9.6. Saluda Medical Pty Ltd.
- 9.6.1. Company overview
- 9.6.2. Key Executives
- 9.6.3. Company snapshot
- 9.6.4. Operating business segments
- 9.6.5. Product portfolio
- 9.6.6. Key strategic moves and developments
- 9.7. Nalu Medical, Inc.
- 9.7.1. Company overview
- 9.7.2. Key Executives
- 9.7.3. Company snapshot
- 9.7.4. Operating business segments
- 9.7.5. Product portfolio
- 9.8. Teliatry, Inc.
- 9.8.1. Company overview
- 9.8.2. Key Executives
- 9.8.3. Company snapshot
- 9.8.4. Operating business segments
- 9.8.5. Product portfolio
- 9.9. GIMER MEDICAL
- 9.9.1. Company overview
- 9.9.2. Key Executives
- 9.9.3. Company snapshot
- 9.9.4. Operating business segments
- 9.9.5. Product portfolio
- 9.9.6. Key strategic moves and developments
- 9.10. BIOTRONIK SE & Co. KG
- 9.10.1. Company overview
- 9.10.2. Key Executives
- 9.10.3. Company snapshot
- 9.10.4. Operating business segments
- 9.10.5. Product portfolio
- 9.10.6. Key strategic moves and developments
LIST OF TABLES
- TABLE 01. GLOBAL SPINAL CORD STIMULATION DEVICES MARKET, BY PRODUCT, 2022-2032 ($MILLION)
- TABLE 02. SPINAL CORD STIMULATION DEVICES MARKET FOR RECHARGEABLE DEVICES, BY REGION, 2022-2032 ($MILLION)
- TABLE 03. SPINAL CORD STIMULATION DEVICES MARKET FOR NON-RECHARGEABLE DEVICES, BY REGION, 2022-2032 ($MILLION)
- TABLE 04. GLOBAL SPINAL CORD STIMULATION DEVICES MARKET, BY INDICATION, 2022-2032 ($MILLION)
- TABLE 05. SPINAL CORD STIMULATION DEVICES MARKET FOR FAILED BACK SURGERY SYNDROME, BY REGION, 2022-2032 ($MILLION)
- TABLE 06. SPINAL CORD STIMULATION DEVICES MARKET FOR COMPLEX REGIONAL PAIN SYNDROME, BY REGION, 2022-2032 ($MILLION)
- TABLE 07. SPINAL CORD STIMULATION DEVICES MARKET FOR DEGENERATIVE DISC DISEASE, BY REGION, 2022-2032 ($MILLION)
- TABLE 08. SPINAL CORD STIMULATION DEVICES MARKET FOR OTHERS, BY REGION, 2022-2032 ($MILLION)
- TABLE 09. GLOBAL SPINAL CORD STIMULATION DEVICES MARKET, BY END USER, 2022-2032 ($MILLION)
- TABLE 10. SPINAL CORD STIMULATION DEVICES MARKET FOR HOSPITALS, BY REGION, 2022-2032 ($MILLION)
- TABLE 11. SPINAL CORD STIMULATION DEVICES MARKET FOR AMBULATORY SURGICAL CENTERS, BY REGION, 2022-2032 ($MILLION)
- TABLE 12. SPINAL CORD STIMULATION DEVICES MARKET FOR OTHERS, BY REGION, 2022-2032 ($MILLION)
- TABLE 13. SPINAL CORD STIMULATION DEVICES MARKET, BY REGION, 2022-2032 ($MILLION)
- TABLE 14. NORTH AMERICA SPINAL CORD STIMULATION DEVICES MARKET, BY PRODUCT, 2022-2032 ($MILLION)
- TABLE 15. NORTH AMERICA SPINAL CORD STIMULATION DEVICES MARKET, BY INDICATION, 2022-2032 ($MILLION)
- TABLE 16. NORTH AMERICA SPINAL CORD STIMULATION DEVICES MARKET, BY END USER, 2022-2032 ($MILLION)
- TABLE 17. NORTH AMERICA SPINAL CORD STIMULATION DEVICES MARKET, BY COUNTRY, 2022-2032 ($MILLION)
- TABLE 18. U.S. SPINAL CORD STIMULATION DEVICES MARKET, BY PRODUCT, 2022-2032 ($MILLION)
- TABLE 19. U.S. SPINAL CORD STIMULATION DEVICES MARKET, BY INDICATION, 2022-2032 ($MILLION)
- TABLE 20. U.S. SPINAL CORD STIMULATION DEVICES MARKET, BY END USER, 2022-2032 ($MILLION)
- TABLE 21. CANADA SPINAL CORD STIMULATION DEVICES MARKET, BY PRODUCT, 2022-2032 ($MILLION)
- TABLE 22. CANADA SPINAL CORD STIMULATION DEVICES MARKET, BY INDICATION, 2022-2032 ($MILLION)
- TABLE 23. CANADA SPINAL CORD STIMULATION DEVICES MARKET, BY END USER, 2022-2032 ($MILLION)
- TABLE 24. MEXICO SPINAL CORD STIMULATION DEVICES MARKET, BY PRODUCT, 2022-2032 ($MILLION)
- TABLE 25. MEXICO SPINAL CORD STIMULATION DEVICES MARKET, BY INDICATION, 2022-2032 ($MILLION)
- TABLE 26. MEXICO SPINAL CORD STIMULATION DEVICES MARKET, BY END USER, 2022-2032 ($MILLION)
- TABLE 27. EUROPE SPINAL CORD STIMULATION DEVICES MARKET, BY PRODUCT, 2022-2032 ($MILLION)
- TABLE 28. EUROPE SPINAL CORD STIMULATION DEVICES MARKET, BY INDICATION, 2022-2032 ($MILLION)
- TABLE 29. EUROPE SPINAL CORD STIMULATION DEVICES MARKET, BY END USER, 2022-2032 ($MILLION)
- TABLE 30. EUROPE SPINAL CORD STIMULATION DEVICES MARKET, BY COUNTRY, 2022-2032 ($MILLION)
- TABLE 31. GERMANY SPINAL CORD STIMULATION DEVICES MARKET, BY PRODUCT, 2022-2032 ($MILLION)
- TABLE 32. GERMANY SPINAL CORD STIMULATION DEVICES MARKET, BY INDICATION, 2022-2032 ($MILLION)
- TABLE 33. GERMANY SPINAL CORD STIMULATION DEVICES MARKET, BY END USER, 2022-2032 ($MILLION)
- TABLE 34. FRANCE SPINAL CORD STIMULATION DEVICES MARKET, BY PRODUCT, 2022-2032 ($MILLION)
- TABLE 35. FRANCE SPINAL CORD STIMULATION DEVICES MARKET, BY INDICATION, 2022-2032 ($MILLION)
- TABLE 36. FRANCE SPINAL CORD STIMULATION DEVICES MARKET, BY END USER, 2022-2032 ($MILLION)
- TABLE 37. UK SPINAL CORD STIMULATION DEVICES MARKET, BY PRODUCT, 2022-2032 ($MILLION)
- TABLE 38. UK SPINAL CORD STIMULATION DEVICES MARKET, BY INDICATION, 2022-2032 ($MILLION)
- TABLE 39. UK SPINAL CORD STIMULATION DEVICES MARKET, BY END USER, 2022-2032 ($MILLION)
- TABLE 40. ITALY SPINAL CORD STIMULATION DEVICES MARKET, BY PRODUCT, 2022-2032 ($MILLION)
- TABLE 41. ITALY SPINAL CORD STIMULATION DEVICES MARKET, BY INDICATION, 2022-2032 ($MILLION)
- TABLE 42. ITALY SPINAL CORD STIMULATION DEVICES MARKET, BY END USER, 2022-2032 ($MILLION)
- TABLE 43. SPAIN SPINAL CORD STIMULATION DEVICES MARKET, BY PRODUCT, 2022-2032 ($MILLION)
- TABLE 44. SPAIN SPINAL CORD STIMULATION DEVICES MARKET, BY INDICATION, 2022-2032 ($MILLION)
- TABLE 45. SPAIN SPINAL CORD STIMULATION DEVICES MARKET, BY END USER, 2022-2032 ($MILLION)
- TABLE 46. REST OF EUROPE SPINAL CORD STIMULATION DEVICES MARKET, BY PRODUCT, 2022-2032 ($MILLION)
- TABLE 47. REST OF EUROPE SPINAL CORD STIMULATION DEVICES MARKET, BY INDICATION, 2022-2032 ($MILLION)
- TABLE 48. REST OF EUROPE SPINAL CORD STIMULATION DEVICES MARKET, BY END USER, 2022-2032 ($MILLION)
- TABLE 49. ASIA-PACIFIC SPINAL CORD STIMULATION DEVICES MARKET, BY PRODUCT, 2022-2032 ($MILLION)
- TABLE 50. ASIA-PACIFIC SPINAL CORD STIMULATION DEVICES MARKET, BY INDICATION, 2022-2032 ($MILLION)
- TABLE 51. ASIA-PACIFIC SPINAL CORD STIMULATION DEVICES MARKET, BY END USER, 2022-2032 ($MILLION)
- TABLE 52. ASIA-PACIFIC SPINAL CORD STIMULATION DEVICES MARKET, BY COUNTRY, 2022-2032 ($MILLION)
- TABLE 53. JAPAN SPINAL CORD STIMULATION DEVICES MARKET, BY PRODUCT, 2022-2032 ($MILLION)
- TABLE 54. JAPAN SPINAL CORD STIMULATION DEVICES MARKET, BY INDICATION, 2022-2032 ($MILLION)
- TABLE 55. JAPAN SPINAL CORD STIMULATION DEVICES MARKET, BY END USER, 2022-2032 ($MILLION)
- TABLE 56. CHINA SPINAL CORD STIMULATION DEVICES MARKET, BY PRODUCT, 2022-2032 ($MILLION)
- TABLE 57. CHINA SPINAL CORD STIMULATION DEVICES MARKET, BY INDICATION, 2022-2032 ($MILLION)
- TABLE 58. CHINA SPINAL CORD STIMULATION DEVICES MARKET, BY END USER, 2022-2032 ($MILLION)
- TABLE 59. INDIA SPINAL CORD STIMULATION DEVICES MARKET, BY PRODUCT, 2022-2032 ($MILLION)
- TABLE 60. INDIA SPINAL CORD STIMULATION DEVICES MARKET, BY INDICATION, 2022-2032 ($MILLION)
- TABLE 61. INDIA SPINAL CORD STIMULATION DEVICES MARKET, BY END USER, 2022-2032 ($MILLION)
- TABLE 62. AUSTRALIA SPINAL CORD STIMULATION DEVICES MARKET, BY PRODUCT, 2022-2032 ($MILLION)
- TABLE 63. AUSTRALIA SPINAL CORD STIMULATION DEVICES MARKET, BY INDICATION, 2022-2032 ($MILLION)
- TABLE 64. AUSTRALIA SPINAL CORD STIMULATION DEVICES MARKET, BY END USER, 2022-2032 ($MILLION)
- TABLE 65. SOUTH KOREA SPINAL CORD STIMULATION DEVICES MARKET, BY PRODUCT, 2022-2032 ($MILLION)
- TABLE 66. SOUTH KOREA SPINAL CORD STIMULATION DEVICES MARKET, BY INDICATION, 2022-2032 ($MILLION)
- TABLE 67. SOUTH KOREA SPINAL CORD STIMULATION DEVICES MARKET, BY END USER, 2022-2032 ($MILLION)
- TABLE 68. REST OF ASIA-PACIFIC SPINAL CORD STIMULATION DEVICES MARKET, BY PRODUCT, 2022-2032 ($MILLION)
- TABLE 69. REST OF ASIA-PACIFIC SPINAL CORD STIMULATION DEVICES MARKET, BY INDICATION, 2022-2032 ($MILLION)
- TABLE 70. REST OF ASIA-PACIFIC SPINAL CORD STIMULATION DEVICES MARKET, BY END USER, 2022-2032 ($MILLION)
- TABLE 71. LAMEA SPINAL CORD STIMULATION DEVICES MARKET, BY PRODUCT, 2022-2032 ($MILLION)
- TABLE 72. LAMEA SPINAL CORD STIMULATION DEVICES MARKET, BY INDICATION, 2022-2032 ($MILLION)
- TABLE 73. LAMEA SPINAL CORD STIMULATION DEVICES MARKET, BY END USER, 2022-2032 ($MILLION)
- TABLE 74. LAMEA SPINAL CORD STIMULATION DEVICES MARKET, BY COUNTRY, 2022-2032 ($MILLION)
- TABLE 75. LATIN AMERICA SPINAL CORD STIMULATION DEVICES MARKET, BY PRODUCT, 2022-2032 ($MILLION)
- TABLE 76. LATIN AMERICA SPINAL CORD STIMULATION DEVICES MARKET, BY INDICATION, 2022-2032 ($MILLION)
- TABLE 77. LATIN AMERICA SPINAL CORD STIMULATION DEVICES MARKET, BY END USER, 2022-2032 ($MILLION)
- TABLE 78. MIDDLE EAST AFRICA SPINAL CORD STIMULATION DEVICES MARKET, BY PRODUCT, 2022-2032 ($MILLION)
- TABLE 79. MIDDLE EAST AFRICA SPINAL CORD STIMULATION DEVICES MARKET, BY INDICATION, 2022-2032 ($MILLION)
- TABLE 80. MIDDLE EAST AFRICA SPINAL CORD STIMULATION DEVICES MARKET, BY END USER, 2022-2032 ($MILLION)
- TABLE 81. BOSTON SCIENTIFIC CORPORATION: KEY EXECUTIVES
- TABLE 82. BOSTON SCIENTIFIC CORPORATION: COMPANY SNAPSHOT
- TABLE 83. BOSTON SCIENTIFIC CORPORATION: PRODUCT SEGMENTS
- TABLE 84. BOSTON SCIENTIFIC CORPORATION: PRODUCT PORTFOLIO
- TABLE 85. BOSTON SCIENTIFIC CORPORATION: KEY STRATERGIES
- TABLE 86. MEDTRONIC PLC: KEY EXECUTIVES
- TABLE 87. MEDTRONIC PLC: COMPANY SNAPSHOT
- TABLE 88. MEDTRONIC PLC: PRODUCT SEGMENTS
- TABLE 89. MEDTRONIC PLC: PRODUCT PORTFOLIO
- TABLE 90. MEDTRONIC PLC: KEY STRATERGIES
- TABLE 91. ABBOTT LABORATORIES: KEY EXECUTIVES
- TABLE 92. ABBOTT LABORATORIES: COMPANY SNAPSHOT
- TABLE 93. ABBOTT LABORATORIES: PRODUCT SEGMENTS
- TABLE 94. ABBOTT LABORATORIES: PRODUCT PORTFOLIO
- TABLE 95. ABBOTT LABORATORIES: KEY STRATERGIES
- TABLE 96. NEVRO CORPORATION: KEY EXECUTIVES
- TABLE 97. NEVRO CORPORATION: COMPANY SNAPSHOT
- TABLE 98. NEVRO CORPORATION: PRODUCT SEGMENTS
- TABLE 99. NEVRO CORPORATION: PRODUCT PORTFOLIO
- TABLE 100. NEVRO CORPORATION: KEY STRATERGIES
- TABLE 101. BEIJING PINS MEDICAL CO., LTD: KEY EXECUTIVES
- TABLE 102. BEIJING PINS MEDICAL CO., LTD: COMPANY SNAPSHOT
- TABLE 103. BEIJING PINS MEDICAL CO., LTD: PRODUCT SEGMENTS
- TABLE 104. BEIJING PINS MEDICAL CO., LTD: PRODUCT PORTFOLIO
- TABLE 105. SALUDA MEDICAL PTY LTD.: KEY EXECUTIVES
- TABLE 106. SALUDA MEDICAL PTY LTD.: COMPANY SNAPSHOT
- TABLE 107. SALUDA MEDICAL PTY LTD.: PRODUCT SEGMENTS
- TABLE 108. SALUDA MEDICAL PTY LTD.: PRODUCT PORTFOLIO
- TABLE 109. SALUDA MEDICAL PTY LTD.: KEY STRATERGIES
- TABLE 110. NALU MEDICAL, INC.: KEY EXECUTIVES
- TABLE 111. NALU MEDICAL, INC.: COMPANY SNAPSHOT
- TABLE 112. NALU MEDICAL, INC.: PRODUCT SEGMENTS
- TABLE 113. NALU MEDICAL, INC.: PRODUCT PORTFOLIO
- TABLE 114. TELIATRY, INC.: KEY EXECUTIVES
- TABLE 115. TELIATRY, INC.: COMPANY SNAPSHOT
- TABLE 116. TELIATRY, INC.: PRODUCT SEGMENTS
- TABLE 117. TELIATRY, INC.: PRODUCT PORTFOLIO
- TABLE 118. GIMER MEDICAL: KEY EXECUTIVES
- TABLE 119. GIMER MEDICAL: COMPANY SNAPSHOT
- TABLE 120. GIMER MEDICAL: PRODUCT SEGMENTS
- TABLE 121. GIMER MEDICAL: PRODUCT PORTFOLIO
- TABLE 122. GIMER MEDICAL: KEY STRATERGIES
- TABLE 123. BIOTRONIK SE & CO. KG: KEY EXECUTIVES
- TABLE 124. BIOTRONIK SE & CO. KG: COMPANY SNAPSHOT
- TABLE 125. BIOTRONIK SE & CO. KG: PRODUCT SEGMENTS
- TABLE 126. BIOTRONIK SE & CO. KG: PRODUCT PORTFOLIO
- TABLE 127. BIOTRONIK SE & CO. KG: KEY STRATERGIES
LIST OF FIGURES
- FIGURE 01. SPINAL CORD STIMULATION DEVICES MARKET, 2022-2032
- FIGURE 02. SEGMENTATION OF SPINAL CORD STIMULATION DEVICES MARKET, 2022-2032
- FIGURE 03. TOP INVESTMENT POCKETS IN SPINAL CORD STIMULATION DEVICES MARKET (2023-2032)
- FIGURE 04. LOW BARGAINING POWER OF SUPPLIERS
- FIGURE 05. LOW BARGAINING POWER OF BUYERS
- FIGURE 06. LOW THREAT OF SUBSTITUTES
- FIGURE 07. LOW THREAT OF NEW ENTRANTS
- FIGURE 08. LOW INTENSITY OF RIVALRY
- FIGURE 09. DRIVERS, RESTRAINTS AND OPPORTUNITIES: GLOBALSPINAL CORD STIMULATION DEVICES MARKET
- FIGURE 10. SPINAL CORD STIMULATION DEVICES MARKET, BY PRODUCT, 2022(%)
- FIGURE 11. COMPARATIVE SHARE ANALYSIS OF SPINAL CORD STIMULATION DEVICES MARKET FOR RECHARGEABLE DEVICES, BY COUNTRY 2022 AND 2032(%)
- FIGURE 12. COMPARATIVE SHARE ANALYSIS OF SPINAL CORD STIMULATION DEVICES MARKET FOR NON-RECHARGEABLE DEVICES, BY COUNTRY 2022 AND 2032(%)
- FIGURE 13. SPINAL CORD STIMULATION DEVICES MARKET, BY INDICATION, 2022(%)
- FIGURE 14. COMPARATIVE SHARE ANALYSIS OF SPINAL CORD STIMULATION DEVICES MARKET FOR FAILED BACK SURGERY SYNDROME, BY COUNTRY 2022 AND 2032(%)
- FIGURE 15. COMPARATIVE SHARE ANALYSIS OF SPINAL CORD STIMULATION DEVICES MARKET FOR COMPLEX REGIONAL PAIN SYNDROME, BY COUNTRY 2022 AND 2032(%)
- FIGURE 16. COMPARATIVE SHARE ANALYSIS OF SPINAL CORD STIMULATION DEVICES MARKET FOR DEGENERATIVE DISC DISEASE, BY COUNTRY 2022 AND 2032(%)
- FIGURE 17. COMPARATIVE SHARE ANALYSIS OF SPINAL CORD STIMULATION DEVICES MARKET FOR OTHERS, BY COUNTRY 2022 AND 2032(%)
- FIGURE 18. SPINAL CORD STIMULATION DEVICES MARKET, BY END USER, 2022(%)
- FIGURE 19. COMPARATIVE SHARE ANALYSIS OF SPINAL CORD STIMULATION DEVICES MARKET FOR HOSPITALS, BY COUNTRY 2022 AND 2032(%)
- FIGURE 20. COMPARATIVE SHARE ANALYSIS OF SPINAL CORD STIMULATION DEVICES MARKET FOR AMBULATORY SURGICAL CENTERS, BY COUNTRY 2022 AND 2032(%)
- FIGURE 21. COMPARATIVE SHARE ANALYSIS OF SPINAL CORD STIMULATION DEVICES MARKET FOR OTHERS, BY COUNTRY 2022 AND 2032(%)
- FIGURE 22. SPINAL CORD STIMULATION DEVICES MARKET BY REGION, 2022
- FIGURE 23. U.S. SPINAL CORD STIMULATION DEVICES MARKET, 2022-2032 ($MILLION)
- FIGURE 24. CANADA SPINAL CORD STIMULATION DEVICES MARKET, 2022-2032 ($MILLION)
- FIGURE 25. MEXICO SPINAL CORD STIMULATION DEVICES MARKET, 2022-2032 ($MILLION)
- FIGURE 26. GERMANY SPINAL CORD STIMULATION DEVICES MARKET, 2022-2032 ($MILLION)
- FIGURE 27. FRANCE SPINAL CORD STIMULATION DEVICES MARKET, 2022-2032 ($MILLION)
- FIGURE 28. UK SPINAL CORD STIMULATION DEVICES MARKET, 2022-2032 ($MILLION)
- FIGURE 29. ITALY SPINAL CORD STIMULATION DEVICES MARKET, 2022-2032 ($MILLION)
- FIGURE 30. SPAIN SPINAL CORD STIMULATION DEVICES MARKET, 2022-2032 ($MILLION)
- FIGURE 31. REST OF EUROPE SPINAL CORD STIMULATION DEVICES MARKET, 2022-2032 ($MILLION)
- FIGURE 32. JAPAN SPINAL CORD STIMULATION DEVICES MARKET, 2022-2032 ($MILLION)
- FIGURE 33. CHINA SPINAL CORD STIMULATION DEVICES MARKET, 2022-2032 ($MILLION)
- FIGURE 34. INDIA SPINAL CORD STIMULATION DEVICES MARKET, 2022-2032 ($MILLION)
- FIGURE 35. AUSTRALIA SPINAL CORD STIMULATION DEVICES MARKET, 2022-2032 ($MILLION)
- FIGURE 36. SOUTH KOREA SPINAL CORD STIMULATION DEVICES MARKET, 2022-2032 ($MILLION)
- FIGURE 37. REST OF ASIA-PACIFIC SPINAL CORD STIMULATION DEVICES MARKET, 2022-2032 ($MILLION)
- FIGURE 38. LATIN AMERICA SPINAL CORD STIMULATION DEVICES MARKET, 2022-2032 ($MILLION)
- FIGURE 39. MIDDLE EAST AFRICA SPINAL CORD STIMULATION DEVICES MARKET, 2022-2032 ($MILLION)
- FIGURE 40. TOP WINNING STRATEGIES, BY YEAR
- FIGURE 41. TOP WINNING STRATEGIES, BY DEVELOPMENT
- FIGURE 42. TOP WINNING STRATEGIES, BY COMPANY
- FIGURE 43. PRODUCT MAPPING OF TOP 10 PLAYERS
- FIGURE 44. COMPETITIVE DASHBOARD
- FIGURE 45. COMPETITIVE HEATMAP: SPINAL CORD STIMULATION DEVICES MARKET
- FIGURE 46. TOP PLAYER POSITIONING, 2022
- FIGURE 47. BOSTON SCIENTIFIC CORPORATION: NET SALES, 2020-2022 ($MILLION)
- FIGURE 48. BOSTON SCIENTIFIC CORPORATION: REVENUE SHARE BY SEGMENT, 2022 (%)
- FIGURE 49. BOSTON SCIENTIFIC CORPORATION: REVENUE SHARE BY REGION, 2022 (%)
- FIGURE 50. MEDTRONIC PLC: NET SALES, 2020-2022 ($MILLION)
- FIGURE 51. MEDTRONIC PLC: REVENUE SHARE BY SEGMENT, 2022 (%)
- FIGURE 52. MEDTRONIC PLC: REVENUE SHARE BY REGION, 2022 (%)
- FIGURE 53. ABBOTT LABORATORIES: NET SALES, 2020-2022 ($MILLION)
- FIGURE 54. ABBOTT LABORATORIES: REVENUE SHARE BY SEGMENT, 2022 (%)
- FIGURE 55. ABBOTT LABORATORIES: REVENUE SHARE BY REGION, 2022 (%)
- FIGURE 56. NEVRO CORPORATION: NET REVENUE, 2020-2022 ($MILLION)
- FIGURE 57. NEVRO CORPORATION: REVENUE SHARE BY REGION, 2022 (%)
 2025年脊髓刺激设备全球市场报告
 全球脊髓刺激市场:规模、占有率、趋势分析(2025-2031):MedCore
 脊髓刺激市场依产品类型、适应症、通路和最终用途划分-2025-2030 年全球预测2025年脊髓刺激全球市场报告
 脊髓刺激市场规模、份额、成长分析、按适应症、按产品、按最终用户、按地区 - 产业预测,2024-2031 年
 欧洲慢性疼痛脊髓刺激装置市场预测至 2030 年 - 区域分析 - 按产品类型、应用和最终用户
 脊髓刺激市场:预测(2024-2029)
 欧洲和中东慢性疼痛脊髓刺激装置市场规模和预测、全球和地区份额、趋势和成长机会分析报告范围:按产品类型、应用、最终用户和区域分析
 全球脊髓刺激市场 - 2023-2030
 全球脊髓刺激设备市场研究报告 - 行业分析、规模、份额、增长、趋势及2023至2030年预测