


 |
市场调查报告书
商品编码
1365709
手术机器人市场:按组成部分、手术类型:2023-2032 年全球机会分析和产业预测Surgical Robotics Market By Component, By Surgery Type : Global Opportunity Analysis and Industry Forecast, 2023-2032 |
||||||
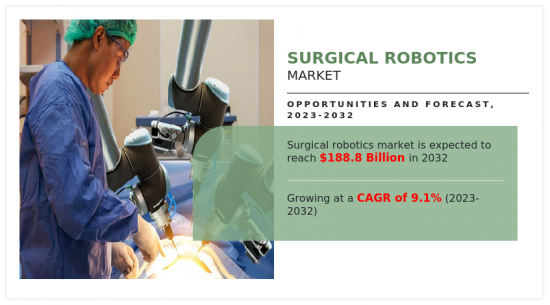
2022年手术机器人市场价值为788亿美元,预计2023年至2032年年复合成长率为9.1%,到2032年达到1888亿美元。
由于医疗设备和消耗品领域对手术机器人系统和配件的需求不断增加,2023年至2032年手术机器人市场可能会出现9.1%的显着成长率。
医疗领域对自动化的需求不断增长以及微创手术的需求激增是推动手术机器人市场的关键要素。此外,癌症、神经系统和妇科疾病的增加预计将推动机器人手术系统的采用。机器人手术系统术后併发症较少,并且可以降低劳动成本。已开发经济体和新兴经济体的大型医院越来越青睐自动化手术/医院服务,最终推动了市场成长。
由于对精确和微创手术技术的需求不断增加,手术机器人市场正在经历显着成长。手术机器人提高了灵活性和精确度,使外科医生能够以更小的切口执行复杂的手术。结果是减少患者创伤、减轻疼痛、加快復原时间并缩短住院时间。
手术机器人市场的主要促进因素之一是技术的不断进步。机器人系统正在从基本的远端操纵器发展为具有增强的灵活性、精度和影像处理能力的复杂平台。人工智慧(AI)和机器学习演算法的整合正在进一步扩展手术机器人的功能,实现手术过程中的即时资料分析和决策。这些技术进步正在提高手术精度并扩大机器人手术的范围。
随着手术机器人变得更加聪明和强大,它们使外科医生能够以更大的信心和成功率进行日益复杂和精细的手术,从而支持市场成长。另一方面,与外科机器人手术相关的高成本以及由于仪器破损和系统错误导致的意外伤亡可能会阻碍市场成长。然而,开发创新手术机器人系统的研发活动激增,为市场成长提供了利润丰厚的机会。
手术机器人市场分为组件、手术类型和区域。按组件划分,市场分为系统、配件和服务。依手术类型划分,市场分为妇科、泌尿系统、颅神经、骨科、一般外科和其他手术。按地区划分,北美(美国、加拿大、墨西哥)、欧洲(德国、法国、英国、义大利、西班牙、其他欧洲地区)、亚太地区(日本、中国、澳洲、印度、韩国、其他亚太地区) ),亚太地区其他地区(拉丁美洲、中东和非洲)进行了分析。
手术机器人市场的主要企业有施乐辉公司、美敦力公司、史赛克公司、Intuitive Surgical, Inc.、Zimmer Biomet Holding Inc.、雷尼绍公司、美的集团有限公司、强生公司、Accuray Incorporated、CMR外科有限公司等。主要参与企业正在采用产品发布和产品核可作为关键发展策略,以改善产品系列。
目录
第1章简介
第2章执行摘要
第3章市场概况
- 市场定义和范围
- 主要发现
- 影响要素
- 主要投资机会
- 波特五力分析
- 市场动态
- 促进因素
- 慢性病增加
- 技术进步与精准度
- 微创手术需求不断成长
- 抑制因素
- 手术机器人系统和与机器人手术相关的高成本
- 新兴国家缺乏病患意识
- 机会
- 活性化研发活动
- 新兴和开拓经济体的机会
- 促进因素
第4章手术机器人市场:依组成部分
- 概述
- 系统
- 配件
- 服务
第5章手术机器人市场:依手术类型
- 概述
- 妇科
- 泌尿系统
- 颅神经
- 整形外科
- 一般的
- 其他的
第6章手术机器人市场:按地区
- 概述
- 北美洲
- 美国
- 加拿大
- 墨西哥
- 欧洲
- 德国
- 法国
- 英国
- 义大利
- 西班牙
- 其他的
- 亚太地区
- 日本
- 中国
- 印度
- 澳洲
- 韩国
- 其他的
- 拉丁美洲
- 拉丁美洲
- 中东/非洲
第7章竞争形势
- 介绍
- 关键成功策略
- 10家主要企业产品图谱
- 竞争仪表板
- 竞争热图
- 2022年主要企业定位
第8章公司简介
- Smith & Nephew plc
- Medtronic plc
- Stryker Corporation.
- Intuitive Surgical, Inc.
- Renishaw plc
- Zimmer Biomet Holding, Inc.
- Midea Group Co., Ltd.
- Johnson & Johnson
- Accuray Incorporated
- CMR Surgical Ltd.
According to a new report published by Allied Market Research, titled, "Surgical Robotics Market," The surgical robotics market was valued at $78.8 billion in 2022, and is estimated to reach $188.8 billion by 2032, growing at a CAGR of 9.1% from 2023 to 2032. The Surgical Robotics Market is likely to experience a significant growth rate of 9.1% from 2023-2032 owing to increase in demand for surgical robotic systems and accessories from medical devices and supplies sector - Allied Market Research
The increase in need for automation in the healthcare sector and surge in demand for minimally invasive surgeries are the major factors that drive the surgical robotic market. In addition, rise in incidences of cancer, neurological disorders, gynecological diseases are anticipated to boost the adoption of robotic surgical systems. Surgical robotic systems offer less post-surgical complications and reduce labor cost. Large-scale hospitals based in developed and developing economies are now favoring automated surgical/hospital services due to this, which ultimately drives the market growth.
The surgical robotics market has experienced significant growth owing to the increase in demand for precision & minimally invasive surgical techniques. Surgical robots offer enhanced dexterity and accuracy, enabling surgeons to perform complex procedures through smaller incisions. This results in reduced trauma to the patient, less pain, quicker recovery times, and shorter hospital stays.
One of the primary driving factors for the surgical robotics market is the continuous advancement of technology. Robotic systems have evolved from basic telemanipulates to sophisticated platforms that offer enhanced dexterity, precision, and imaging capabilities. The integration of artificial intelligence (AI) and machine learning algorithms has further augmented the capabilities of surgical robots, enabling real-time data analysis and decision-making during procedures. These technological advancements have improved the accuracy of surgical interventions and expanded the scope of procedures that are performed robotically.
As surgical robots become more intelligent and capable, they enable surgeons to tackle increasingly complex and delicate surgeries with greater confidence and success rates, which supports the market growth. On the other hand, high cost associated with surgical robotics procedures and accidental death/injuries due to broken instruments and system errors are likely to hinder the market growth. However, the surge in R&D activities for developing innovative surgical robotic systems provides lucrative opportunity for market growth.
The surgical robotics market is segmented into component, surgery type, and region. By component, the market is segregated into systems, accessories, and services. By surgery type, the market is categorized into gynecology surgery, urology surgery, neurosurgery, orthopedic surgery, general surgery, and other surgeries. Region wise, the market is analyzed across North America (the U.S., Canada, and Mexico), Europe (Germany, France, the UK, Italy, Spain, and rest of Europe), Asia-Pacific (Japan, China, Australia, India, South Korea, and rest of Asia-Pacific), and LAMEA (Latin America and Middle East and Africa).
Major key players that operate in the surgical robotics market are Smith & Nephew plc, Medtronic plc, Stryker Corporation, Intuitive Surgical, Inc., Zimmer Biomet Holding Inc., Renishaw plc, Midea Group Co., Ltd., Johnson & Johnson, Accuray Incorporated, and CMR Surgical Ltd. The key players have adopted product launch and product approval as key developmental strategies to improve the product portfolio of the surgical robotics market.
Key Benefits For Stakeholders
- This report provides a quantitative analysis of the market segments, current trends, estimations, and dynamics of the surgical robotics market analysis from 2022 to 2032 to identify the prevailing surgical robotics market opportunities.
- The market research is offered along with information related to key drivers, restraints, and opportunities.
- Porter's five forces analysis highlights the potency of buyers and suppliers to enable stakeholders make profit-oriented business decisions and strengthen their supplier-buyer network.
- In-depth analysis of the surgical robotics market segmentation assists to determine the prevailing market opportunities.
- Major countries in each region are mapped according to their revenue contribution to the global market.
- Market player positioning facilitates benchmarking and provides a clear understanding of the present position of the market players.
- The report includes the analysis of the regional as well as global surgical robotics market trends, key players, market segments, application areas, and market growth strategies.
Additional benefits you will get with this purchase are:
- Quarterly Update and* (only available with a corporate license, on listed price)
- 5 additional Company Profile of client Choice pre- or Post-purchase, as a free update.
- Free Upcoming Version on the Purchase of Five and Enterprise User License.
- 16 analyst hours of support* (post-purchase, if you find additional data requirements upon review of the report, you may receive support amounting to 16 analyst hours to solve questions, and post-sale queries)
- 15% Free Customization* (in case the scope or segment of the report does not match your requirements, 20% is equivalent to 3 working days of free work, applicable once)
- Free data Pack on the Five and Enterprise User License. (Excel version of the report)
- Free Updated report if the report is 6-12 months old or older.
- 24-hour priority response*
- Free Industry updates and white papers.
Possible Customization with this report (with additional cost and timeline talk to the sales executive to know more)
- Regulatory Guidelines
- Additional company profiles with specific to client's interest
- Additional country or region analysis- market size and forecast
- Expanded list for Company Profiles
- Historic market data
- Key player details (including location, contact details, supplier/vendor network etc. in excel format)
Key Market Segments
By Component
- Systems
- Accessories
- Services
By Surgery Type
- Gynecology Surgery
- Urology Surgery
- Neurosurgery
- Orthopedic Surgery
- General Surgery
- Other Surgeries
By Region
- North America
- U.S.
- Canada
- Mexico
- Europe
- Germany
- France
- UK
- Italy
- Spain
- Rest of Europe
- Asia-Pacific
- Japan
- China
- India
- Australia
- South Korea
- Rest of Asia-Pacific
- LAMEA
- Latin America
- Middle East And Africa
Key Market Players:
- Smith & Nephew plc
- Intuitive Surgical, Inc.
- Johnson & Johnson
- Accuray Incorporated
- Zimmer Biomet Holding, Inc.
- Stryker Corporation.
- Midea Group Co., Ltd.
- CMR Surgical Ltd.
- Medtronic plc
- Renishaw plc
TABLE OF CONTENTS
CHAPTER 1: INTRODUCTION
- 1.1. Report description
- 1.2. Key market segments
- 1.3. Key benefits to the stakeholders
- 1.4. Research Methodology
- 1.4.1. Primary research
- 1.4.2. Secondary research
- 1.4.3. Analyst tools and models
CHAPTER 2: EXECUTIVE SUMMARY
- 2.1. CXO Perspective
CHAPTER 3: MARKET OVERVIEW
- 3.1. Market definition and scope
- 3.2. Key findings
- 3.2.1. Top impacting factors
- 3.2.2. Top investment pockets
- 3.3. Porter's five forces analysis
- 3.3.1. Moderate bargaining power of suppliers
- 3.3.2. Moderate threat of new entrants
- 3.3.3. Moderate threat of substitutes
- 3.3.4. Moderate intensity of rivalry
- 3.3.5. Low bargaining power of buyers
- 3.4. Market dynamics
- 3.4.1. Drivers
- 3.4.1.1. Rise in occurrence of chronic diseases
- 3.4.1.2. Technological advancements and precision
- 3.4.1.3. Rise in demand for minimally invasive surgical procedures
- 3.4.2. Restraints
- 3.4.2.1. High cost associated with surgical robotic systems and robotic surgeries
- 3.4.2.2. Lack of awareness among patients in emerging economies
- 3.4.3. Opportunities
- 3.4.3.1. Rise in R&D activities
- 3.4.3.2. Opportunities in emerging and untapped economies
- 3.4.1. Drivers
CHAPTER 4: SURGICAL ROBOTICS MARKET, BY COMPONENT
- 4.1. Overview
- 4.1.1. Market size and forecast
- 4.2. Systems
- 4.2.1. Key market trends, growth factors and opportunities
- 4.2.2. Market size and forecast, by region
- 4.2.3. Market share analysis by country
- 4.3. Accessories
- 4.3.1. Key market trends, growth factors and opportunities
- 4.3.2. Market size and forecast, by region
- 4.3.3. Market share analysis by country
- 4.4. Services
- 4.4.1. Key market trends, growth factors and opportunities
- 4.4.2. Market size and forecast, by region
- 4.4.3. Market share analysis by country
CHAPTER 5: SURGICAL ROBOTICS MARKET, BY SURGERY TYPE
- 5.1. Overview
- 5.1.1. Market size and forecast
- 5.2. Gynecology Surgery
- 5.2.1. Key market trends, growth factors and opportunities
- 5.2.2. Market size and forecast, by region
- 5.2.3. Market share analysis by country
- 5.3. Urology Surgery
- 5.3.1. Key market trends, growth factors and opportunities
- 5.3.2. Market size and forecast, by region
- 5.3.3. Market share analysis by country
- 5.4. Neurosurgery
- 5.4.1. Key market trends, growth factors and opportunities
- 5.4.2. Market size and forecast, by region
- 5.4.3. Market share analysis by country
- 5.5. Orthopedic Surgery
- 5.5.1. Key market trends, growth factors and opportunities
- 5.5.2. Market size and forecast, by region
- 5.5.3. Market share analysis by country
- 5.6. General Surgery
- 5.6.1. Key market trends, growth factors and opportunities
- 5.6.2. Market size and forecast, by region
- 5.6.3. Market share analysis by country
- 5.7. Other Surgeries
- 5.7.1. Key market trends, growth factors and opportunities
- 5.7.2. Market size and forecast, by region
- 5.7.3. Market share analysis by country
CHAPTER 6: SURGICAL ROBOTICS MARKET, BY REGION
- 6.1. Overview
- 6.1.1. Market size and forecast By Region
- 6.2. North America
- 6.2.1. Key market trends, growth factors and opportunities
- 6.2.2. Market size and forecast, by Component
- 6.2.3. Market size and forecast, by Surgery Type
- 6.2.4. Market size and forecast, by country
- 6.2.4.1. U.S.
- 6.2.4.1.1. Market size and forecast, by Component
- 6.2.4.1.2. Market size and forecast, by Surgery Type
- 6.2.4.2. Canada
- 6.2.4.2.1. Market size and forecast, by Component
- 6.2.4.2.2. Market size and forecast, by Surgery Type
- 6.2.4.3. Mexico
- 6.2.4.3.1. Market size and forecast, by Component
- 6.2.4.3.2. Market size and forecast, by Surgery Type
- 6.3. Europe
- 6.3.1. Key market trends, growth factors and opportunities
- 6.3.2. Market size and forecast, by Component
- 6.3.3. Market size and forecast, by Surgery Type
- 6.3.4. Market size and forecast, by country
- 6.3.4.1. Germany
- 6.3.4.1.1. Market size and forecast, by Component
- 6.3.4.1.2. Market size and forecast, by Surgery Type
- 6.3.4.2. France
- 6.3.4.2.1. Market size and forecast, by Component
- 6.3.4.2.2. Market size and forecast, by Surgery Type
- 6.3.4.3. UK
- 6.3.4.3.1. Market size and forecast, by Component
- 6.3.4.3.2. Market size and forecast, by Surgery Type
- 6.3.4.4. Italy
- 6.3.4.4.1. Market size and forecast, by Component
- 6.3.4.4.2. Market size and forecast, by Surgery Type
- 6.3.4.5. Spain
- 6.3.4.5.1. Market size and forecast, by Component
- 6.3.4.5.2. Market size and forecast, by Surgery Type
- 6.3.4.6. Rest of Europe
- 6.3.4.6.1. Market size and forecast, by Component
- 6.3.4.6.2. Market size and forecast, by Surgery Type
- 6.4. Asia-Pacific
- 6.4.1. Key market trends, growth factors and opportunities
- 6.4.2. Market size and forecast, by Component
- 6.4.3. Market size and forecast, by Surgery Type
- 6.4.4. Market size and forecast, by country
- 6.4.4.1. Japan
- 6.4.4.1.1. Market size and forecast, by Component
- 6.4.4.1.2. Market size and forecast, by Surgery Type
- 6.4.4.2. China
- 6.4.4.2.1. Market size and forecast, by Component
- 6.4.4.2.2. Market size and forecast, by Surgery Type
- 6.4.4.3. India
- 6.4.4.3.1. Market size and forecast, by Component
- 6.4.4.3.2. Market size and forecast, by Surgery Type
- 6.4.4.4. Australia
- 6.4.4.4.1. Market size and forecast, by Component
- 6.4.4.4.2. Market size and forecast, by Surgery Type
- 6.4.4.5. South Korea
- 6.4.4.5.1. Market size and forecast, by Component
- 6.4.4.5.2. Market size and forecast, by Surgery Type
- 6.4.4.6. Rest of Asia-Pacific
- 6.4.4.6.1. Market size and forecast, by Component
- 6.4.4.6.2. Market size and forecast, by Surgery Type
- 6.5. LAMEA
- 6.5.1. Key market trends, growth factors and opportunities
- 6.5.2. Market size and forecast, by Component
- 6.5.3. Market size and forecast, by Surgery Type
- 6.5.4. Market size and forecast, by country
- 6.5.4.1. Latin America
- 6.5.4.1.1. Market size and forecast, by Component
- 6.5.4.1.2. Market size and forecast, by Surgery Type
- 6.5.4.2. Middle East And Africa
- 6.5.4.2.1. Market size and forecast, by Component
- 6.5.4.2.2. Market size and forecast, by Surgery Type
CHAPTER 7: COMPETITIVE LANDSCAPE
- 7.1. Introduction
- 7.2. Top winning strategies
- 7.3. Product Mapping of Top 10 Player
- 7.4. Competitive Dashboard
- 7.5. Competitive Heatmap
- 7.6. Top player positioning, 2022
CHAPTER 8: COMPANY PROFILES
- 8.1. Smith & Nephew plc
- 8.1.1. Company overview
- 8.1.2. Key Executives
- 8.1.3. Company snapshot
- 8.1.4. Operating business segments
- 8.1.5. Product portfolio
- 8.1.6. Business performance
- 8.1.7. Key strategic moves and developments
- 8.2. Medtronic plc
- 8.2.1. Company overview
- 8.2.2. Key Executives
- 8.2.3. Company snapshot
- 8.2.4. Operating business segments
- 8.2.5. Product portfolio
- 8.2.6. Business performance
- 8.2.7. Key strategic moves and developments
- 8.3. Stryker Corporation.
- 8.3.1. Company overview
- 8.3.2. Key Executives
- 8.3.3. Company snapshot
- 8.3.4. Operating business segments
- 8.3.5. Product portfolio
- 8.3.6. Business performance
- 8.4. Intuitive Surgical, Inc.
- 8.4.1. Company overview
- 8.4.2. Key Executives
- 8.4.3. Company snapshot
- 8.4.4. Operating business segments
- 8.4.5. Product portfolio
- 8.4.6. Business performance
- 8.5. Renishaw plc
- 8.5.1. Company overview
- 8.5.2. Key Executives
- 8.5.3. Company snapshot
- 8.5.4. Operating business segments
- 8.5.5. Product portfolio
- 8.5.6. Business performance
- 8.5.7. Key strategic moves and developments
- 8.6. Zimmer Biomet Holding, Inc.
- 8.6.1. Company overview
- 8.6.2. Key Executives
- 8.6.3. Company snapshot
- 8.6.4. Operating business segments
- 8.6.5. Product portfolio
- 8.6.6. Business performance
- 8.6.7. Key strategic moves and developments
- 8.7. Midea Group Co., Ltd.
- 8.7.1. Company overview
- 8.7.2. Key Executives
- 8.7.3. Company snapshot
- 8.7.4. Operating business segments
- 8.7.5. Product portfolio
- 8.7.6. Business performance
- 8.8. Johnson & Johnson
- 8.8.1. Company overview
- 8.8.2. Key Executives
- 8.8.3. Company snapshot
- 8.8.4. Operating business segments
- 8.8.5. Product portfolio
- 8.8.6. Business performance
- 8.8.7. Key strategic moves and developments
- 8.9. Accuray Incorporated
- 8.9.1. Company overview
- 8.9.2. Key Executives
- 8.9.3. Company snapshot
- 8.9.4. Operating business segments
- 8.9.5. Product portfolio
- 8.9.6. Business performance
- 8.10. CMR Surgical Ltd.
- 8.10.1. Company overview
- 8.10.2. Key Executives
- 8.10.3. Company snapshot
- 8.10.4. Operating business segments
- 8.10.5. Product portfolio
LIST OF TABLES
- TABLE 01. GLOBAL SURGICAL ROBOTICS MARKET, BY COMPONENT, 2022-2032 ($MILLION)
- TABLE 02. SURGICAL ROBOTICS MARKET FOR SYSTEMS, BY REGION, 2022-2032 ($MILLION)
- TABLE 03. SURGICAL ROBOTICS MARKET FOR ACCESSORIES, BY REGION, 2022-2032 ($MILLION)
- TABLE 04. SURGICAL ROBOTICS MARKET FOR SERVICES, BY REGION, 2022-2032 ($MILLION)
- TABLE 05. GLOBAL SURGICAL ROBOTICS MARKET, BY SURGERY TYPE, 2022-2032 ($MILLION)
- TABLE 06. SURGICAL ROBOTICS MARKET FOR GYNECOLOGY SURGERY, BY REGION, 2022-2032 ($MILLION)
- TABLE 07. SURGICAL ROBOTICS MARKET FOR UROLOGY SURGERY, BY REGION, 2022-2032 ($MILLION)
- TABLE 08. SURGICAL ROBOTICS MARKET FOR NEUROSURGERY, BY REGION, 2022-2032 ($MILLION)
- TABLE 09. SURGICAL ROBOTICS MARKET FOR ORTHOPEDIC SURGERY, BY REGION, 2022-2032 ($MILLION)
- TABLE 10. SURGICAL ROBOTICS MARKET FOR GENERAL SURGERY, BY REGION, 2022-2032 ($MILLION)
- TABLE 11. SURGICAL ROBOTICS MARKET FOR OTHER SURGERIES, BY REGION, 2022-2032 ($MILLION)
- TABLE 12. SURGICAL ROBOTICS MARKET, BY REGION, 2022-2032 ($MILLION)
- TABLE 13. NORTH AMERICA SURGICAL ROBOTICS MARKET, BY COMPONENT, 2022-2032 ($MILLION)
- TABLE 14. NORTH AMERICA SURGICAL ROBOTICS MARKET, BY SURGERY TYPE, 2022-2032 ($MILLION)
- TABLE 15. NORTH AMERICA SURGICAL ROBOTICS MARKET, BY COUNTRY, 2022-2032 ($MILLION)
- TABLE 16. U.S. SURGICAL ROBOTICS MARKET, BY COMPONENT, 2022-2032 ($MILLION)
- TABLE 17. U.S. SURGICAL ROBOTICS MARKET, BY SURGERY TYPE, 2022-2032 ($MILLION)
- TABLE 18. CANADA SURGICAL ROBOTICS MARKET, BY COMPONENT, 2022-2032 ($MILLION)
- TABLE 19. CANADA SURGICAL ROBOTICS MARKET, BY SURGERY TYPE, 2022-2032 ($MILLION)
- TABLE 20. MEXICO SURGICAL ROBOTICS MARKET, BY COMPONENT, 2022-2032 ($MILLION)
- TABLE 21. MEXICO SURGICAL ROBOTICS MARKET, BY SURGERY TYPE, 2022-2032 ($MILLION)
- TABLE 22. EUROPE SURGICAL ROBOTICS MARKET, BY COMPONENT, 2022-2032 ($MILLION)
- TABLE 23. EUROPE SURGICAL ROBOTICS MARKET, BY SURGERY TYPE, 2022-2032 ($MILLION)
- TABLE 24. EUROPE SURGICAL ROBOTICS MARKET, BY COUNTRY, 2022-2032 ($MILLION)
- TABLE 25. GERMANY SURGICAL ROBOTICS MARKET, BY COMPONENT, 2022-2032 ($MILLION)
- TABLE 26. GERMANY SURGICAL ROBOTICS MARKET, BY SURGERY TYPE, 2022-2032 ($MILLION)
- TABLE 27. FRANCE SURGICAL ROBOTICS MARKET, BY COMPONENT, 2022-2032 ($MILLION)
- TABLE 28. FRANCE SURGICAL ROBOTICS MARKET, BY SURGERY TYPE, 2022-2032 ($MILLION)
- TABLE 29. UK SURGICAL ROBOTICS MARKET, BY COMPONENT, 2022-2032 ($MILLION)
- TABLE 30. UK SURGICAL ROBOTICS MARKET, BY SURGERY TYPE, 2022-2032 ($MILLION)
- TABLE 31. ITALY SURGICAL ROBOTICS MARKET, BY COMPONENT, 2022-2032 ($MILLION)
- TABLE 32. ITALY SURGICAL ROBOTICS MARKET, BY SURGERY TYPE, 2022-2032 ($MILLION)
- TABLE 33. SPAIN SURGICAL ROBOTICS MARKET, BY COMPONENT, 2022-2032 ($MILLION)
- TABLE 34. SPAIN SURGICAL ROBOTICS MARKET, BY SURGERY TYPE, 2022-2032 ($MILLION)
- TABLE 35. REST OF EUROPE SURGICAL ROBOTICS MARKET, BY COMPONENT, 2022-2032 ($MILLION)
- TABLE 36. REST OF EUROPE SURGICAL ROBOTICS MARKET, BY SURGERY TYPE, 2022-2032 ($MILLION)
- TABLE 37. ASIA-PACIFIC SURGICAL ROBOTICS MARKET, BY COMPONENT, 2022-2032 ($MILLION)
- TABLE 38. ASIA-PACIFIC SURGICAL ROBOTICS MARKET, BY SURGERY TYPE, 2022-2032 ($MILLION)
- TABLE 39. ASIA-PACIFIC SURGICAL ROBOTICS MARKET, BY COUNTRY, 2022-2032 ($MILLION)
- TABLE 40. JAPAN SURGICAL ROBOTICS MARKET, BY COMPONENT, 2022-2032 ($MILLION)
- TABLE 41. JAPAN SURGICAL ROBOTICS MARKET, BY SURGERY TYPE, 2022-2032 ($MILLION)
- TABLE 42. CHINA SURGICAL ROBOTICS MARKET, BY COMPONENT, 2022-2032 ($MILLION)
- TABLE 43. CHINA SURGICAL ROBOTICS MARKET, BY SURGERY TYPE, 2022-2032 ($MILLION)
- TABLE 44. INDIA SURGICAL ROBOTICS MARKET, BY COMPONENT, 2022-2032 ($MILLION)
- TABLE 45. INDIA SURGICAL ROBOTICS MARKET, BY SURGERY TYPE, 2022-2032 ($MILLION)
- TABLE 46. AUSTRALIA SURGICAL ROBOTICS MARKET, BY COMPONENT, 2022-2032 ($MILLION)
- TABLE 47. AUSTRALIA SURGICAL ROBOTICS MARKET, BY SURGERY TYPE, 2022-2032 ($MILLION)
- TABLE 48. SOUTH KOREA SURGICAL ROBOTICS MARKET, BY COMPONENT, 2022-2032 ($MILLION)
- TABLE 49. SOUTH KOREA SURGICAL ROBOTICS MARKET, BY SURGERY TYPE, 2022-2032 ($MILLION)
- TABLE 50. REST OF ASIA-PACIFIC SURGICAL ROBOTICS MARKET, BY COMPONENT, 2022-2032 ($MILLION)
- TABLE 51. REST OF ASIA-PACIFIC SURGICAL ROBOTICS MARKET, BY SURGERY TYPE, 2022-2032 ($MILLION)
- TABLE 52. LAMEA SURGICAL ROBOTICS MARKET, BY COMPONENT, 2022-2032 ($MILLION)
- TABLE 53. LAMEA SURGICAL ROBOTICS MARKET, BY SURGERY TYPE, 2022-2032 ($MILLION)
- TABLE 54. LAMEA SURGICAL ROBOTICS MARKET, BY COUNTRY, 2022-2032 ($MILLION)
- TABLE 55. LATIN AMERICA SURGICAL ROBOTICS MARKET, BY COMPONENT, 2022-2032 ($MILLION)
- TABLE 56. LATIN AMERICA SURGICAL ROBOTICS MARKET, BY SURGERY TYPE, 2022-2032 ($MILLION)
- TABLE 57. MIDDLE EAST AND AFRICA SURGICAL ROBOTICS MARKET, BY COMPONENT, 2022-2032 ($MILLION)
- TABLE 58. MIDDLE EAST AND AFRICA SURGICAL ROBOTICS MARKET, BY SURGERY TYPE, 2022-2032 ($MILLION)
- TABLE 59. SMITH & NEPHEW PLC: KEY EXECUTIVES
- TABLE 60. SMITH & NEPHEW PLC: COMPANY SNAPSHOT
- TABLE 61. SMITH & NEPHEW PLC: PRODUCT SEGMENTS
- TABLE 62. SMITH & NEPHEW PLC: PRODUCT PORTFOLIO
- TABLE 63. SMITH & NEPHEW PLC: KEY STRATERGIES
- TABLE 64. MEDTRONIC PLC: KEY EXECUTIVES
- TABLE 65. MEDTRONIC PLC: COMPANY SNAPSHOT
- TABLE 66. MEDTRONIC PLC: PRODUCT SEGMENTS
- TABLE 67. MEDTRONIC PLC: PRODUCT PORTFOLIO
- TABLE 68. MEDTRONIC PLC: KEY STRATERGIES
- TABLE 69. STRYKER CORPORATION.: KEY EXECUTIVES
- TABLE 70. STRYKER CORPORATION.: COMPANY SNAPSHOT
- TABLE 71. STRYKER CORPORATION.: PRODUCT SEGMENTS
- TABLE 72. STRYKER CORPORATION.: PRODUCT PORTFOLIO
- TABLE 73. INTUITIVE SURGICAL, INC.: KEY EXECUTIVES
- TABLE 74. INTUITIVE SURGICAL, INC.: COMPANY SNAPSHOT
- TABLE 75. INTUITIVE SURGICAL, INC.: PRODUCT SEGMENTS
- TABLE 76. INTUITIVE SURGICAL, INC.: PRODUCT PORTFOLIO
- TABLE 77. RENISHAW PLC: KEY EXECUTIVES
- TABLE 78. RENISHAW PLC: COMPANY SNAPSHOT
- TABLE 79. RENISHAW PLC: PRODUCT SEGMENTS
- TABLE 80. RENISHAW PLC: SERVICE SEGMENTS
- TABLE 81. RENISHAW PLC: PRODUCT PORTFOLIO
- TABLE 82. RENISHAW PLC: KEY STRATERGIES
- TABLE 83. ZIMMER BIOMET HOLDING, INC.: KEY EXECUTIVES
- TABLE 84. ZIMMER BIOMET HOLDING, INC.: COMPANY SNAPSHOT
- TABLE 85. ZIMMER BIOMET HOLDING, INC.: PRODUCT SEGMENTS
- TABLE 86. ZIMMER BIOMET HOLDING, INC.: PRODUCT PORTFOLIO
- TABLE 87. ZIMMER BIOMET HOLDING, INC.: KEY STRATERGIES
- TABLE 88. MIDEA GROUP CO., LTD.: KEY EXECUTIVES
- TABLE 89. MIDEA GROUP CO., LTD.: COMPANY SNAPSHOT
- TABLE 90. MIDEA GROUP CO., LTD.: PRODUCT SEGMENTS
- TABLE 91. MIDEA GROUP CO., LTD.: PRODUCT PORTFOLIO
- TABLE 92. JOHNSON & JOHNSON: KEY EXECUTIVES
- TABLE 93. JOHNSON & JOHNSON: COMPANY SNAPSHOT
- TABLE 94. JOHNSON & JOHNSON: PRODUCT SEGMENTS
- TABLE 95. JOHNSON & JOHNSON: PRODUCT PORTFOLIO
- TABLE 96. JOHNSON & JOHNSON: KEY STRATERGIES
- TABLE 97. ACCURAY INCORPORATED: KEY EXECUTIVES
- TABLE 98. ACCURAY INCORPORATED: COMPANY SNAPSHOT
- TABLE 99. ACCURAY INCORPORATED: PRODUCT SEGMENTS
- TABLE 100. ACCURAY INCORPORATED: PRODUCT PORTFOLIO
- TABLE 101. CMR SURGICAL LTD.: KEY EXECUTIVES
- TABLE 102. CMR SURGICAL LTD.: COMPANY SNAPSHOT
- TABLE 103. CMR SURGICAL LTD.: PRODUCT SEGMENTS
- TABLE 104. CMR SURGICAL LTD.: PRODUCT PORTFOLIO
LIST OF FIGURES
- FIGURE 01. SURGICAL ROBOTICS MARKET, 2022-2032
- FIGURE 02. SEGMENTATION OF SURGICAL ROBOTICS MARKET,2022-2032
- FIGURE 03. TOP INVESTMENT POCKETS IN SURGICAL ROBOTICS MARKET (2023-2032)
- FIGURE 04. MODERATE BARGAINING POWER OF SUPPLIERS
- FIGURE 05. MODERATE THREAT OF NEW ENTRANTS
- FIGURE 06. MODERATE THREAT OF SUBSTITUTES
- FIGURE 07. MODERATE INTENSITY OF RIVALRY
- FIGURE 08. LOW BARGAINING POWER OF BUYERS
- FIGURE 09. GLOBAL SURGICAL ROBOTICS MARKET:DRIVERS, RESTRAINTS AND OPPORTUNITIES
- FIGURE 10. SURGICAL ROBOTICS MARKET, BY COMPONENT, 2022 AND 2032(%)
- FIGURE 11. COMPARATIVE SHARE ANALYSIS OF SURGICAL ROBOTICS MARKET FOR SYSTEMS, BY COUNTRY 2022 AND 2032(%)
- FIGURE 12. COMPARATIVE SHARE ANALYSIS OF SURGICAL ROBOTICS MARKET FOR ACCESSORIES, BY COUNTRY 2022 AND 2032(%)
- FIGURE 13. COMPARATIVE SHARE ANALYSIS OF SURGICAL ROBOTICS MARKET FOR SERVICES, BY COUNTRY 2022 AND 2032(%)
- FIGURE 14. SURGICAL ROBOTICS MARKET, BY SURGERY TYPE, 2022 AND 2032(%)
- FIGURE 15. COMPARATIVE SHARE ANALYSIS OF SURGICAL ROBOTICS MARKET FOR GYNECOLOGY SURGERY, BY COUNTRY 2022 AND 2032(%)
- FIGURE 16. COMPARATIVE SHARE ANALYSIS OF SURGICAL ROBOTICS MARKET FOR UROLOGY SURGERY, BY COUNTRY 2022 AND 2032(%)
- FIGURE 17. COMPARATIVE SHARE ANALYSIS OF SURGICAL ROBOTICS MARKET FOR NEUROSURGERY, BY COUNTRY 2022 AND 2032(%)
- FIGURE 18. COMPARATIVE SHARE ANALYSIS OF SURGICAL ROBOTICS MARKET FOR ORTHOPEDIC SURGERY, BY COUNTRY 2022 AND 2032(%)
- FIGURE 19. COMPARATIVE SHARE ANALYSIS OF SURGICAL ROBOTICS MARKET FOR GENERAL SURGERY, BY COUNTRY 2022 AND 2032(%)
- FIGURE 20. COMPARATIVE SHARE ANALYSIS OF SURGICAL ROBOTICS MARKET FOR OTHER SURGERIES, BY COUNTRY 2022 AND 2032(%)
- FIGURE 21. SURGICAL ROBOTICS MARKET BY REGION, 2022 AND 2032(%)
- FIGURE 22. U.S. SURGICAL ROBOTICS MARKET, 2022-2032 ($MILLION)
- FIGURE 23. CANADA SURGICAL ROBOTICS MARKET, 2022-2032 ($MILLION)
- FIGURE 24. MEXICO SURGICAL ROBOTICS MARKET, 2022-2032 ($MILLION)
- FIGURE 25. GERMANY SURGICAL ROBOTICS MARKET, 2022-2032 ($MILLION)
- FIGURE 26. FRANCE SURGICAL ROBOTICS MARKET, 2022-2032 ($MILLION)
- FIGURE 27. UK SURGICAL ROBOTICS MARKET, 2022-2032 ($MILLION)
- FIGURE 28. ITALY SURGICAL ROBOTICS MARKET, 2022-2032 ($MILLION)
- FIGURE 29. SPAIN SURGICAL ROBOTICS MARKET, 2022-2032 ($MILLION)
- FIGURE 30. REST OF EUROPE SURGICAL ROBOTICS MARKET, 2022-2032 ($MILLION)
- FIGURE 31. JAPAN SURGICAL ROBOTICS MARKET, 2022-2032 ($MILLION)
- FIGURE 32. CHINA SURGICAL ROBOTICS MARKET, 2022-2032 ($MILLION)
- FIGURE 33. INDIA SURGICAL ROBOTICS MARKET, 2022-2032 ($MILLION)
- FIGURE 34. AUSTRALIA SURGICAL ROBOTICS MARKET, 2022-2032 ($MILLION)
- FIGURE 35. SOUTH KOREA SURGICAL ROBOTICS MARKET, 2022-2032 ($MILLION)
- FIGURE 36. REST OF ASIA-PACIFIC SURGICAL ROBOTICS MARKET, 2022-2032 ($MILLION)
- FIGURE 37. LATIN AMERICA SURGICAL ROBOTICS MARKET, 2022-2032 ($MILLION)
- FIGURE 38. MIDDLE EAST AND AFRICA SURGICAL ROBOTICS MARKET, 2022-2032 ($MILLION)
- FIGURE 39. TOP WINNING STRATEGIES, BY YEAR (2020-2022)
- FIGURE 40. TOP WINNING STRATEGIES, BY DEVELOPMENT (2020-2022)
- FIGURE 41. TOP WINNING STRATEGIES, BY COMPANY (2020-2022)
- FIGURE 42. PRODUCT MAPPING OF TOP 10 PLAYERS
- FIGURE 43. COMPETITIVE DASHBOARD
- FIGURE 44. COMPETITIVE HEATMAP: SURGICAL ROBOTICS MARKET
- FIGURE 45. TOP PLAYER POSITIONING, 2022
- FIGURE 46. SMITH & NEPHEW PLC: NET REVENUE, 2020-2022 ($MILLION)
- FIGURE 47. SMITH & NEPHEW PLC: REVENUE SHARE BY SEGMENT, 2022 (%)
- FIGURE 48. SMITH & NEPHEW PLC: REVENUE SHARE BY REGION, 2022 (%)
- FIGURE 49. MEDTRONIC PLC: NET SALES, 2020-2022 ($MILLION)
- FIGURE 50. MEDTRONIC PLC: REVENUE SHARE BY SEGMENT, 2022 (%)
- FIGURE 51. MEDTRONIC PLC: REVENUE SHARE BY REGION, 2022 (%)
- FIGURE 52. STRYKER CORPORATION.: NET REVENUE, 2020-2022 ($MILLION)
- FIGURE 53. STRYKER CORPORATION.: REVENUE SHARE BY SEGMENT, 2022 (%)
- FIGURE 54. STRYKER CORPORATION.: REVENUE SHARE BY REGION, 2022 (%)
- FIGURE 55. INTUITIVE SURGICAL, INC.: NET REVENUE, 2020-2022 ($MILLION)
- FIGURE 56. INTUITIVE SURGICAL, INC.: REVENUE SHARE BY SEGMENT, 2022 (%)
- FIGURE 57. INTUITIVE SURGICAL, INC.: REVENUE SHARE BY REGION, 2022 (%)
- FIGURE 58. RENISHAW PLC: NET REVENUE, 2020-2022 ($MILLION)
- FIGURE 59. RENISHAW PLC: REVENUE SHARE BY SEGMENT, 2022 (%)
- FIGURE 60. RENISHAW PLC: REVENUE SHARE BY REGION, 2022 (%)
- FIGURE 61. ZIMMER BIOMET HOLDING, INC.: NET SALES, 2020-2022 ($MILLION)
- FIGURE 62. ZIMMER BIOMET HOLDING, INC.: REVENUE SHARE BY SEGMENT, 2022 (%)
- FIGURE 63. ZIMMER BIOMET HOLDING, INC.: REVENUE SHARE BY REGION, 2022 (%)
- FIGURE 64. MIDEA GROUP CO., LTD.: NET REVENUE, 2020-2022 ($MILLION)
- FIGURE 65. MIDEA GROUP CO., LTD.: REVENUE SHARE BY SEGMENT, 2022 (%)
- FIGURE 66. MIDEA GROUP CO., LTD.: REVENUE SHARE BY REGION, 2022 (%)
- FIGURE 67. JOHNSON & JOHNSON: NET SALES, 2020-2022 ($MILLION)
- FIGURE 68. JOHNSON & JOHNSON: REVENUE SHARE BY SEGMENT, 2022 (%)
- FIGURE 69. JOHNSON & JOHNSON: REVENUE SHARE BY REGION, 2022 (%)
- FIGURE 70. ACCURAY INCORPORATED: NET REVENUE, 2020-2022 ($MILLION)
- FIGURE 71. ACCURAY INCORPORATED: REVENUE SHARE BY REGION, 2022 (%)
 2025年机器人测绘与导航全球市场报告手术机器人市场-全球产业规模、份额、趋势、机会及预测,按类型、应用、最终用户、地区及竞争情况细分,2020-2030 年2025年全球手术机器人市场报告2025年手术元宇宙宇宙全球市场报告
 手术机器人市场 - 全球和区域分析:按类型、应用、最终用户和国家 - 分析和预测(2025 至 2035 年)2025年全球手术机器人配件市场报告
 全球復健机器人外骨骼市场 - 2025 至 2033 年日本手术机器人系统市场 - 2025 至 2033 年达文西系统2025年全球市场报告
 达文西系统市场报告:趋势、预测、竞争分析(至 2031 年)