


 |
市场调查报告书
商品编码
1365806
无麸质糖果零食市场:按产品类型、价格分布、配销通路:全球机会分析和产业预测,2023-2032 年Gluten Free Confectionary Market By Product Type, By Price Point, By Distribution Channel : Global Opportunity Analysis and Industry Forecast, 2023-2032 |
||||||
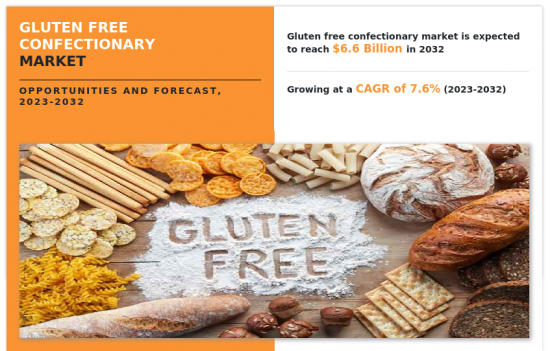
2022年无麸质糖果零食市场规模预计为32亿美元,预计2032年将达66亿美元,2023年至2032年年复合成长率为7.6%。
无麸质糖果零食市场的产品种类不断扩大,包括各种巧克力、糖果、饼干、蛋糕和其他糖果零食。可用性和品种的增加吸引了更多消费者进入市场。无麸质糖果零食市场有充足的创新和产品开拓机会。製造商可以探索新的成分、口味和质地,以满足不断变化的消费者偏好,并提高无麸质产品的口味和品质。
此外,无麸质糖果零食在超市、专卖店和线上平台等各种零售通路的供应量不断增加,带来了巨大的成长机会。製造商可以利用这些管道来接触更广泛的消费者群体并提高其市场占有率。此外,无麸质糖果零食市场也存在全球扩张的机会。各个地区对无麸质产品的需求正在成长。随着世界各地对麸质相关疾病的认识不断增强,製造商可能会扩展到新市场并使其基本客群多样化。
近年来,无麸质产品的供应量显着增加,大型製造商和小众品牌提供的无麸质糖果零食的选择范围也在扩大。线下和线上零售商都将货架空间专门专用无麸质产品,以满足日益增长的消费者需求。电子商务平台在让世界各地的消费者更容易获得无麸质糖果零食方面发挥着重要作用。
然而,无麸质产品,包括糖果零食,通常比含麸质产品更昂贵。无麸质替代成分的成本、专业的製造流程和认证要求导致了高价格。由于这种成本障碍,对于一些消费者来说,无麸质糖果零食可能难以购买或获得。由于它不含麸质,因此可能对实现无麸质糖果零食所需的质地和品质构成挑战。製造商必须投资于研究和开发,以克服这些挑战,并提供在口味和质地上与含麸质产品相当的无麸质产品。
目录
第1章简介
第2章执行摘要
第3章市场概况
- 市场定义和范围
- 主要发现
- 影响要素
- 主要投资机会
- 波特五力分析
- 市场动态
- 促进因素
- 对麸质相关疾病的认识和诊断不断提高
- 扩大产品范围和创新
- 健康和保健趋势的影响
- 抑制因素
- 成本高
- 机会
- 协作与伙伴关係,产品多元化
- 教育和消费者参与
- 促进因素
第4章无糖果零食质糖果市场:依产品类型
- 概述
- 无麸质饼干
- 无麸质蛋糕
- 无麸质巧克力
- 烘焙混合料
- 其他的
第5章无麸质糖果零食市场:按价格分布
- 概述
- 经济
- 中频
- 奢侈品
第6章无麸质糖果零食市场:依配销通路
- 概述
- 超市/大卖场
- 便利商店
- 药品/药局
- 网路销售管道
- 其他的
第7章无糖果零食质糖果市场:按地区
- 概述
- 北美洲
- 美国
- 加拿大
- 墨西哥
- 欧洲
- 英国
- 德国
- 法国
- 义大利
- 西班牙
- 其他的
- 亚太地区
- 中国
- 日本
- 印度
- 澳洲
- 其他的
- 拉丁美洲/中东/非洲
- 巴西
- 沙乌地阿拉伯
- 南非
- 土耳其
- 其他的
第8章竞争形势
- 介绍
- 关键成功策略
- 10家主要企业产品图谱
- 竞争仪表板
- 竞争热图
- 2022年主要企业定位
第9章公司简介
- Pamelas Products
- Bob's Red Mill Natural Foods, Inc.
- Simple Mills, Inc.
- Unreal Brands Inc.
- Hail Merry LLC
- SmartSweets Inc.
- King Arthur Baking Company, Inc.
- MONDELEZ INTERNATIONAL, INC.
- Conagra Brands, Inc.
- The GFB
According to a new report published by Allied Market Research, titled, "Gluten Free Confectionary Market," The gluten free confectionary market was valued at $3.2 billion in 2022, and is estimated to reach $6.6 billion by 2032, growing at a CAGR of 7.6% from 2023 to 2032.
The gluten-free confectionery market has witnessed an expansion of product offerings, including a variety of chocolates, candies, cookies, cakes, and other sweet treats. This increased availability and variety have attracted more consumers to the market. There are ample opportunities for innovation and product development in the gluten-free confectionery market. Manufacturers may explore new ingredients, flavors, and textures to enhance the taste and quality of gluten-free products, catering to the evolving consumer preferences.
Moreover, the increase in availability of gluten-free confectionery products in various retail channels, including supermarkets, specialty stores, and online platforms, presents significant growth opportunities. Manufacturers may leverage these channels to reach a wider consumer base and expand their market presence. In addition, the gluten-free confectionery market offers opportunities for global expansion. There is a growth in demand for gluten-free products in various regions. Manufacturers may go to new markets and diversify their customer base as awareness of gluten-related disorders spreads across the globe.
The availability of gluten-free products has significantly increased in recent years, with an expanding range of gluten-free confectionery options offered by both large-scale manufacturers and niche brands. Retailers, both offline and online, have dedicated shelf space to gluten-free products to meet the growth in consumer demand. E-commerce platforms have played a significant role in facilitating the accessibility of gluten-free confectionery products to consumers worldwide.
However, Gluten-free products, including confectionery items, often come at a higher price point compared to their gluten-containing counterparts. The cost of alternative gluten-free ingredients, specialized production processes, and certification requirements contribute to the higher pricing. This cost barrier may limit the affordability and accessibility of gluten-free confectionery for some consumers. The absence of gluten may pose challenges in achieving the desired texture and quality in gluten-free confectionery products. Manufacturers need to invest in research and development to overcome these challenges and offer gluten-free products that are on par with their gluten-containing counterparts in terms of taste and texture.
The gluten-free confectionery market is segmented on the basis of product type, price point, distribution channel, and region. On the basis of product type, the market is classified into gluten-free cookies, gluten-free cakes, gluten-free chocolates, baking mixes, and others. On the basis of price point, the market is classified into economy, mid-range, and luxury. On the basis of distribution channel, the market is classified into supermarkets/hypermarkets, convenience stores, pharmaceutical and drug stores, online sales channels, and others. On the basis of region, it is analyzed across North America (U.S., Canada, Mexico), Europe (France, Germany, Italy, Spain, UK, Rest of Europe), Asia-Pacific (China, India, Japan, South Korea, Australia, and the Rest of Asia-Pacific), and LAMEA (Brazil, Saudi Arabia, South Africa, Turkey, and Rest of LAMEA).
The major players operating in the market focus on key market strategies, such as mergers, product launches, acquisitions, collaborations, and partnerships. They have been also focusing on strengthening their market reach to maintain their goodwill in the ever-competitive market. Some of the key players in the gluten-free confectionery market include Bob's Red Mill Natural Foods, Inc., Pamelas Products, Simple Mills, Inc., Unreal Brands Inc., Hail Merry LLC, SmartSweets Inc., King Arthur Baking Company, Inc., MONDELEZ INTERNATIONAL, INC., The GFB: Gluten Free Bar, and Conagra Brands, Inc.
Key Benefits For Stakeholders
- This report provides a quantitative analysis of the market segments, current trends, estimations, and dynamics of the gluten free confectionary market analysis from 2022 to 2032 to identify the prevailing gluten free confectionary market opportunities.
- The market research is offered along with information related to key drivers, restraints, and opportunities.
- Porter's five forces analysis highlights the potency of buyers and suppliers to enable stakeholders make profit-oriented business decisions and strengthen their supplier-buyer network.
- In-depth analysis of the gluten free confectionary market segmentation assists to determine the prevailing market opportunities.
- Major countries in each region are mapped according to their revenue contribution to the global market.
- Market player positioning facilitates benchmarking and provides a clear understanding of the present position of the market players.
- The report includes the analysis of the regional as well as global gluten free confectionary market trends, key players, market segments, application areas, and market growth strategies.
Additional benefits you will get with this purchase are:
- Quarterly Update and* (only available with a corporate license, on listed price)
- 5 additional Company Profile of client Choice pre- or Post-purchase, as a free update.
- Free Upcoming Version on the Purchase of Five and Enterprise User License.
- 16 analyst hours of support* (post-purchase, if you find additional data requirements upon review of the report, you may receive support amounting to 16 analyst hours to solve questions, and post-sale queries)
- 15% Free Customization* (in case the scope or segment of the report does not match your requirements, 20% is equivalent to 3 working days of free work, applicable once)
- Free data Pack on the Five and Enterprise User License. (Excel version of the report)
- Free Updated report if the report is 6-12 months old or older.
- 24-hour priority response*
- Free Industry updates and white papers.
Possible Customization with this report (with additional cost and timeline talk to the sales executive to know more)
- Brands Share Analysis
- Key player details (including location, contact details, supplier/vendor network etc. in excel format)
Key Market Segments
By Product Type
- Gluten-free cookies
- Gluten-free cakes
- Gluten-free chocolates
- Baking mixes
- Others
By Price Point
- Economy
- Mid-Range
- Luxury
By Distribution Channel
- Supermarket/Hypermarket
- Convenience Stores
- Pharmaceutical and Drug Stores
- Online Sales Channel
- Others
By Region
- North America
- U.S.
- Canada
- Mexico
- Europe
- UK
- Germany
- France
- Italy
- Spain
- Rest of Europe
- Asia-Pacific
- China
- Japan
- India
- Australia
- Rest of Asia-Pacific
- LAMEA
- Brazil
- Saudi Arabia
- South Africa
- Turkey
- Rest of LAMEA
Key Market Players:
- King Arthur Baking Company, Inc.
- Unreal Brands Inc.
- Hail Merry LLC
- The GFB
- Bob's Red Mill Natural Foods, Inc.
- MONDELEZ INTERNATIONAL, INC.
- Pamelas Products
- Conagra Brands, Inc.
- SmartSweets Inc.
- Simple Mills, Inc.
TABLE OF CONTENTS
CHAPTER 1: INTRODUCTION
- 1.1. Report description
- 1.2. Key market segments
- 1.3. Key benefits to the stakeholders
- 1.4. Research Methodology
- 1.4.1. Primary research
- 1.4.2. Secondary research
- 1.4.3. Analyst tools and models
CHAPTER 2: EXECUTIVE SUMMARY
- 2.1. CXO Perspective
CHAPTER 3: MARKET OVERVIEW
- 3.1. Market definition and scope
- 3.2. Key findings
- 3.2.1. Top impacting factors
- 3.2.2. Top investment pockets
- 3.3. Porter's five forces analysis
- 3.3.1. Low bargaining power of suppliers
- 3.3.2. Low threat of new entrants
- 3.3.3. Low threat of substitutes
- 3.3.4. Low intensity of rivalry
- 3.3.5. Low bargaining power of buyers
- 3.4. Market dynamics
- 3.4.1. Drivers
- 3.4.1.1. Increasing Awareness and Diagnosis of Gluten-Related Disorders
- 3.4.1.2. Expansion of Product Offerings and Innovation
- 3.4.1.3. Influence of Health and Wellness Trends
- 3.4.2. Restraints
- 3.4.2.1. Higher Cost
- 3.4.3. Opportunities
- 3.4.3.1. Collaboration and Partnerships and Product Diversification
- 3.4.3.2. Education and Consumer Engagement
- 3.4.1. Drivers
CHAPTER 4: GLUTEN FREE CONFECTIONARY MARKET, BY PRODUCT TYPE
- 4.1. Overview
- 4.1.1. Market size and forecast
- 4.2. Gluten-free cookies
- 4.2.1. Key market trends, growth factors and opportunities
- 4.2.2. Market size and forecast, by region
- 4.2.3. Market share analysis by country
- 4.3. Gluten-free cakes
- 4.3.1. Key market trends, growth factors and opportunities
- 4.3.2. Market size and forecast, by region
- 4.3.3. Market share analysis by country
- 4.4. Gluten-free chocolates
- 4.4.1. Key market trends, growth factors and opportunities
- 4.4.2. Market size and forecast, by region
- 4.4.3. Market share analysis by country
- 4.5. Baking mixes
- 4.5.1. Key market trends, growth factors and opportunities
- 4.5.2. Market size and forecast, by region
- 4.5.3. Market share analysis by country
- 4.6. Others
- 4.6.1. Key market trends, growth factors and opportunities
- 4.6.2. Market size and forecast, by region
- 4.6.3. Market share analysis by country
CHAPTER 5: GLUTEN FREE CONFECTIONARY MARKET, BY PRICE POINT
- 5.1. Overview
- 5.1.1. Market size and forecast
- 5.2. Economy
- 5.2.1. Key market trends, growth factors and opportunities
- 5.2.2. Market size and forecast, by region
- 5.2.3. Market share analysis by country
- 5.3. Mid-Range
- 5.3.1. Key market trends, growth factors and opportunities
- 5.3.2. Market size and forecast, by region
- 5.3.3. Market share analysis by country
- 5.4. Luxury
- 5.4.1. Key market trends, growth factors and opportunities
- 5.4.2. Market size and forecast, by region
- 5.4.3. Market share analysis by country
CHAPTER 6: GLUTEN FREE CONFECTIONARY MARKET, BY DISTRIBUTION CHANNEL
- 6.1. Overview
- 6.1.1. Market size and forecast
- 6.2. Supermarket/Hypermarket
- 6.2.1. Key market trends, growth factors and opportunities
- 6.2.2. Market size and forecast, by region
- 6.2.3. Market share analysis by country
- 6.3. Convenience Stores
- 6.3.1. Key market trends, growth factors and opportunities
- 6.3.2. Market size and forecast, by region
- 6.3.3. Market share analysis by country
- 6.4. Pharmaceutical and Drug Stores
- 6.4.1. Key market trends, growth factors and opportunities
- 6.4.2. Market size and forecast, by region
- 6.4.3. Market share analysis by country
- 6.5. Online Sales Channel
- 6.5.1. Key market trends, growth factors and opportunities
- 6.5.2. Market size and forecast, by region
- 6.5.3. Market share analysis by country
- 6.6. Others
- 6.6.1. Key market trends, growth factors and opportunities
- 6.6.2. Market size and forecast, by region
- 6.6.3. Market share analysis by country
CHAPTER 7: GLUTEN FREE CONFECTIONARY MARKET, BY REGION
- 7.1. Overview
- 7.1.1. Market size and forecast By Region
- 7.2. North America
- 7.2.1. Key market trends, growth factors and opportunities
- 7.2.2. Market size and forecast, by Product Type
- 7.2.3. Market size and forecast, by Price Point
- 7.2.4. Market size and forecast, by Distribution Channel
- 7.2.5. Market size and forecast, by country
- 7.2.5.1. U.S.
- 7.2.5.1.1. Market size and forecast, by Product Type
- 7.2.5.1.2. Market size and forecast, by Price Point
- 7.2.5.1.3. Market size and forecast, by Distribution Channel
- 7.2.5.2. Canada
- 7.2.5.2.1. Market size and forecast, by Product Type
- 7.2.5.2.2. Market size and forecast, by Price Point
- 7.2.5.2.3. Market size and forecast, by Distribution Channel
- 7.2.5.3. Mexico
- 7.2.5.3.1. Market size and forecast, by Product Type
- 7.2.5.3.2. Market size and forecast, by Price Point
- 7.2.5.3.3. Market size and forecast, by Distribution Channel
- 7.3. Europe
- 7.3.1. Key market trends, growth factors and opportunities
- 7.3.2. Market size and forecast, by Product Type
- 7.3.3. Market size and forecast, by Price Point
- 7.3.4. Market size and forecast, by Distribution Channel
- 7.3.5. Market size and forecast, by country
- 7.3.5.1. UK
- 7.3.5.1.1. Market size and forecast, by Product Type
- 7.3.5.1.2. Market size and forecast, by Price Point
- 7.3.5.1.3. Market size and forecast, by Distribution Channel
- 7.3.5.2. Germany
- 7.3.5.2.1. Market size and forecast, by Product Type
- 7.3.5.2.2. Market size and forecast, by Price Point
- 7.3.5.2.3. Market size and forecast, by Distribution Channel
- 7.3.5.3. France
- 7.3.5.3.1. Market size and forecast, by Product Type
- 7.3.5.3.2. Market size and forecast, by Price Point
- 7.3.5.3.3. Market size and forecast, by Distribution Channel
- 7.3.5.4. Italy
- 7.3.5.4.1. Market size and forecast, by Product Type
- 7.3.5.4.2. Market size and forecast, by Price Point
- 7.3.5.4.3. Market size and forecast, by Distribution Channel
- 7.3.5.5. Spain
- 7.3.5.5.1. Market size and forecast, by Product Type
- 7.3.5.5.2. Market size and forecast, by Price Point
- 7.3.5.5.3. Market size and forecast, by Distribution Channel
- 7.3.5.6. Rest of Europe
- 7.3.5.6.1. Market size and forecast, by Product Type
- 7.3.5.6.2. Market size and forecast, by Price Point
- 7.3.5.6.3. Market size and forecast, by Distribution Channel
- 7.4. Asia-Pacific
- 7.4.1. Key market trends, growth factors and opportunities
- 7.4.2. Market size and forecast, by Product Type
- 7.4.3. Market size and forecast, by Price Point
- 7.4.4. Market size and forecast, by Distribution Channel
- 7.4.5. Market size and forecast, by country
- 7.4.5.1. China
- 7.4.5.1.1. Market size and forecast, by Product Type
- 7.4.5.1.2. Market size and forecast, by Price Point
- 7.4.5.1.3. Market size and forecast, by Distribution Channel
- 7.4.5.2. Japan
- 7.4.5.2.1. Market size and forecast, by Product Type
- 7.4.5.2.2. Market size and forecast, by Price Point
- 7.4.5.2.3. Market size and forecast, by Distribution Channel
- 7.4.5.3. India
- 7.4.5.3.1. Market size and forecast, by Product Type
- 7.4.5.3.2. Market size and forecast, by Price Point
- 7.4.5.3.3. Market size and forecast, by Distribution Channel
- 7.4.5.4. Australia
- 7.4.5.4.1. Market size and forecast, by Product Type
- 7.4.5.4.2. Market size and forecast, by Price Point
- 7.4.5.4.3. Market size and forecast, by Distribution Channel
- 7.4.5.5. Rest of Asia-Pacific
- 7.4.5.5.1. Market size and forecast, by Product Type
- 7.4.5.5.2. Market size and forecast, by Price Point
- 7.4.5.5.3. Market size and forecast, by Distribution Channel
- 7.5. LAMEA
- 7.5.1. Key market trends, growth factors and opportunities
- 7.5.2. Market size and forecast, by Product Type
- 7.5.3. Market size and forecast, by Price Point
- 7.5.4. Market size and forecast, by Distribution Channel
- 7.5.5. Market size and forecast, by country
- 7.5.5.1. Brazil
- 7.5.5.1.1. Market size and forecast, by Product Type
- 7.5.5.1.2. Market size and forecast, by Price Point
- 7.5.5.1.3. Market size and forecast, by Distribution Channel
- 7.5.5.2. Saudi Arabia
- 7.5.5.2.1. Market size and forecast, by Product Type
- 7.5.5.2.2. Market size and forecast, by Price Point
- 7.5.5.2.3. Market size and forecast, by Distribution Channel
- 7.5.5.3. South Africa
- 7.5.5.3.1. Market size and forecast, by Product Type
- 7.5.5.3.2. Market size and forecast, by Price Point
- 7.5.5.3.3. Market size and forecast, by Distribution Channel
- 7.5.5.4. Turkey
- 7.5.5.4.1. Market size and forecast, by Product Type
- 7.5.5.4.2. Market size and forecast, by Price Point
- 7.5.5.4.3. Market size and forecast, by Distribution Channel
- 7.5.5.5. Rest of LAMEA
- 7.5.5.5.1. Market size and forecast, by Product Type
- 7.5.5.5.2. Market size and forecast, by Price Point
- 7.5.5.5.3. Market size and forecast, by Distribution Channel
CHAPTER 8: COMPETITIVE LANDSCAPE
- 8.1. Introduction
- 8.2. Top winning strategies
- 8.3. Product Mapping of Top 10 Player
- 8.4. Competitive Dashboard
- 8.5. Competitive Heatmap
- 8.6. Top player positioning, 2022
CHAPTER 9: COMPANY PROFILES
- 9.1. Pamelas Products
- 9.1.1. Company overview
- 9.1.2. Key Executives
- 9.1.3. Company snapshot
- 9.1.4. Operating business segments
- 9.1.5. Product portfolio
- 9.1.6. Key strategic moves and developments
- 9.2. Bob's Red Mill Natural Foods, Inc.
- 9.2.1. Company overview
- 9.2.2. Key Executives
- 9.2.3. Company snapshot
- 9.2.4. Operating business segments
- 9.2.5. Product portfolio
- 9.2.6. Key strategic moves and developments
- 9.3. Simple Mills, Inc.
- 9.3.1. Company overview
- 9.3.2. Key Executives
- 9.3.3. Company snapshot
- 9.3.4. Operating business segments
- 9.3.5. Product portfolio
- 9.4. Unreal Brands Inc.
- 9.4.1. Company overview
- 9.4.2. Key Executives
- 9.4.3. Company snapshot
- 9.4.4. Operating business segments
- 9.4.5. Product portfolio
- 9.5. Hail Merry LLC
- 9.5.1. Company overview
- 9.5.2. Key Executives
- 9.5.3. Company snapshot
- 9.5.4. Operating business segments
- 9.5.5. Product portfolio
- 9.6. SmartSweets Inc.
- 9.6.1. Company overview
- 9.6.2. Key Executives
- 9.6.3. Company snapshot
- 9.6.4. Operating business segments
- 9.6.5. Product portfolio
- 9.6.6. Key strategic moves and developments
- 9.7. King Arthur Baking Company, Inc.
- 9.7.1. Company overview
- 9.7.2. Key Executives
- 9.7.3. Company snapshot
- 9.7.4. Operating business segments
- 9.7.5. Product portfolio
- 9.7.6. Key strategic moves and developments
- 9.8. MONDELEZ INTERNATIONAL, INC.
- 9.8.1. Company overview
- 9.8.2. Key Executives
- 9.8.3. Company snapshot
- 9.8.4. Operating business segments
- 9.8.5. Product portfolio
- 9.8.6. Business performance
- 9.8.7. Key strategic moves and developments
- 9.9. Conagra Brands, Inc.
- 9.9.1. Company overview
- 9.9.2. Key Executives
- 9.9.3. Company snapshot
- 9.9.4. Operating business segments
- 9.9.5. Product portfolio
- 9.9.6. Business performance
- 9.10. The GFB
- 9.10.1. Company overview
- 9.10.2. Key Executives
- 9.10.3. Company snapshot
- 9.10.4. Operating business segments
- 9.10.5. Product portfolio
LIST OF TABLES
- TABLE 01. GLOBAL GLUTEN FREE CONFECTIONARY MARKET, BY PRODUCT TYPE, 2022-2032 ($MILLION)
- TABLE 02. GLUTEN FREE CONFECTIONARY MARKET FOR GLUTEN-FREE COOKIES, BY REGION, 2022-2032 ($MILLION)
- TABLE 03. GLUTEN FREE CONFECTIONARY MARKET FOR GLUTEN-FREE CAKES, BY REGION, 2022-2032 ($MILLION)
- TABLE 04. GLUTEN FREE CONFECTIONARY MARKET FOR GLUTEN-FREE CHOCOLATES, BY REGION, 2022-2032 ($MILLION)
- TABLE 05. GLUTEN FREE CONFECTIONARY MARKET FOR BAKING MIXES, BY REGION, 2022-2032 ($MILLION)
- TABLE 06. GLUTEN FREE CONFECTIONARY MARKET FOR OTHERS, BY REGION, 2022-2032 ($MILLION)
- TABLE 07. GLOBAL GLUTEN FREE CONFECTIONARY MARKET, BY PRICE POINT, 2022-2032 ($MILLION)
- TABLE 08. GLUTEN FREE CONFECTIONARY MARKET FOR ECONOMY, BY REGION, 2022-2032 ($MILLION)
- TABLE 09. GLUTEN FREE CONFECTIONARY MARKET FOR MID-RANGE, BY REGION, 2022-2032 ($MILLION)
- TABLE 10. GLUTEN FREE CONFECTIONARY MARKET FOR LUXURY, BY REGION, 2022-2032 ($MILLION)
- TABLE 11. GLOBAL GLUTEN FREE CONFECTIONARY MARKET, BY DISTRIBUTION CHANNEL, 2022-2032 ($MILLION)
- TABLE 12. GLUTEN FREE CONFECTIONARY MARKET FOR SUPERMARKET/HYPERMARKET, BY REGION, 2022-2032 ($MILLION)
- TABLE 13. GLUTEN FREE CONFECTIONARY MARKET FOR CONVENIENCE STORES, BY REGION, 2022-2032 ($MILLION)
- TABLE 14. GLUTEN FREE CONFECTIONARY MARKET FOR PHARMACEUTICAL AND DRUG STORES, BY REGION, 2022-2032 ($MILLION)
- TABLE 15. GLUTEN FREE CONFECTIONARY MARKET FOR ONLINE SALES CHANNEL, BY REGION, 2022-2032 ($MILLION)
- TABLE 16. GLUTEN FREE CONFECTIONARY MARKET FOR OTHERS, BY REGION, 2022-2032 ($MILLION)
- TABLE 17. GLUTEN FREE CONFECTIONARY MARKET, BY REGION, 2022-2032 ($MILLION)
- TABLE 18. NORTH AMERICA GLUTEN FREE CONFECTIONARY MARKET, BY PRODUCT TYPE, 2022-2032 ($MILLION)
- TABLE 19. NORTH AMERICA GLUTEN FREE CONFECTIONARY MARKET, BY PRICE POINT, 2022-2032 ($MILLION)
- TABLE 20. NORTH AMERICA GLUTEN FREE CONFECTIONARY MARKET, BY DISTRIBUTION CHANNEL, 2022-2032 ($MILLION)
- TABLE 21. NORTH AMERICA GLUTEN FREE CONFECTIONARY MARKET, BY COUNTRY, 2022-2032 ($MILLION)
- TABLE 22. U.S. GLUTEN FREE CONFECTIONARY MARKET, BY PRODUCT TYPE, 2022-2032 ($MILLION)
- TABLE 23. U.S. GLUTEN FREE CONFECTIONARY MARKET, BY PRICE POINT, 2022-2032 ($MILLION)
- TABLE 24. U.S. GLUTEN FREE CONFECTIONARY MARKET, BY DISTRIBUTION CHANNEL, 2022-2032 ($MILLION)
- TABLE 25. CANADA GLUTEN FREE CONFECTIONARY MARKET, BY PRODUCT TYPE, 2022-2032 ($MILLION)
- TABLE 26. CANADA GLUTEN FREE CONFECTIONARY MARKET, BY PRICE POINT, 2022-2032 ($MILLION)
- TABLE 27. CANADA GLUTEN FREE CONFECTIONARY MARKET, BY DISTRIBUTION CHANNEL, 2022-2032 ($MILLION)
- TABLE 28. MEXICO GLUTEN FREE CONFECTIONARY MARKET, BY PRODUCT TYPE, 2022-2032 ($MILLION)
- TABLE 29. MEXICO GLUTEN FREE CONFECTIONARY MARKET, BY PRICE POINT, 2022-2032 ($MILLION)
- TABLE 30. MEXICO GLUTEN FREE CONFECTIONARY MARKET, BY DISTRIBUTION CHANNEL, 2022-2032 ($MILLION)
- TABLE 31. EUROPE GLUTEN FREE CONFECTIONARY MARKET, BY PRODUCT TYPE, 2022-2032 ($MILLION)
- TABLE 32. EUROPE GLUTEN FREE CONFECTIONARY MARKET, BY PRICE POINT, 2022-2032 ($MILLION)
- TABLE 33. EUROPE GLUTEN FREE CONFECTIONARY MARKET, BY DISTRIBUTION CHANNEL, 2022-2032 ($MILLION)
- TABLE 34. EUROPE GLUTEN FREE CONFECTIONARY MARKET, BY COUNTRY, 2022-2032 ($MILLION)
- TABLE 35. UK GLUTEN FREE CONFECTIONARY MARKET, BY PRODUCT TYPE, 2022-2032 ($MILLION)
- TABLE 36. UK GLUTEN FREE CONFECTIONARY MARKET, BY PRICE POINT, 2022-2032 ($MILLION)
- TABLE 37. UK GLUTEN FREE CONFECTIONARY MARKET, BY DISTRIBUTION CHANNEL, 2022-2032 ($MILLION)
- TABLE 38. GERMANY GLUTEN FREE CONFECTIONARY MARKET, BY PRODUCT TYPE, 2022-2032 ($MILLION)
- TABLE 39. GERMANY GLUTEN FREE CONFECTIONARY MARKET, BY PRICE POINT, 2022-2032 ($MILLION)
- TABLE 40. GERMANY GLUTEN FREE CONFECTIONARY MARKET, BY DISTRIBUTION CHANNEL, 2022-2032 ($MILLION)
- TABLE 41. FRANCE GLUTEN FREE CONFECTIONARY MARKET, BY PRODUCT TYPE, 2022-2032 ($MILLION)
- TABLE 42. FRANCE GLUTEN FREE CONFECTIONARY MARKET, BY PRICE POINT, 2022-2032 ($MILLION)
- TABLE 43. FRANCE GLUTEN FREE CONFECTIONARY MARKET, BY DISTRIBUTION CHANNEL, 2022-2032 ($MILLION)
- TABLE 44. ITALY GLUTEN FREE CONFECTIONARY MARKET, BY PRODUCT TYPE, 2022-2032 ($MILLION)
- TABLE 45. ITALY GLUTEN FREE CONFECTIONARY MARKET, BY PRICE POINT, 2022-2032 ($MILLION)
- TABLE 46. ITALY GLUTEN FREE CONFECTIONARY MARKET, BY DISTRIBUTION CHANNEL, 2022-2032 ($MILLION)
- TABLE 47. SPAIN GLUTEN FREE CONFECTIONARY MARKET, BY PRODUCT TYPE, 2022-2032 ($MILLION)
- TABLE 48. SPAIN GLUTEN FREE CONFECTIONARY MARKET, BY PRICE POINT, 2022-2032 ($MILLION)
- TABLE 49. SPAIN GLUTEN FREE CONFECTIONARY MARKET, BY DISTRIBUTION CHANNEL, 2022-2032 ($MILLION)
- TABLE 50. REST OF EUROPE GLUTEN FREE CONFECTIONARY MARKET, BY PRODUCT TYPE, 2022-2032 ($MILLION)
- TABLE 51. REST OF EUROPE GLUTEN FREE CONFECTIONARY MARKET, BY PRICE POINT, 2022-2032 ($MILLION)
- TABLE 52. REST OF EUROPE GLUTEN FREE CONFECTIONARY MARKET, BY DISTRIBUTION CHANNEL, 2022-2032 ($MILLION)
- TABLE 53. ASIA-PACIFIC GLUTEN FREE CONFECTIONARY MARKET, BY PRODUCT TYPE, 2022-2032 ($MILLION)
- TABLE 54. ASIA-PACIFIC GLUTEN FREE CONFECTIONARY MARKET, BY PRICE POINT, 2022-2032 ($MILLION)
- TABLE 55. ASIA-PACIFIC GLUTEN FREE CONFECTIONARY MARKET, BY DISTRIBUTION CHANNEL, 2022-2032 ($MILLION)
- TABLE 56. ASIA-PACIFIC GLUTEN FREE CONFECTIONARY MARKET, BY COUNTRY, 2022-2032 ($MILLION)
- TABLE 57. CHINA GLUTEN FREE CONFECTIONARY MARKET, BY PRODUCT TYPE, 2022-2032 ($MILLION)
- TABLE 58. CHINA GLUTEN FREE CONFECTIONARY MARKET, BY PRICE POINT, 2022-2032 ($MILLION)
- TABLE 59. CHINA GLUTEN FREE CONFECTIONARY MARKET, BY DISTRIBUTION CHANNEL, 2022-2032 ($MILLION)
- TABLE 60. JAPAN GLUTEN FREE CONFECTIONARY MARKET, BY PRODUCT TYPE, 2022-2032 ($MILLION)
- TABLE 61. JAPAN GLUTEN FREE CONFECTIONARY MARKET, BY PRICE POINT, 2022-2032 ($MILLION)
- TABLE 62. JAPAN GLUTEN FREE CONFECTIONARY MARKET, BY DISTRIBUTION CHANNEL, 2022-2032 ($MILLION)
- TABLE 63. INDIA GLUTEN FREE CONFECTIONARY MARKET, BY PRODUCT TYPE, 2022-2032 ($MILLION)
- TABLE 64. INDIA GLUTEN FREE CONFECTIONARY MARKET, BY PRICE POINT, 2022-2032 ($MILLION)
- TABLE 65. INDIA GLUTEN FREE CONFECTIONARY MARKET, BY DISTRIBUTION CHANNEL, 2022-2032 ($MILLION)
- TABLE 66. AUSTRALIA GLUTEN FREE CONFECTIONARY MARKET, BY PRODUCT TYPE, 2022-2032 ($MILLION)
- TABLE 67. AUSTRALIA GLUTEN FREE CONFECTIONARY MARKET, BY PRICE POINT, 2022-2032 ($MILLION)
- TABLE 68. AUSTRALIA GLUTEN FREE CONFECTIONARY MARKET, BY DISTRIBUTION CHANNEL, 2022-2032 ($MILLION)
- TABLE 69. REST OF ASIA-PACIFIC GLUTEN FREE CONFECTIONARY MARKET, BY PRODUCT TYPE, 2022-2032 ($MILLION)
- TABLE 70. REST OF ASIA-PACIFIC GLUTEN FREE CONFECTIONARY MARKET, BY PRICE POINT, 2022-2032 ($MILLION)
- TABLE 71. REST OF ASIA-PACIFIC GLUTEN FREE CONFECTIONARY MARKET, BY DISTRIBUTION CHANNEL, 2022-2032 ($MILLION)
- TABLE 72. LAMEA GLUTEN FREE CONFECTIONARY MARKET, BY PRODUCT TYPE, 2022-2032 ($MILLION)
- TABLE 73. LAMEA GLUTEN FREE CONFECTIONARY MARKET, BY PRICE POINT, 2022-2032 ($MILLION)
- TABLE 74. LAMEA GLUTEN FREE CONFECTIONARY MARKET, BY DISTRIBUTION CHANNEL, 2022-2032 ($MILLION)
- TABLE 75. LAMEA GLUTEN FREE CONFECTIONARY MARKET, BY COUNTRY, 2022-2032 ($MILLION)
- TABLE 76. BRAZIL GLUTEN FREE CONFECTIONARY MARKET, BY PRODUCT TYPE, 2022-2032 ($MILLION)
- TABLE 77. BRAZIL GLUTEN FREE CONFECTIONARY MARKET, BY PRICE POINT, 2022-2032 ($MILLION)
- TABLE 78. BRAZIL GLUTEN FREE CONFECTIONARY MARKET, BY DISTRIBUTION CHANNEL, 2022-2032 ($MILLION)
- TABLE 79. SAUDI ARABIA GLUTEN FREE CONFECTIONARY MARKET, BY PRODUCT TYPE, 2022-2032 ($MILLION)
- TABLE 80. SAUDI ARABIA GLUTEN FREE CONFECTIONARY MARKET, BY PRICE POINT, 2022-2032 ($MILLION)
- TABLE 81. SAUDI ARABIA GLUTEN FREE CONFECTIONARY MARKET, BY DISTRIBUTION CHANNEL, 2022-2032 ($MILLION)
- TABLE 82. SOUTH AFRICA GLUTEN FREE CONFECTIONARY MARKET, BY PRODUCT TYPE, 2022-2032 ($MILLION)
- TABLE 83. SOUTH AFRICA GLUTEN FREE CONFECTIONARY MARKET, BY PRICE POINT, 2022-2032 ($MILLION)
- TABLE 84. SOUTH AFRICA GLUTEN FREE CONFECTIONARY MARKET, BY DISTRIBUTION CHANNEL, 2022-2032 ($MILLION)
- TABLE 85. TURKEY GLUTEN FREE CONFECTIONARY MARKET, BY PRODUCT TYPE, 2022-2032 ($MILLION)
- TABLE 86. TURKEY GLUTEN FREE CONFECTIONARY MARKET, BY PRICE POINT, 2022-2032 ($MILLION)
- TABLE 87. TURKEY GLUTEN FREE CONFECTIONARY MARKET, BY DISTRIBUTION CHANNEL, 2022-2032 ($MILLION)
- TABLE 88. REST OF LAMEA GLUTEN FREE CONFECTIONARY MARKET, BY PRODUCT TYPE, 2022-2032 ($MILLION)
- TABLE 89. REST OF LAMEA GLUTEN FREE CONFECTIONARY MARKET, BY PRICE POINT, 2022-2032 ($MILLION)
- TABLE 90. REST OF LAMEA GLUTEN FREE CONFECTIONARY MARKET, BY DISTRIBUTION CHANNEL, 2022-2032 ($MILLION)
- TABLE 91. PAMELAS PRODUCTS: KEY EXECUTIVES
- TABLE 92. PAMELAS PRODUCTS: COMPANY SNAPSHOT
- TABLE 93. PAMELAS PRODUCTS: PRODUCT SEGMENTS
- TABLE 94. PAMELAS PRODUCTS: PRODUCT PORTFOLIO
- TABLE 95. PAMELAS PRODUCTS: KEY STRATERGIES
- TABLE 96. BOB'S RED MILL NATURAL FOODS, INC.: KEY EXECUTIVES
- TABLE 97. BOB'S RED MILL NATURAL FOODS, INC.: COMPANY SNAPSHOT
- TABLE 98. BOB'S RED MILL NATURAL FOODS, INC.: PRODUCT SEGMENTS
- TABLE 99. BOB'S RED MILL NATURAL FOODS, INC.: PRODUCT PORTFOLIO
- TABLE 100. BOB'S RED MILL NATURAL FOODS, INC.: KEY STRATERGIES
- TABLE 101. SIMPLE MILLS, INC.: KEY EXECUTIVES
- TABLE 102. SIMPLE MILLS, INC.: COMPANY SNAPSHOT
- TABLE 103. SIMPLE MILLS, INC.: PRODUCT SEGMENTS
- TABLE 104. SIMPLE MILLS, INC.: PRODUCT PORTFOLIO
- TABLE 105. UNREAL BRANDS INC.: KEY EXECUTIVES
- TABLE 106. UNREAL BRANDS INC.: COMPANY SNAPSHOT
- TABLE 107. UNREAL BRANDS INC.: PRODUCT SEGMENTS
- TABLE 108. UNREAL BRANDS INC.: PRODUCT PORTFOLIO
- TABLE 109. HAIL MERRY LLC: KEY EXECUTIVES
- TABLE 110. HAIL MERRY LLC: COMPANY SNAPSHOT
- TABLE 111. HAIL MERRY LLC: PRODUCT SEGMENTS
- TABLE 112. HAIL MERRY LLC: PRODUCT PORTFOLIO
- TABLE 113. SMARTSWEETS INC.: KEY EXECUTIVES
- TABLE 114. SMARTSWEETS INC.: COMPANY SNAPSHOT
- TABLE 115. SMARTSWEETS INC.: PRODUCT SEGMENTS
- TABLE 116. SMARTSWEETS INC.: PRODUCT PORTFOLIO
- TABLE 117. SMARTSWEETS INC.: KEY STRATERGIES
- TABLE 118. KING ARTHUR BAKING COMPANY, INC.: KEY EXECUTIVES
- TABLE 119. KING ARTHUR BAKING COMPANY, INC.: COMPANY SNAPSHOT
- TABLE 120. KING ARTHUR BAKING COMPANY, INC.: PRODUCT SEGMENTS
- TABLE 121. KING ARTHUR BAKING COMPANY, INC.: PRODUCT PORTFOLIO
- TABLE 122. KING ARTHUR BAKING COMPANY, INC.: KEY STRATERGIES
- TABLE 123. MONDELEZ INTERNATIONAL, INC.: KEY EXECUTIVES
- TABLE 124. MONDELEZ INTERNATIONAL, INC.: COMPANY SNAPSHOT
- TABLE 125. MONDELEZ INTERNATIONAL, INC.: PRODUCT SEGMENTS
- TABLE 126. MONDELEZ INTERNATIONAL, INC.: PRODUCT PORTFOLIO
- TABLE 127. MONDELEZ INTERNATIONAL, INC.: KEY STRATERGIES
- TABLE 128. CONAGRA BRANDS, INC.: KEY EXECUTIVES
- TABLE 129. CONAGRA BRANDS, INC.: COMPANY SNAPSHOT
- TABLE 130. CONAGRA BRANDS, INC.: PRODUCT SEGMENTS
- TABLE 131. CONAGRA BRANDS, INC.: SERVICE SEGMENTS
- TABLE 132. CONAGRA BRANDS, INC.: PRODUCT PORTFOLIO
- TABLE 133. THE GFB: KEY EXECUTIVES
- TABLE 134. THE GFB: COMPANY SNAPSHOT
- TABLE 135. THE GFB: PRODUCT SEGMENTS
- TABLE 136. THE GFB: PRODUCT PORTFOLIO
LIST OF FIGURES
- FIGURE 01. GLUTEN FREE CONFECTIONARY MARKET, 2022-2032
- FIGURE 02. SEGMENTATION OF GLUTEN FREE CONFECTIONARY MARKET,2022-2032
- FIGURE 03. TOP INVESTMENT POCKETS IN GLUTEN FREE CONFECTIONARY MARKET (2023-2032)
- FIGURE 04. LOW BARGAINING POWER OF SUPPLIERS
- FIGURE 05. LOW THREAT OF NEW ENTRANTS
- FIGURE 06. LOW THREAT OF SUBSTITUTES
- FIGURE 07. LOW INTENSITY OF RIVALRY
- FIGURE 08. LOW BARGAINING POWER OF BUYERS
- FIGURE 09. GLOBAL GLUTEN FREE CONFECTIONARY MARKET:DRIVERS, RESTRAINTS AND OPPORTUNITIES
- FIGURE 10. GLUTEN FREE CONFECTIONARY MARKET, BY PRODUCT TYPE, 2022 AND 2032(%)
- FIGURE 11. COMPARATIVE SHARE ANALYSIS OF GLUTEN FREE CONFECTIONARY MARKET FOR GLUTEN-FREE COOKIES, BY COUNTRY 2022 AND 2032(%)
- FIGURE 12. COMPARATIVE SHARE ANALYSIS OF GLUTEN FREE CONFECTIONARY MARKET FOR GLUTEN-FREE CAKES, BY COUNTRY 2022 AND 2032(%)
- FIGURE 13. COMPARATIVE SHARE ANALYSIS OF GLUTEN FREE CONFECTIONARY MARKET FOR GLUTEN-FREE CHOCOLATES, BY COUNTRY 2022 AND 2032(%)
- FIGURE 14. COMPARATIVE SHARE ANALYSIS OF GLUTEN FREE CONFECTIONARY MARKET FOR BAKING MIXES, BY COUNTRY 2022 AND 2032(%)
- FIGURE 15. COMPARATIVE SHARE ANALYSIS OF GLUTEN FREE CONFECTIONARY MARKET FOR OTHERS, BY COUNTRY 2022 AND 2032(%)
- FIGURE 16. GLUTEN FREE CONFECTIONARY MARKET, BY PRICE POINT, 2022 AND 2032(%)
- FIGURE 17. COMPARATIVE SHARE ANALYSIS OF GLUTEN FREE CONFECTIONARY MARKET FOR ECONOMY, BY COUNTRY 2022 AND 2032(%)
- FIGURE 18. COMPARATIVE SHARE ANALYSIS OF GLUTEN FREE CONFECTIONARY MARKET FOR MID-RANGE, BY COUNTRY 2022 AND 2032(%)
- FIGURE 19. COMPARATIVE SHARE ANALYSIS OF GLUTEN FREE CONFECTIONARY MARKET FOR LUXURY, BY COUNTRY 2022 AND 2032(%)
- FIGURE 20. GLUTEN FREE CONFECTIONARY MARKET, BY DISTRIBUTION CHANNEL, 2022 AND 2032(%)
- FIGURE 21. COMPARATIVE SHARE ANALYSIS OF GLUTEN FREE CONFECTIONARY MARKET FOR SUPERMARKET/HYPERMARKET, BY COUNTRY 2022 AND 2032(%)
- FIGURE 22. COMPARATIVE SHARE ANALYSIS OF GLUTEN FREE CONFECTIONARY MARKET FOR CONVENIENCE STORES, BY COUNTRY 2022 AND 2032(%)
- FIGURE 23. COMPARATIVE SHARE ANALYSIS OF GLUTEN FREE CONFECTIONARY MARKET FOR PHARMACEUTICAL AND DRUG STORES, BY COUNTRY 2022 AND 2032(%)
- FIGURE 24. COMPARATIVE SHARE ANALYSIS OF GLUTEN FREE CONFECTIONARY MARKET FOR ONLINE SALES CHANNEL, BY COUNTRY 2022 AND 2032(%)
- FIGURE 25. COMPARATIVE SHARE ANALYSIS OF GLUTEN FREE CONFECTIONARY MARKET FOR OTHERS, BY COUNTRY 2022 AND 2032(%)
- FIGURE 26. GLUTEN FREE CONFECTIONARY MARKET BY REGION, 2022 AND 2032(%)
- FIGURE 27. U.S. GLUTEN FREE CONFECTIONARY MARKET, 2022-2032 ($MILLION)
- FIGURE 28. CANADA GLUTEN FREE CONFECTIONARY MARKET, 2022-2032 ($MILLION)
- FIGURE 29. MEXICO GLUTEN FREE CONFECTIONARY MARKET, 2022-2032 ($MILLION)
- FIGURE 30. UK GLUTEN FREE CONFECTIONARY MARKET, 2022-2032 ($MILLION)
- FIGURE 31. GERMANY GLUTEN FREE CONFECTIONARY MARKET, 2022-2032 ($MILLION)
- FIGURE 32. FRANCE GLUTEN FREE CONFECTIONARY MARKET, 2022-2032 ($MILLION)
- FIGURE 33. ITALY GLUTEN FREE CONFECTIONARY MARKET, 2022-2032 ($MILLION)
- FIGURE 34. SPAIN GLUTEN FREE CONFECTIONARY MARKET, 2022-2032 ($MILLION)
- FIGURE 35. REST OF EUROPE GLUTEN FREE CONFECTIONARY MARKET, 2022-2032 ($MILLION)
- FIGURE 36. CHINA GLUTEN FREE CONFECTIONARY MARKET, 2022-2032 ($MILLION)
- FIGURE 37. JAPAN GLUTEN FREE CONFECTIONARY MARKET, 2022-2032 ($MILLION)
- FIGURE 38. INDIA GLUTEN FREE CONFECTIONARY MARKET, 2022-2032 ($MILLION)
- FIGURE 39. AUSTRALIA GLUTEN FREE CONFECTIONARY MARKET, 2022-2032 ($MILLION)
- FIGURE 40. REST OF ASIA-PACIFIC GLUTEN FREE CONFECTIONARY MARKET, 2022-2032 ($MILLION)
- FIGURE 41. BRAZIL GLUTEN FREE CONFECTIONARY MARKET, 2022-2032 ($MILLION)
- FIGURE 42. SAUDI ARABIA GLUTEN FREE CONFECTIONARY MARKET, 2022-2032 ($MILLION)
- FIGURE 43. SOUTH AFRICA GLUTEN FREE CONFECTIONARY MARKET, 2022-2032 ($MILLION)
- FIGURE 44. TURKEY GLUTEN FREE CONFECTIONARY MARKET, 2022-2032 ($MILLION)
- FIGURE 45. REST OF LAMEA GLUTEN FREE CONFECTIONARY MARKET, 2022-2032 ($MILLION)
- FIGURE 46. TOP WINNING STRATEGIES, BY YEAR (2020-2023)
- FIGURE 47. TOP WINNING STRATEGIES, BY DEVELOPMENT (2020-2023)
- FIGURE 48. TOP WINNING STRATEGIES, BY COMPANY (2020-2023)
- FIGURE 49. PRODUCT MAPPING OF TOP 10 PLAYERS
- FIGURE 50. COMPETITIVE DASHBOARD
- FIGURE 51. COMPETITIVE HEATMAP: GLUTEN FREE CONFECTIONARY MARKET
- FIGURE 52. TOP PLAYER POSITIONING, 2022
- FIGURE 53. MONDELEZ INTERNATIONAL, INC.: NET REVENUE, 2020-2022 ($MILLION)
- FIGURE 54. MONDELEZ INTERNATIONAL, INC.: RESEARCH & DEVELOPMENT EXPENDITURE, 2020-2022 ($MILLION)
- FIGURE 55. MONDELEZ INTERNATIONAL, INC.: REVENUE SHARE BY SEGMENT, 2022 (%)
- FIGURE 56. MONDELEZ INTERNATIONAL, INC.: REVENUE SHARE BY REGION, 2022 (%)
- FIGURE 57. CONAGRA BRANDS, INC.: NET SALES, 2020-2022 ($MILLION)
- FIGURE 58. CONAGRA BRANDS, INC.: RESEARCH & DEVELOPMENT EXPENDITURE, 2020-2022
- FIGURE 59. CONAGRA BRANDS, INC.: REVENUE SHARE BY SEGMENT, 2022 (%)
 巧克力糖果零食的全球市场 - 全球产业分析,规模,占有率,成长,趋势,预测(2031年)
 全球无麸质糖果零食市场规模、份额和行业趋势分析报告:2023-2030 年按产品类型、配销通路、价格分布和地区分類的展望和预测