


 |
市场调查报告书
商品编码
1365847
绿色帷幕墙市场:按类型、植被类型、应用:2023-2032 年全球机会分析与产业预测Green Facade Market By Type (Ground Based, Wall Structure Based), By Vegetation Type (Shrubs, Flowers, Others), By Application (Residential, Commercial): Global Opportunity Analysis and Industry Forecast, 2023-2032 |
||||||
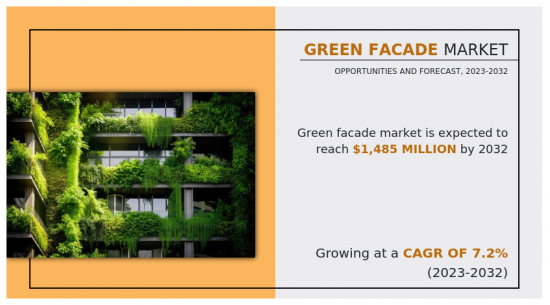
2020 年绿色外墙市场价值为 6.622 亿美元,预估 2023 年至 2032 年年复合成长率为 7.2%,至 2032 年达到 14.85 亿美元。
完全或主要被植物覆盖的结构称为绿色立面。绿色立面使用带有攀缘植物的鹰架系统来支撑扎根于地面或容器中的植物藤蔓。城市环境从经济、环境、美学和生理角度都受益于绿色立面。
人口成长和人们可支配所得的增加将推动居住向城市转移。此外,都市区也为提高一般民众的生活水准和生活品质提供了机会。服务业和製造业的成长也在快速都市化中发挥作用。在全球范围内,人口增长和政府扩大城市居住建设计划也推动了快速都市化。建设产业为住宅、商业、工业和政府部门提供服务,处于都市化发展的最前线。由于对空气污染、高温和噪音污染的日益担忧,建设产业越来越永续地为其产品采用可持续和环保的解决方案。绿色外墙因其在减少空气污染、噪音管理、隔热隔热和适应性方面的有效性而非常受欢迎。由于其卓越的永续性,绿色外墙越来越受到世界各地的青睐。因此,全球绿色外墙市场预计将受益于日益增长的都市化。
目录
第1章简介
第2章执行摘要
第3章市场概况
- 市场定义和范围
- 主要发现
- 影响因素
- 主要投资机会
- 波特五力分析
- 市场动态
- 促进因素
- 都市化和工业化进程
- 环境永续性意识不断增强
- 抑制因素
- 绿色立面安装成本高
- 机会
- 政府针对节能建筑的配合措施
- 促进因素
第4章绿色帷幕墙市场:依类型
- 概述
- 地面基地
- 墙体结构基础
第5章绿色帷幕墙市场:依植被类型分类
- 概述
- 灌木
- 花
- 其他的
第6章绿色帷幕墙市场:依应用分类
- 概述
- 住宅
- 商业的
第7章绿色帷幕墙市场:按地区
- 概述
- 北美洲
- 美国
- 加拿大
- 墨西哥
- 欧洲
- 德国
- 法国
- 英国
- 义大利
- 其他的
- 亚太地区
- 中国
- 印度
- 日本
- 韩国
- 其他的
- 拉丁美洲
- 拉丁美洲
- 中东
- 非洲
第8章竞争形势
- 介绍
- 关键成功策略
- 10家主要企业产品图谱
- 竞争仪表板
- 竞争热图
- 2020年主要企业定位
第9章公司简介
- ELT India
- Biotecture Ltd.
- Lang+Fulton
- ANS Group Global Ltd.
- Green Roof Technology
- GSky Plant System Inc.
- LiveWall, LLC
- Green over Grey
- Naava
- Green Fortune
According to a new report published by Allied Market Research, titled, "Green Facade Market," The green facade market was valued at $662.2 million in 2020, and is estimated to reach $1485 million by 2032, growing at a CAGR of 7.2% from 2023 to 2032.
A structure that is completely or mainly covered in plant material is known as a green facade. A scaffolding system is used in green facades with climbing plants to support the vines of plants that are rooted in the ground or containers. Urban environments benefit from green facades in terms of economy, environment, aesthetics, and physiology.
Growth in population and rise in disposable income of people facilitate a shift towards urban settlements. In addition, urban areas provide a chance to raise the level of living and quality of life for the general population. Growth in service and manufacturing industries is also a part of the rapid urbanization of the town. Globally, rapid urbanization is also being fueled by the growing population, and expanding government programs to construct urban settlements. The building and construction industry, which provides sectors for residential, commercial, industrial, and governmental activities, is in the lead of expanding urbanization. The building and construction sector is increasingly inclined toward using sustainable and environmentally friendly solutions in its products due to increasing concerns about air pollution, high temperatures, and noise pollution. Due to their effectiveness in lowering air pollution, managing noise, insulating against heat loss, and making adaptations, green facades are very popular. Owing to their great sustainability, green facades are becoming more and more well-liked globally. Therefore, the global market for green facades is expected to benefit from rise in urbanization.
In addition, vegetation on green facades is supplied with nutrients by the soil and water system underneath them. To keep them alive, it is necessary to ensure a steady supply of water and soil, as well as enough sunlight and nutritious food. Any spills carried on by a leak or by improper maintenance may damage the interior areas, compromise the structural integrity of the walls, and harm the plants. In addition, if the vegetation is not frequently inspected, insects may be drawn to it, which could be harmful to users. Regular conditioning, trimming, and other care are necessary to keep the vegetation under control and aesthetically acceptable to the audience. As a result, maintaining green facades needs a lot of money, time, effort, and specialized labor, all of which hinder the market expansion.
However, governments globally are being encouraged to adopt eco-friendly and sustainable policies, due to rising concerns about climate change. High temperatures brought on by climate change have already made millions of people vulnerable to heat exhaustion and severe heatstroke. The use of air conditioning to reduce temperatures is expensive and wasteful. To moderate temperatures, the government is therefore promoting facades made of greenery as a viable and efficient alternative. With their vegetation, green walls can provide cleaner air, lessen noise pollution, and provide thermal insulation. Green walls are promoted in residential, commercial, and industrial areas by advantageous rules, rewards, and moral persuasion. Therefore, advantageous government initiatives are expected to create lucrative global market prospects for green facades during the forecast period.
The green facades market is segmented into type, vegetation type, application, and region. By type, the market is categorized into ground based and wall structure based. The wall structure based segment dominated the market in 2020. By vegetation type, the market is segmented into divided into flower, shrubs, and other. The flower segment dominated the market in 2020. By application, it is classified into residential and commercial. The commercial segment dominated the market in 2020.
Region-wise, the market is analyzed across North America (the U.S., Canada, and Mexico), Europe (Germany, the UK, France, Italy, and rest of Europe), Asia-Pacific (China, India, Japan, South Korea, and rest of Asia-Pacific), and LAMEA (Latin America, Middle East, and Africa).
In 2022, LAMEA was the key shareholder, and is anticipated to secure a leading position during the forecast period.
COMPETITION ANALYSIS
Key companies profiled in the green facades market report include, ELT India, Biotecture Ltd., Lang+Fulton, ANS Group Global Ltd., Green Roof Technology, GSky Plant System Inc., Green Fortune, LiveWall, LLC, Green Over gGrey, and Naava.
Key Benefits For Stakeholders
- This report provides a quantitative analysis of the market segments, current trends, estimations, and dynamics of the green facade market analysis from 2020 to 2032 to identify the prevailing green facade market opportunities.
- The market research is offered along with information related to key drivers, restraints, and opportunities.
- Porter's five forces analysis highlights the potency of buyers and suppliers to enable stakeholders make profit-oriented business decisions and strengthen their supplier-buyer network.
- In-depth analysis of the green facade market segmentation assists to determine the prevailing market opportunities.
- Major countries in each region are mapped according to their revenue contribution to the global market.
- Market player positioning facilitates benchmarking and provides a clear understanding of the present position of the market players.
- The report includes the analysis of the regional as well as global green facade market trends, key players, market segments, application areas, and market growth strategies.
Additional benefits you will get with this purchase are:
- Quarterly Update and* (only available with a corporate license, on listed price)
- 5 additional Company Profile of client Choice pre- or Post-purchase, as a free update.
- Free Upcoming Version on the Purchase of Five and Enterprise User License.
- 16 analyst hours of support* (post-purchase, if you find additional data requirements upon review of the report, you may receive support amounting to 16 analyst hours to solve questions, and post-sale queries)
- 15% Free Customization* (in case the scope or segment of the report does not match your requirements, 20% is equivalent to 3 working days of free work, applicable once)
- Free data Pack on the Five and Enterprise User License. (Excel version of the report)
- Free Updated report if the report is 6-12 months old or older.
- 24-hour priority response*
- Free Industry updates and white papers.
Possible Customization with this report (with additional cost and timeline talk to the sales executive to know more)
- Manufacturing Capacity
- Go To Market Strategy
- Additional company profiles with specific to client's interest
- Additional country or region analysis- market size and forecast
- Average Selling Price Analysis / Price Point Analysis
- Brands Share Analysis
- Criss-cross segment analysis- market size and forecast
- Expanded list for Company Profiles
- Historic market data
- Import Export Analysis/Data
- Key player details (including location, contact details, supplier/vendor network etc. in excel format)
- List of customers/consumers/raw material suppliers- value chain analysis
- Market share analysis of players at global/region/country level
- Per Capita Consumption Trends
- Product Consumption Analysis
- Reimbursement Scenario
- SWOT Analysis
- Volume Market Size and Forecast
Key Market Segments
By Type
- Ground Based
- Wall Structure Based
By Vegetation Type
- Shrubs
- Flowers
- Others
By Application
- Residential
- Commercial
By Region
- North America
- U.S.
- Canada
- Mexico
- Europe
- Germany
- France
- UK
- Italy
- Rest of Europe
- Asia-Pacific
- China
- India
- Japan
- South Korea
- Rest of Asia-Pacific
- LAMEA
- Latin America
- Middle East
- Africa
Key Market Players:
- ELT India
- LiveWall, LLC
- Green over Grey
- ANS Group Global Ltd.
- Biotecture Ltd.
- Lang+Fulton
- Green Fortune
- GSky Plant System Inc.
- Naava
- Green Roof Technology
TABLE OF CONTENTS
CHAPTER 1: INTRODUCTION
- 1.1. Report description
- 1.2. Key market segments
- 1.3. Key benefits to the stakeholders
- 1.4. Research Methodology
- 1.4.1. Primary research
- 1.4.2. Secondary research
- 1.4.3. Analyst tools and models
CHAPTER 2: EXECUTIVE SUMMARY
- 2.1. CXO Perspective
CHAPTER 3: MARKET OVERVIEW
- 3.1. Market definition and scope
- 3.2. Key findings
- 3.2.1. Top impacting factors
- 3.2.2. Top investment pockets
- 3.3. Porter's five forces analysis
- 3.3.1. Low bargaining power of suppliers
- 3.3.2. Low threat of new entrants
- 3.3.3. Low threat of substitutes
- 3.3.4. Low intensity of rivalry
- 3.3.5. Low bargaining power of buyers
- 3.4. Market dynamics
- 3.4.1. Drivers
- 3.4.1.1. Rise in urbanization and industrialization
- 3.4.1.2. Growth in awareness regarding environmental sustainability
- 3.4.2. Restraints
- 3.4.2.1. High installation cost of green facades
- 3.4.3. Opportunities
- 3.4.3.1. Government initiatives for energy efficient buildings
- 3.4.1. Drivers
CHAPTER 4: GREEN FACADE MARKET, BY TYPE
- 4.1. Overview
- 4.1.1. Market size and forecast
- 4.2. Ground Based
- 4.2.1. Key market trends, growth factors and opportunities
- 4.2.2. Market size and forecast, by region
- 4.2.3. Market share analysis by country
- 4.3. Wall Structure Based
- 4.3.1. Key market trends, growth factors and opportunities
- 4.3.2. Market size and forecast, by region
- 4.3.3. Market share analysis by country
CHAPTER 5: GREEN FACADE MARKET, BY VEGETATION TYPE
- 5.1. Overview
- 5.1.1. Market size and forecast
- 5.2. Shrubs
- 5.2.1. Key market trends, growth factors and opportunities
- 5.2.2. Market size and forecast, by region
- 5.2.3. Market share analysis by country
- 5.3. Flowers
- 5.3.1. Key market trends, growth factors and opportunities
- 5.3.2. Market size and forecast, by region
- 5.3.3. Market share analysis by country
- 5.4. Others
- 5.4.1. Key market trends, growth factors and opportunities
- 5.4.2. Market size and forecast, by region
- 5.4.3. Market share analysis by country
CHAPTER 6: GREEN FACADE MARKET, BY APPLICATION
- 6.1. Overview
- 6.1.1. Market size and forecast
- 6.2. Residential
- 6.2.1. Key market trends, growth factors and opportunities
- 6.2.2. Market size and forecast, by region
- 6.2.3. Market share analysis by country
- 6.3. Commercial
- 6.3.1. Key market trends, growth factors and opportunities
- 6.3.2. Market size and forecast, by region
- 6.3.3. Market share analysis by country
CHAPTER 7: GREEN FACADE MARKET, BY REGION
- 7.1. Overview
- 7.1.1. Market size and forecast By Region
- 7.2. North America
- 7.2.1. Key market trends, growth factors and opportunities
- 7.2.2. Market size and forecast, by Type
- 7.2.3. Market size and forecast, by Vegetation Type
- 7.2.4. Market size and forecast, by Application
- 7.2.5. Market size and forecast, by country
- 7.2.5.1. U.S.
- 7.2.5.1.1. Market size and forecast, by Type
- 7.2.5.1.2. Market size and forecast, by Vegetation Type
- 7.2.5.1.3. Market size and forecast, by Application
- 7.2.5.2. Canada
- 7.2.5.2.1. Market size and forecast, by Type
- 7.2.5.2.2. Market size and forecast, by Vegetation Type
- 7.2.5.2.3. Market size and forecast, by Application
- 7.2.5.3. Mexico
- 7.2.5.3.1. Market size and forecast, by Type
- 7.2.5.3.2. Market size and forecast, by Vegetation Type
- 7.2.5.3.3. Market size and forecast, by Application
- 7.3. Europe
- 7.3.1. Key market trends, growth factors and opportunities
- 7.3.2. Market size and forecast, by Type
- 7.3.3. Market size and forecast, by Vegetation Type
- 7.3.4. Market size and forecast, by Application
- 7.3.5. Market size and forecast, by country
- 7.3.5.1. Germany
- 7.3.5.1.1. Market size and forecast, by Type
- 7.3.5.1.2. Market size and forecast, by Vegetation Type
- 7.3.5.1.3. Market size and forecast, by Application
- 7.3.5.2. France
- 7.3.5.2.1. Market size and forecast, by Type
- 7.3.5.2.2. Market size and forecast, by Vegetation Type
- 7.3.5.2.3. Market size and forecast, by Application
- 7.3.5.3. UK
- 7.3.5.3.1. Market size and forecast, by Type
- 7.3.5.3.2. Market size and forecast, by Vegetation Type
- 7.3.5.3.3. Market size and forecast, by Application
- 7.3.5.4. Italy
- 7.3.5.4.1. Market size and forecast, by Type
- 7.3.5.4.2. Market size and forecast, by Vegetation Type
- 7.3.5.4.3. Market size and forecast, by Application
- 7.3.5.5. Rest of Europe
- 7.3.5.5.1. Market size and forecast, by Type
- 7.3.5.5.2. Market size and forecast, by Vegetation Type
- 7.3.5.5.3. Market size and forecast, by Application
- 7.4. Asia-Pacific
- 7.4.1. Key market trends, growth factors and opportunities
- 7.4.2. Market size and forecast, by Type
- 7.4.3. Market size and forecast, by Vegetation Type
- 7.4.4. Market size and forecast, by Application
- 7.4.5. Market size and forecast, by country
- 7.4.5.1. China
- 7.4.5.1.1. Market size and forecast, by Type
- 7.4.5.1.2. Market size and forecast, by Vegetation Type
- 7.4.5.1.3. Market size and forecast, by Application
- 7.4.5.2. India
- 7.4.5.2.1. Market size and forecast, by Type
- 7.4.5.2.2. Market size and forecast, by Vegetation Type
- 7.4.5.2.3. Market size and forecast, by Application
- 7.4.5.3. Japan
- 7.4.5.3.1. Market size and forecast, by Type
- 7.4.5.3.2. Market size and forecast, by Vegetation Type
- 7.4.5.3.3. Market size and forecast, by Application
- 7.4.5.4. South Korea
- 7.4.5.4.1. Market size and forecast, by Type
- 7.4.5.4.2. Market size and forecast, by Vegetation Type
- 7.4.5.4.3. Market size and forecast, by Application
- 7.4.5.5. Rest of Asia-Pacific
- 7.4.5.5.1. Market size and forecast, by Type
- 7.4.5.5.2. Market size and forecast, by Vegetation Type
- 7.4.5.5.3. Market size and forecast, by Application
- 7.5. LAMEA
- 7.5.1. Key market trends, growth factors and opportunities
- 7.5.2. Market size and forecast, by Type
- 7.5.3. Market size and forecast, by Vegetation Type
- 7.5.4. Market size and forecast, by Application
- 7.5.5. Market size and forecast, by country
- 7.5.5.1. Latin America
- 7.5.5.1.1. Market size and forecast, by Type
- 7.5.5.1.2. Market size and forecast, by Vegetation Type
- 7.5.5.1.3. Market size and forecast, by Application
- 7.5.5.2. Middle East
- 7.5.5.2.1. Market size and forecast, by Type
- 7.5.5.2.2. Market size and forecast, by Vegetation Type
- 7.5.5.2.3. Market size and forecast, by Application
- 7.5.5.3. Africa
- 7.5.5.3.1. Market size and forecast, by Type
- 7.5.5.3.2. Market size and forecast, by Vegetation Type
- 7.5.5.3.3. Market size and forecast, by Application
CHAPTER 8: COMPETITIVE LANDSCAPE
- 8.1. Introduction
- 8.2. Top winning strategies
- 8.3. Product Mapping of Top 10 Player
- 8.4. Competitive Dashboard
- 8.5. Competitive Heatmap
- 8.6. Top player positioning, 2020
CHAPTER 9: COMPANY PROFILES
- 9.1. ELT India
- 9.1.1. Company overview
- 9.1.2. Key Executives
- 9.1.3. Company snapshot
- 9.1.4. Operating business segments
- 9.1.5. Product portfolio
- 9.2. Biotecture Ltd.
- 9.2.1. Company overview
- 9.2.2. Key Executives
- 9.2.3. Company snapshot
- 9.2.4. Operating business segments
- 9.2.5. Product portfolio
- 9.2.6. Business performance
- 9.3. Lang+Fulton
- 9.3.1. Company overview
- 9.3.2. Key Executives
- 9.3.3. Company snapshot
- 9.3.4. Operating business segments
- 9.3.5. Product portfolio
- 9.4. ANS Group Global Ltd.
- 9.4.1. Company overview
- 9.4.2. Key Executives
- 9.4.3. Company snapshot
- 9.4.4. Operating business segments
- 9.4.5. Product portfolio
- 9.5. Green Roof Technology
- 9.5.1. Company overview
- 9.5.2. Key Executives
- 9.5.3. Company snapshot
- 9.5.4. Operating business segments
- 9.5.5. Product portfolio
- 9.6. GSky Plant System Inc.
- 9.6.1. Company overview
- 9.6.2. Key Executives
- 9.6.3. Company snapshot
- 9.6.4. Operating business segments
- 9.6.5. Product portfolio
- 9.7. LiveWall, LLC
- 9.7.1. Company overview
- 9.7.2. Key Executives
- 9.7.3. Company snapshot
- 9.7.4. Operating business segments
- 9.7.5. Product portfolio
- 9.8. Green over Grey
- 9.8.1. Company overview
- 9.8.2. Key Executives
- 9.8.3. Company snapshot
- 9.8.4. Operating business segments
- 9.8.5. Product portfolio
- 9.9. Naava
- 9.9.1. Company overview
- 9.9.2. Key Executives
- 9.9.3. Company snapshot
- 9.9.4. Operating business segments
- 9.9.5. Product portfolio
- 9.10. Green Fortune
- 9.10.1. Company overview
- 9.10.2. Key Executives
- 9.10.3. Company snapshot
- 9.10.4. Operating business segments
- 9.10.5. Product portfolio
LIST OF TABLES
- TABLE 01. GLOBAL GREEN FACADE MARKET, BY TYPE, 2020-2032 ($THOUSAND)
- TABLE 02. GREEN FACADE MARKET FOR GROUND BASED, BY REGION, 2020-2032 ($THOUSAND)
- TABLE 03. GREEN FACADE MARKET FOR WALL STRUCTURE BASED, BY REGION, 2020-2032 ($THOUSAND)
- TABLE 04. GLOBAL GREEN FACADE MARKET, BY VEGETATION TYPE, 2020-2032 ($THOUSAND)
- TABLE 05. GREEN FACADE MARKET FOR SHRUBS, BY REGION, 2020-2032 ($THOUSAND)
- TABLE 06. GREEN FACADE MARKET FOR FLOWERS, BY REGION, 2020-2032 ($THOUSAND)
- TABLE 07. GREEN FACADE MARKET FOR OTHERS, BY REGION, 2020-2032 ($THOUSAND)
- TABLE 08. GLOBAL GREEN FACADE MARKET, BY APPLICATION, 2020-2032 ($THOUSAND)
- TABLE 09. GREEN FACADE MARKET FOR RESIDENTIAL, BY REGION, 2020-2032 ($THOUSAND)
- TABLE 10. GREEN FACADE MARKET FOR COMMERCIAL, BY REGION, 2020-2032 ($THOUSAND)
- TABLE 11. GREEN FACADE MARKET, BY REGION, 2020-2032 ($THOUSAND)
- TABLE 12. NORTH AMERICA GREEN FACADE MARKET, BY TYPE, 2020-2032 ($THOUSAND)
- TABLE 13. NORTH AMERICA GREEN FACADE MARKET, BY VEGETATION TYPE, 2020-2032 ($THOUSAND)
- TABLE 14. NORTH AMERICA GREEN FACADE MARKET, BY APPLICATION, 2020-2032 ($THOUSAND)
- TABLE 15. NORTH AMERICA GREEN FACADE MARKET, BY COUNTRY, 2020-2032 ($THOUSAND)
- TABLE 16. U.S. GREEN FACADE MARKET, BY TYPE, 2020-2032 ($THOUSAND)
- TABLE 17. U.S. GREEN FACADE MARKET, BY VEGETATION TYPE, 2020-2032 ($THOUSAND)
- TABLE 18. U.S. GREEN FACADE MARKET, BY APPLICATION, 2020-2032 ($THOUSAND)
- TABLE 19. CANADA GREEN FACADE MARKET, BY TYPE, 2020-2032 ($THOUSAND)
- TABLE 20. CANADA GREEN FACADE MARKET, BY VEGETATION TYPE, 2020-2032 ($THOUSAND)
- TABLE 21. CANADA GREEN FACADE MARKET, BY APPLICATION, 2020-2032 ($THOUSAND)
- TABLE 22. MEXICO GREEN FACADE MARKET, BY TYPE, 2020-2032 ($THOUSAND)
- TABLE 23. MEXICO GREEN FACADE MARKET, BY VEGETATION TYPE, 2020-2032 ($THOUSAND)
- TABLE 24. MEXICO GREEN FACADE MARKET, BY APPLICATION, 2020-2032 ($THOUSAND)
- TABLE 25. EUROPE GREEN FACADE MARKET, BY TYPE, 2020-2032 ($THOUSAND)
- TABLE 26. EUROPE GREEN FACADE MARKET, BY VEGETATION TYPE, 2020-2032 ($THOUSAND)
- TABLE 27. EUROPE GREEN FACADE MARKET, BY APPLICATION, 2020-2032 ($THOUSAND)
- TABLE 28. EUROPE GREEN FACADE MARKET, BY COUNTRY, 2020-2032 ($THOUSAND)
- TABLE 29. GERMANY GREEN FACADE MARKET, BY TYPE, 2020-2032 ($THOUSAND)
- TABLE 30. GERMANY GREEN FACADE MARKET, BY VEGETATION TYPE, 2020-2032 ($THOUSAND)
- TABLE 31. GERMANY GREEN FACADE MARKET, BY APPLICATION, 2020-2032 ($THOUSAND)
- TABLE 32. FRANCE GREEN FACADE MARKET, BY TYPE, 2020-2032 ($THOUSAND)
- TABLE 33. FRANCE GREEN FACADE MARKET, BY VEGETATION TYPE, 2020-2032 ($THOUSAND)
- TABLE 34. FRANCE GREEN FACADE MARKET, BY APPLICATION, 2020-2032 ($THOUSAND)
- TABLE 35. UK GREEN FACADE MARKET, BY TYPE, 2020-2032 ($THOUSAND)
- TABLE 36. UK GREEN FACADE MARKET, BY VEGETATION TYPE, 2020-2032 ($THOUSAND)
- TABLE 37. UK GREEN FACADE MARKET, BY APPLICATION, 2020-2032 ($THOUSAND)
- TABLE 38. ITALY GREEN FACADE MARKET, BY TYPE, 2020-2032 ($THOUSAND)
- TABLE 39. ITALY GREEN FACADE MARKET, BY VEGETATION TYPE, 2020-2032 ($THOUSAND)
- TABLE 40. ITALY GREEN FACADE MARKET, BY APPLICATION, 2020-2032 ($THOUSAND)
- TABLE 41. REST OF EUROPE GREEN FACADE MARKET, BY TYPE, 2020-2032 ($THOUSAND)
- TABLE 42. REST OF EUROPE GREEN FACADE MARKET, BY VEGETATION TYPE, 2020-2032 ($THOUSAND)
- TABLE 43. REST OF EUROPE GREEN FACADE MARKET, BY APPLICATION, 2020-2032 ($THOUSAND)
- TABLE 44. ASIA-PACIFIC GREEN FACADE MARKET, BY TYPE, 2020-2032 ($THOUSAND)
- TABLE 45. ASIA-PACIFIC GREEN FACADE MARKET, BY VEGETATION TYPE, 2020-2032 ($THOUSAND)
- TABLE 46. ASIA-PACIFIC GREEN FACADE MARKET, BY APPLICATION, 2020-2032 ($THOUSAND)
- TABLE 47. ASIA-PACIFIC GREEN FACADE MARKET, BY COUNTRY, 2020-2032 ($THOUSAND)
- TABLE 48. CHINA GREEN FACADE MARKET, BY TYPE, 2020-2032 ($THOUSAND)
- TABLE 49. CHINA GREEN FACADE MARKET, BY VEGETATION TYPE, 2020-2032 ($THOUSAND)
- TABLE 50. CHINA GREEN FACADE MARKET, BY APPLICATION, 2020-2032 ($THOUSAND)
- TABLE 51. INDIA GREEN FACADE MARKET, BY TYPE, 2020-2032 ($THOUSAND)
- TABLE 52. INDIA GREEN FACADE MARKET, BY VEGETATION TYPE, 2020-2032 ($THOUSAND)
- TABLE 53. INDIA GREEN FACADE MARKET, BY APPLICATION, 2020-2032 ($THOUSAND)
- TABLE 54. JAPAN GREEN FACADE MARKET, BY TYPE, 2020-2032 ($THOUSAND)
- TABLE 55. JAPAN GREEN FACADE MARKET, BY VEGETATION TYPE, 2020-2032 ($THOUSAND)
- TABLE 56. JAPAN GREEN FACADE MARKET, BY APPLICATION, 2020-2032 ($THOUSAND)
- TABLE 57. SOUTH KOREA GREEN FACADE MARKET, BY TYPE, 2020-2032 ($THOUSAND)
- TABLE 58. SOUTH KOREA GREEN FACADE MARKET, BY VEGETATION TYPE, 2020-2032 ($THOUSAND)
- TABLE 59. SOUTH KOREA GREEN FACADE MARKET, BY APPLICATION, 2020-2032 ($THOUSAND)
- TABLE 60. REST OF ASIA-PACIFIC GREEN FACADE MARKET, BY TYPE, 2020-2032 ($THOUSAND)
- TABLE 61. REST OF ASIA-PACIFIC GREEN FACADE MARKET, BY VEGETATION TYPE, 2020-2032 ($THOUSAND)
- TABLE 62. REST OF ASIA-PACIFIC GREEN FACADE MARKET, BY APPLICATION, 2020-2032 ($THOUSAND)
- TABLE 63. LAMEA GREEN FACADE MARKET, BY TYPE, 2020-2032 ($THOUSAND)
- TABLE 64. LAMEA GREEN FACADE MARKET, BY VEGETATION TYPE, 2020-2032 ($THOUSAND)
- TABLE 65. LAMEA GREEN FACADE MARKET, BY APPLICATION, 2020-2032 ($THOUSAND)
- TABLE 66. LAMEA GREEN FACADE MARKET, BY COUNTRY, 2020-2032 ($THOUSAND)
- TABLE 67. LATIN AMERICA GREEN FACADE MARKET, BY TYPE, 2020-2032 ($THOUSAND)
- TABLE 68. LATIN AMERICA GREEN FACADE MARKET, BY VEGETATION TYPE, 2020-2032 ($THOUSAND)
- TABLE 69. LATIN AMERICA GREEN FACADE MARKET, BY APPLICATION, 2020-2032 ($THOUSAND)
- TABLE 70. MIDDLE EAST GREEN FACADE MARKET, BY TYPE, 2020-2032 ($THOUSAND)
- TABLE 71. MIDDLE EAST GREEN FACADE MARKET, BY VEGETATION TYPE, 2020-2032 ($THOUSAND)
- TABLE 72. MIDDLE EAST GREEN FACADE MARKET, BY APPLICATION, 2020-2032 ($THOUSAND)
- TABLE 73. AFRICA GREEN FACADE MARKET, BY TYPE, 2020-2032 ($THOUSAND)
- TABLE 74. AFRICA GREEN FACADE MARKET, BY VEGETATION TYPE, 2020-2032 ($THOUSAND)
- TABLE 75. AFRICA GREEN FACADE MARKET, BY APPLICATION, 2020-2032 ($THOUSAND)
- TABLE 76. ELT INDIA: KEY EXECUTIVES
- TABLE 77. ELT INDIA: COMPANY SNAPSHOT
- TABLE 78. ELT INDIA: PRODUCT SEGMENTS
- TABLE 79. ELT INDIA: PRODUCT PORTFOLIO
- TABLE 80. BIOTECTURE LTD.: KEY EXECUTIVES
- TABLE 81. BIOTECTURE LTD.: COMPANY SNAPSHOT
- TABLE 82. BIOTECTURE LTD.: PRODUCT SEGMENTS
- TABLE 83. BIOTECTURE LTD.: PRODUCT PORTFOLIO
- TABLE 84. LANG+FULTON: KEY EXECUTIVES
- TABLE 85. LANG+FULTON: COMPANY SNAPSHOT
- TABLE 86. LANG+FULTON: PRODUCT SEGMENTS
- TABLE 87. LANG+FULTON: PRODUCT PORTFOLIO
- TABLE 88. ANS GROUP GLOBAL LTD.: KEY EXECUTIVES
- TABLE 89. ANS GROUP GLOBAL LTD.: COMPANY SNAPSHOT
- TABLE 90. ANS GROUP GLOBAL LTD.: PRODUCT SEGMENTS
- TABLE 91. ANS GROUP GLOBAL LTD.: PRODUCT PORTFOLIO
- TABLE 92. GREEN ROOF TECHNOLOGY: KEY EXECUTIVES
- TABLE 93. GREEN ROOF TECHNOLOGY: COMPANY SNAPSHOT
- TABLE 94. GREEN ROOF TECHNOLOGY: SERVICE SEGMENTS
- TABLE 95. GREEN ROOF TECHNOLOGY: PRODUCT PORTFOLIO
- TABLE 96. GSKY PLANT SYSTEM INC.: KEY EXECUTIVES
- TABLE 97. GSKY PLANT SYSTEM INC.: COMPANY SNAPSHOT
- TABLE 98. GSKY PLANT SYSTEM INC.: PRODUCT SEGMENTS
- TABLE 99. GSKY PLANT SYSTEM INC.: PRODUCT PORTFOLIO
- TABLE 100. LIVEWALL, LLC: KEY EXECUTIVES
- TABLE 101. LIVEWALL, LLC: COMPANY SNAPSHOT
- TABLE 102. LIVEWALL, LLC: PRODUCT SEGMENTS
- TABLE 103. LIVEWALL, LLC: PRODUCT PORTFOLIO
- TABLE 104. GREEN OVER GREY: KEY EXECUTIVES
- TABLE 105. GREEN OVER GREY: COMPANY SNAPSHOT
- TABLE 106. GREEN OVER GREY: PRODUCT SEGMENTS
- TABLE 107. GREEN OVER GREY: PRODUCT PORTFOLIO
- TABLE 108. NAAVA: KEY EXECUTIVES
- TABLE 109. NAAVA: COMPANY SNAPSHOT
- TABLE 110. NAAVA: PRODUCT SEGMENTS
- TABLE 111. NAAVA: PRODUCT PORTFOLIO
- TABLE 112. GREEN FORTUNE: KEY EXECUTIVES
- TABLE 113. GREEN FORTUNE: COMPANY SNAPSHOT
- TABLE 114. GREEN FORTUNE: PRODUCT SEGMENTS
- TABLE 115. GREEN FORTUNE: PRODUCT PORTFOLIO
LIST OF FIGURES
- FIGURE 01. GREEN FACADE MARKET, 2020-2032
- FIGURE 02. SEGMENTATION OF GREEN FACADE MARKET,2020-2032
- FIGURE 03. TOP INVESTMENT POCKETS IN GREEN FACADE MARKET (2023-2032)
- FIGURE 04. LOW BARGAINING POWER OF SUPPLIERS
- FIGURE 05. LOW THREAT OF NEW ENTRANTS
- FIGURE 06. LOW THREAT OF SUBSTITUTES
- FIGURE 07. LOW INTENSITY OF RIVALRY
- FIGURE 08. LOW BARGAINING POWER OF BUYERS
- FIGURE 09. GLOBAL GREEN FACADE MARKET:DRIVERS, RESTRAINTS AND OPPORTUNITIES
- FIGURE 10. GREEN FACADE MARKET, BY TYPE, 2020 AND 2032(%)
- FIGURE 11. COMPARATIVE SHARE ANALYSIS OF GREEN FACADE MARKET FOR GROUND BASED, BY COUNTRY 2020 AND 2032(%)
- FIGURE 12. COMPARATIVE SHARE ANALYSIS OF GREEN FACADE MARKET FOR WALL STRUCTURE BASED, BY COUNTRY 2020 AND 2032(%)
- FIGURE 13. GREEN FACADE MARKET, BY VEGETATION TYPE, 2020 AND 2032(%)
- FIGURE 14. COMPARATIVE SHARE ANALYSIS OF GREEN FACADE MARKET FOR SHRUBS, BY COUNTRY 2020 AND 2032(%)
- FIGURE 15. COMPARATIVE SHARE ANALYSIS OF GREEN FACADE MARKET FOR FLOWERS, BY COUNTRY 2020 AND 2032(%)
- FIGURE 16. COMPARATIVE SHARE ANALYSIS OF GREEN FACADE MARKET FOR OTHERS, BY COUNTRY 2020 AND 2032(%)
- FIGURE 17. GREEN FACADE MARKET, BY APPLICATION, 2020 AND 2032(%)
- FIGURE 18. COMPARATIVE SHARE ANALYSIS OF GREEN FACADE MARKET FOR RESIDENTIAL, BY COUNTRY 2020 AND 2032(%)
- FIGURE 19. COMPARATIVE SHARE ANALYSIS OF GREEN FACADE MARKET FOR COMMERCIAL, BY COUNTRY 2020 AND 2032(%)
- FIGURE 20. GREEN FACADE MARKET BY REGION, 2020 AND 2032(%)
- FIGURE 21. U.S. GREEN FACADE MARKET, 2020-2032 ($THOUSAND)
- FIGURE 22. CANADA GREEN FACADE MARKET, 2020-2032 ($THOUSAND)
- FIGURE 23. MEXICO GREEN FACADE MARKET, 2020-2032 ($THOUSAND)
- FIGURE 24. GERMANY GREEN FACADE MARKET, 2020-2032 ($THOUSAND)
- FIGURE 25. FRANCE GREEN FACADE MARKET, 2020-2032 ($THOUSAND)
- FIGURE 26. UK GREEN FACADE MARKET, 2020-2032 ($THOUSAND)
- FIGURE 27. ITALY GREEN FACADE MARKET, 2020-2032 ($THOUSAND)
- FIGURE 28. REST OF EUROPE GREEN FACADE MARKET, 2020-2032 ($THOUSAND)
- FIGURE 29. CHINA GREEN FACADE MARKET, 2020-2032 ($THOUSAND)
- FIGURE 30. INDIA GREEN FACADE MARKET, 2020-2032 ($THOUSAND)
- FIGURE 31. JAPAN GREEN FACADE MARKET, 2020-2032 ($THOUSAND)
- FIGURE 32. SOUTH KOREA GREEN FACADE MARKET, 2020-2032 ($THOUSAND)
- FIGURE 33. REST OF ASIA-PACIFIC GREEN FACADE MARKET, 2020-2032 ($THOUSAND)
- FIGURE 34. LATIN AMERICA GREEN FACADE MARKET, 2020-2032 ($THOUSAND)
- FIGURE 35. MIDDLE EAST GREEN FACADE MARKET, 2020-2032 ($THOUSAND)
- FIGURE 36. AFRICA GREEN FACADE MARKET, 2020-2032 ($THOUSAND)
- FIGURE 37. TOP WINNING STRATEGIES, BY YEAR
- FIGURE 38. TOP WINNING STRATEGIES, BY DEVELOPMENT
- FIGURE 39. TOP WINNING STRATEGIES, BY COMPANY
- FIGURE 40. PRODUCT MAPPING OF TOP 10 PLAYERS
- FIGURE 41. COMPETITIVE DASHBOARD
- FIGURE 42. COMPETITIVE HEATMAP: GREEN FACADE MARKET
- FIGURE 43. TOP PLAYER POSITIONING, 2020
- FIGURE 44. BIOTECTURE LTD.: NET SALES, 2020-2022 ($MILLION)
- FIGURE 45. BIOTECTURE LTD.: REVENUE SHARE BY SEGMENT, 2022 (%)
- FIGURE 46. BIOTECTURE LTD.: REVENUE SHARE BY REGION, 2022 (%)
 2025年全球单住宅绿建筑市场报告2025年全球多用户住宅绿建筑市场报告
 绿色大楼的美国市场的评估:各产品类型,各建筑类型,各用途,各地区,机会,预测(2018年~2032年)绿色大楼的越南市场评估:各产品类型,建筑各类型,各用途,各地区,机会,预测(2018年~2032年)2025年绿建筑全球市场报告2025年全球非住宅绿建筑市场报告绿色大楼的中国市场的评估:各产品类型,各类型建筑,各用途,各地区,机会,预测(2018年~2032年)绿色建筑市场 - 全球产业规模、份额、趋势、机会和预测,细分,按产品类型(外部、内部)、按应用(住宅、非住宅)、按地区和竞争,2020-2030F印度的绿色建筑市场:各类型建筑,各产品类型,各用途,各地区,机会,预测,2018年~2032年绿色建筑的全球市场:各产品类型,各类型建筑,各用途,各地区,机会,预测,2018年~2032年