


 |
市场调查报告书
商品编码
1414762
飞灰市场:按类别、按应用:2023-2032 年全球机会分析与产业预测Fly Ash Market By Class (Class C, Class F), By Application (Cement and Concrete, Bricks and Blocks, Mining, Water Treatment, Others): Global Opportunity Analysis and Industry Forecast, 2023-2032 |
||||||
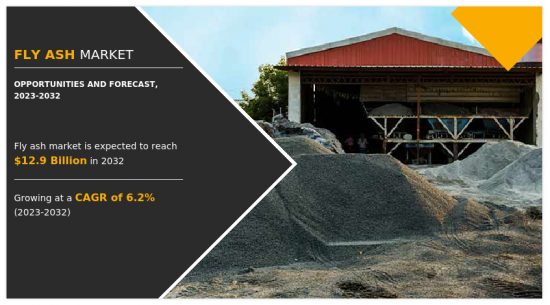
2022年,飞灰市场价值为71亿美元,预计2023年至2032年复合年增长率为6.2%,到2032年达到129亿美元。
飞灰是燃煤发电厂燃烧粉煤所产生的粉末状产品。在燃烧过程中,煤中的矿物杂质融合成球形颗粒,并随废气向上携带。当废气冷却时,颗粒凝固并形成细灰,称为飞灰。飞灰的成分因以下因素而异:
1 燃用煤种、燃烧条件及收集方法。
飞灰被认为是煤炭燃烧的废弃物,其处理会对环境产生影响。随着环境法规变得更加严格,飞灰的回收和再利用变得越来越重要,促进其在各种应用中的使用,包括:
1用于混凝土生产而不是在垃圾掩埋场处置。此外,快速的都市化和人口增长增加了对住宅和基础设施的需求。飞灰用于混凝土生产,其火山灰特性使其成为城市建设中有价值的添加剂,可提高混凝土的性能和耐久性。
此外,全球电力需求持续成长。结果,燃煤发电量增加,飞灰产生量增加。这种丰富的飞灰用于各个行业,并支持飞灰市场的成长。然而,飞灰的品质可能因煤源、燃烧过程和储存条件而异。品质变化给製造商和最终用户带来了挑战,并可能影响混凝土和其他产品的可靠性和性能。
相反,对永续和环保建筑方法的日益重视与使用飞灰作为回收产品是一致的。绿建筑认证和倡议正在促进以下材料的采用:
1飞灰有助于提高能源效率并减少对环境的影响。此外,正在进行和计划中的全球基础设施开拓为建筑材料(包括使用飞灰的混凝土)提供了巨大的市场。随着经济的发展,对永续建筑实践的需求增加,为飞灰的利用创造了机会。
目录
第一章简介
第 2 章执行摘要
第三章市场概况
- 市场定义和范围
- 主要发现
- 影响因素
- 主要投资机会
- 波特五力分析
- 市场动态
- 促进因素
- 具有成本效益的替代方案
- 能源需求扩大
- 永续性意识
- 研究和技术进步
- 基础建设发展
- 都市化进程
- 环境法规
- 抑制因素
- 品质差异
- 可得性和供应链问题
- 与替代材料的竞争
- 交通费用
- 机会
- 绿建筑倡议
- 数位化和供应链优化
- 促进因素
- 价值链分析
- 专利形势
- 价格分析
- 关键监管分析
第四章飞灰市场:依类别
- 概述
- C级
- F级
第五章飞灰市场:依应用分类
- 概述
- 水泥和混凝土
- 砖块
- 矿业
- 水处理
- 其他的
第六章飞灰市场:依地区
- 概述
- 北美洲
- 美国
- 加拿大
- 墨西哥
- 欧洲
- 德国
- 英国
- 法国
- 西班牙
- 义大利
- 其他的
- 亚太地区
- 中国
- 印度
- 日本
- 韩国
- 澳洲
- 其他的
- 拉丁美洲/中东/非洲
- 巴西
- 沙乌地阿拉伯
- 南非
- 其他的
第七章 竞争形势
- 介绍
- 关键成功策略
- 10家主要企业产品图谱
- 竞争对手仪表板
- 竞争热图
- 2022年主要企业定位
第八章 公司简介
- Boral
- Charah Solutions, Inc.
- CEMEX, SAB de CV
- HOLCIM
- Cement Australia
- Salt River Materials Group
- Ashtech India Pvt. Ltd.
- USB Chemicals
- Kumaraswamy Industries
- Ankitraj Expo Trade Pvt. Ltd.
According to a new report published by Allied Market Research, titled, "Fly Ash Market," The fly ash market was valued at $7.1 billion in 2022, and is estimated to reach $12.9 billion by 2032, growing at a CAGR of 6.2% from 2023 to 2032.
Fly ash is a fine, powdery byproduct resulting from the combustion of pulverized coal in coal-fired power plants. During the combustion process, the mineral impurities in the coal fuse into spherical particles, and these particles are carried upward with the flue gases. As the gases cool, the particles solidify and form the fine ash known as fly ash. The composition of fly ash can vary based on factors such as the type of coal burned, combustion conditions, and collection methods.
Fly ash is considered a waste product from coal combustion, and its disposal can have environmental implications. As environmental regulations become more stringent, there is a growing emphasis on recycling and reusing fly ash, promoting its use in various applications such as concrete production instead of being disposed of in landfills. Furthermore, rapid urbanization and population growth lead to increased demand for housing and infrastructure. Fly ash is used in concrete production, and its pozzolanic properties make it a valuable additive that enhances the performance and durability of concrete, making it a preferred choice in urban construction.
Moreover, the demand for electricity continues to rise globally. As a result, the production of coal-based power increases, leading to a higher volume of fly ash generation. This abundance of fly ash can be utilized in various industries, sustaining the growth of the fly ash market. However, the quality of fly ash can vary depending on the source of coal, combustion process, and storage conditions. Inconsistent quality may pose challenges for manufacturers and end-users, impacting the reliability and performance of concrete and other products.
On the contrary, the growing emphasis on sustainable and environmentally friendly construction practices aligns with the use of fly ash as a recycled byproduct. Green building certifications and initiatives promote the adoption of materials such as fly ash that contribute to energy efficiency and reduced environmental impact. Additionally, the ongoing and planned infrastructure development globally provides a substantial market for construction materials, including concrete with fly ash. As economies expand, the demand for sustainable construction practices increases, creating opportunities for fly ash utilization.
The fly ash market is segmented on the basis of class, application, and region. On the basis of class, the market is categorized into class C and class F. On the basis of application, it is divided into cement and concrete, bricks and blocks, mining, water treatment, and others. Region-wise, the market is studied across North America, Europe, Asia-Pacific, and LAMEA.
The global fly ash market profiles leading players that include CEMEX, S.A.B. de C.V, Lafarge North America, Holcim Ltd., Salt River Materials Group, Boral Limited, Charah Solutions, FlyAshDirect, Cement Australia Pty Limited, and Tarmac Holdings Limited.
Key Benefits For Stakeholders
- This report provides a quantitative analysis of the market segments, current trends, estimations, and dynamics of the fly ash market analysis from 2022 to 2032 to identify the prevailing fly ash market opportunities.
- The market research is offered along with information related to key drivers, restraints, and opportunities.
- Porter's five forces analysis highlights the potency of buyers and suppliers to enable stakeholders make profit-oriented business decisions and strengthen their supplier-buyer network.
- In-depth analysis of the fly ash market segmentation assists to determine the prevailing market opportunities.
- Major countries in each region are mapped according to their revenue contribution to the global market.
- Market player positioning facilitates benchmarking and provides a clear understanding of the present position of the market players.
- The report includes the analysis of the regional as well as global fly ash market trends, key players, market segments, application areas, and market growth strategies.
Additional benefits you will get with this purchase are:
- Quarterly Update and* (only available with a corporate license, on listed price)
- 5 additional Company Profile of client Choice pre- or Post-purchase, as a free update.
- Free Upcoming Version on the Purchase of Five and Enterprise User License.
- 16 analyst hours of support* (post-purchase, if you find additional data requirements upon review of the report, you may receive support amounting to 16 analyst hours to solve questions, and post-sale queries)
- 15% Free Customization* (in case the scope or segment of the report does not match your requirements, 15% is equivalent to 3 working days of free work, applicable once)
- Free data Pack on the Five and Enterprise User License. (Excel version of the report)
- Free Updated report if the report is 6-12 months old or older.
- 24-hour priority response*
- Free Industry updates and white papers.
Possible Customization with this report (with additional cost and timeline, please talk to the sales executive to know more)
- Analysis of raw material in a product (by %)
- Manufacturing Capacity
- Investment Opportunities
- Supply Chain Analysis & Vendor Margins
- Technology Trend Analysis
- New Product Development/ Product Matrix of Key Players
- Patient/epidemiology data at country, region, global level
- Regulatory Guidelines
- Additional company profiles with specific to client's interest
- Additional country or region analysis- market size and forecast
- Average Selling Price Analysis / Price Point Analysis
- Expanded list for Company Profiles
- Historic market data
- Import Export Analysis/Data
- Key player details (including location, contact details, supplier/vendor network etc. in excel format)
- Market share analysis of players at global/region/country level
- Volume Market Size and Forecast
Key Market Segments
By Class
- Class C
- Class F
By Application
- Cement and Concrete
- Bricks and Blocks
- Mining
- Water Treatment
- Others
By Region
- North America
- U.S.
- Canada
- Mexico
- Europe
- Germany
- UK
- France
- Spain
- Italy
- Rest of Europe
- Asia-Pacific
- China
- India
- Japan
- South Korea
- Australia
- Rest of Asia-Pacific
- LAMEA
- Brazil
- Saudi Arabia
- South Africa
- Rest of LAMEA
Key Market Players:
- CEMEX, S.A.B. de C.V.
- Salt River Materials Group
- Cement Australia
- Charah Solutions, Inc.
- Boral
- HOLCIM
- Ashtech India Pvt. Ltd.
- U S B Chemicals
- Ankitraj Expo Trade Pvt. Ltd.
- Kumaraswamy Industries
TABLE OF CONTENTS
CHAPTER 1: INTRODUCTION
- 1.1. Report description
- 1.2. Key market segments
- 1.3. Key benefits to the stakeholders
- 1.4. Research methodology
- 1.4.1. Primary research
- 1.4.2. Secondary research
- 1.4.3. Analyst tools and models
CHAPTER 2: EXECUTIVE SUMMARY
- 2.1. CXO Perspective
CHAPTER 3: MARKET OVERVIEW
- 3.1. Market definition and scope
- 3.2. Key findings
- 3.2.1. Top impacting factors
- 3.2.2. Top investment pockets
- 3.3. Porter's five forces analysis
- 3.3.1. Moderate bargaining power of suppliers
- 3.3.2. Moderate threat of new entrants
- 3.3.3. Moderate threat of substitutes
- 3.3.4. Moderate intensity of rivalry
- 3.3.5. Moderate bargaining power of buyers
- 3.4. Market dynamics
- 3.4.1. Drivers
- 3.4.1.1. Cost-Effective Alternative
- 3.4.1.2. Growing energy demand
- 3.4.1.3. Awareness of sustainable practices
- 3.4.1.4. Research and Technological Advancements
- 3.4.1.5. Infrastructure Development
- 3.4.1.6. Increase in Urbanization
- 3.4.1.7. Environmental Regulations
- 3.4.2. Restraints
- 3.4.2.1. Quality Variability
- 3.4.2.2. Availability and supply chain issues
- 3.4.2.3. Competition from alternative materials
- 3.4.2.4. Transportation Costs
- 3.4.3. Opportunities
- 3.4.3.1. Green Building Initiatives
- 3.4.3.2. Digitalization and supply chain optimization
- 3.4.1. Drivers
- 3.5. Value Chain Analysis
- 3.6. Patent Landscape
- 3.7. Pricing Analysis
- 3.8. Key Regulation Analysis
CHAPTER 4: FLY ASH MARKET, BY CLASS
- 4.1. Overview
- 4.1.1. Market size and forecast
- 4.2. Class C
- 4.2.1. Key market trends, growth factors and opportunities
- 4.2.2. Market size and forecast, by region
- 4.2.3. Market share analysis by country
- 4.3. Class F
- 4.3.1. Key market trends, growth factors and opportunities
- 4.3.2. Market size and forecast, by region
- 4.3.3. Market share analysis by country
CHAPTER 5: FLY ASH MARKET, BY APPLICATION
- 5.1. Overview
- 5.1.1. Market size and forecast
- 5.2. Cement and Concrete
- 5.2.1. Key market trends, growth factors and opportunities
- 5.2.2. Market size and forecast, by region
- 5.2.3. Market share analysis by country
- 5.3. Bricks and Blocks
- 5.3.1. Key market trends, growth factors and opportunities
- 5.3.2. Market size and forecast, by region
- 5.3.3. Market share analysis by country
- 5.4. Mining
- 5.4.1. Key market trends, growth factors and opportunities
- 5.4.2. Market size and forecast, by region
- 5.4.3. Market share analysis by country
- 5.5. Water Treatment
- 5.5.1. Key market trends, growth factors and opportunities
- 5.5.2. Market size and forecast, by region
- 5.5.3. Market share analysis by country
- 5.6. Others
- 5.6.1. Key market trends, growth factors and opportunities
- 5.6.2. Market size and forecast, by region
- 5.6.3. Market share analysis by country
CHAPTER 6: FLY ASH MARKET, BY REGION
- 6.1. Overview
- 6.1.1. Market size and forecast By Region
- 6.2. North America
- 6.2.1. Key market trends, growth factors and opportunities
- 6.2.2. Market size and forecast, by Class
- 6.2.3. Market size and forecast, by Application
- 6.2.4. Market size and forecast, by country
- 6.2.4.1. U.S.
- 6.2.4.1.1. Market size and forecast, by Class
- 6.2.4.1.2. Market size and forecast, by Application
- 6.2.4.2. Canada
- 6.2.4.2.1. Market size and forecast, by Class
- 6.2.4.2.2. Market size and forecast, by Application
- 6.2.4.3. Mexico
- 6.2.4.3.1. Market size and forecast, by Class
- 6.2.4.3.2. Market size and forecast, by Application
- 6.3. Europe
- 6.3.1. Key market trends, growth factors and opportunities
- 6.3.2. Market size and forecast, by Class
- 6.3.3. Market size and forecast, by Application
- 6.3.4. Market size and forecast, by country
- 6.3.4.1. Germany
- 6.3.4.1.1. Market size and forecast, by Class
- 6.3.4.1.2. Market size and forecast, by Application
- 6.3.4.2. UK
- 6.3.4.2.1. Market size and forecast, by Class
- 6.3.4.2.2. Market size and forecast, by Application
- 6.3.4.3. France
- 6.3.4.3.1. Market size and forecast, by Class
- 6.3.4.3.2. Market size and forecast, by Application
- 6.3.4.4. Spain
- 6.3.4.4.1. Market size and forecast, by Class
- 6.3.4.4.2. Market size and forecast, by Application
- 6.3.4.5. Italy
- 6.3.4.5.1. Market size and forecast, by Class
- 6.3.4.5.2. Market size and forecast, by Application
- 6.3.4.6. Rest of Europe
- 6.3.4.6.1. Market size and forecast, by Class
- 6.3.4.6.2. Market size and forecast, by Application
- 6.4. Asia-Pacific
- 6.4.1. Key market trends, growth factors and opportunities
- 6.4.2. Market size and forecast, by Class
- 6.4.3. Market size and forecast, by Application
- 6.4.4. Market size and forecast, by country
- 6.4.4.1. China
- 6.4.4.1.1. Market size and forecast, by Class
- 6.4.4.1.2. Market size and forecast, by Application
- 6.4.4.2. India
- 6.4.4.2.1. Market size and forecast, by Class
- 6.4.4.2.2. Market size and forecast, by Application
- 6.4.4.3. Japan
- 6.4.4.3.1. Market size and forecast, by Class
- 6.4.4.3.2. Market size and forecast, by Application
- 6.4.4.4. South Korea
- 6.4.4.4.1. Market size and forecast, by Class
- 6.4.4.4.2. Market size and forecast, by Application
- 6.4.4.5. Australia
- 6.4.4.5.1. Market size and forecast, by Class
- 6.4.4.5.2. Market size and forecast, by Application
- 6.4.4.6. Rest of Asia-Pacific
- 6.4.4.6.1. Market size and forecast, by Class
- 6.4.4.6.2. Market size and forecast, by Application
- 6.5. LAMEA
- 6.5.1. Key market trends, growth factors and opportunities
- 6.5.2. Market size and forecast, by Class
- 6.5.3. Market size and forecast, by Application
- 6.5.4. Market size and forecast, by country
- 6.5.4.1. Brazil
- 6.5.4.1.1. Market size and forecast, by Class
- 6.5.4.1.2. Market size and forecast, by Application
- 6.5.4.2. Saudi Arabia
- 6.5.4.2.1. Market size and forecast, by Class
- 6.5.4.2.2. Market size and forecast, by Application
- 6.5.4.3. South Africa
- 6.5.4.3.1. Market size and forecast, by Class
- 6.5.4.3.2. Market size and forecast, by Application
- 6.5.4.4. Rest of LAMEA
- 6.5.4.4.1. Market size and forecast, by Class
- 6.5.4.4.2. Market size and forecast, by Application
CHAPTER 7: COMPETITIVE LANDSCAPE
- 7.1. Introduction
- 7.2. Top winning strategies
- 7.3. Product mapping of top 10 player
- 7.4. Competitive dashboard
- 7.5. Competitive heatmap
- 7.6. Top player positioning, 2022
CHAPTER 8: COMPANY PROFILES
- 8.1. Boral
- 8.1.1. Company overview
- 8.1.2. Key executives
- 8.1.3. Company snapshot
- 8.1.4. Operating business segments
- 8.1.5. Product portfolio
- 8.1.6. Business performance
- 8.2. Charah Solutions, Inc.
- 8.2.1. Company overview
- 8.2.2. Key executives
- 8.2.3. Company snapshot
- 8.2.4. Operating business segments
- 8.2.5. Product portfolio
- 8.2.6. Business performance
- 8.3. CEMEX, S.A.B. de C.V.
- 8.3.1. Company overview
- 8.3.2. Key executives
- 8.3.3. Company snapshot
- 8.3.4. Operating business segments
- 8.3.5. Product portfolio
- 8.3.6. Business performance
- 8.3.7. Key strategic moves and developments
- 8.4. HOLCIM
- 8.4.1. Company overview
- 8.4.2. Key executives
- 8.4.3. Company snapshot
- 8.4.4. Operating business segments
- 8.4.5. Product portfolio
- 8.4.6. Business performance
- 8.4.7. Key strategic moves and developments
- 8.5. Cement Australia
- 8.5.1. Company overview
- 8.5.2. Key executives
- 8.5.3. Company snapshot
- 8.5.4. Operating business segments
- 8.5.5. Product portfolio
- 8.6. Salt River Materials Group
- 8.6.1. Company overview
- 8.6.2. Key executives
- 8.6.3. Company snapshot
- 8.6.4. Operating business segments
- 8.6.5. Product portfolio
- 8.7. Ashtech India Pvt. Ltd.
- 8.7.1. Company overview
- 8.7.2. Key executives
- 8.7.3. Company snapshot
- 8.7.4. Operating business segments
- 8.7.5. Product portfolio
- 8.8. U S B Chemicals
- 8.8.1. Company overview
- 8.8.2. Key executives
- 8.8.3. Company snapshot
- 8.8.4. Operating business segments
- 8.8.5. Product portfolio
- 8.9. Kumaraswamy Industries
- 8.9.1. Company overview
- 8.9.2. Key executives
- 8.9.3. Company snapshot
- 8.9.4. Operating business segments
- 8.9.5. Product portfolio
- 8.10. Ankitraj Expo Trade Pvt. Ltd.
- 8.10.1. Company overview
- 8.10.2. Key executives
- 8.10.3. Company snapshot
- 8.10.4. Operating business segments
- 8.10.5. Product portfolio
LIST OF TABLES
- TABLE 01. GLOBAL FLY ASH MARKET, BY CLASS, 2022-2032 ($MILLION)
- TABLE 02. GLOBAL FLY ASH MARKET, BY CLASS, 2022-2032 (KILOTON)
- TABLE 03. FLY ASH MARKET FOR CLASS C, BY REGION, 2022-2032 ($MILLION)
- TABLE 04. FLY ASH MARKET FOR CLASS C, BY REGION, 2022-2032 (KILOTON)
- TABLE 05. FLY ASH MARKET FOR CLASS F, BY REGION, 2022-2032 ($MILLION)
- TABLE 06. FLY ASH MARKET FOR CLASS F, BY REGION, 2022-2032 (KILOTON)
- TABLE 07. GLOBAL FLY ASH MARKET, BY APPLICATION, 2022-2032 ($MILLION)
- TABLE 08. GLOBAL FLY ASH MARKET, BY APPLICATION, 2022-2032 (KILOTON)
- TABLE 09. FLY ASH MARKET FOR CEMENT AND CONCRETE, BY REGION, 2022-2032 ($MILLION)
- TABLE 10. FLY ASH MARKET FOR CEMENT AND CONCRETE, BY REGION, 2022-2032 (KILOTON)
- TABLE 11. FLY ASH MARKET FOR BRICKS AND BLOCKS, BY REGION, 2022-2032 ($MILLION)
- TABLE 12. FLY ASH MARKET FOR BRICKS AND BLOCKS, BY REGION, 2022-2032 (KILOTON)
- TABLE 13. FLY ASH MARKET FOR MINING, BY REGION, 2022-2032 ($MILLION)
- TABLE 14. FLY ASH MARKET FOR MINING, BY REGION, 2022-2032 (KILOTON)
- TABLE 15. FLY ASH MARKET FOR WATER TREATMENT, BY REGION, 2022-2032 ($MILLION)
- TABLE 16. FLY ASH MARKET FOR WATER TREATMENT, BY REGION, 2022-2032 (KILOTON)
- TABLE 17. FLY ASH MARKET FOR OTHERS, BY REGION, 2022-2032 ($MILLION)
- TABLE 18. FLY ASH MARKET FOR OTHERS, BY REGION, 2022-2032 (KILOTON)
- TABLE 19. FLY ASH MARKET, BY REGION, 2022-2032 ($MILLION)
- TABLE 20. FLY ASH MARKET, BY REGION, 2022-2032 (KILOTON)
- TABLE 21. NORTH AMERICA FLY ASH MARKET, BY CLASS, 2022-2032 ($MILLION)
- TABLE 22. NORTH AMERICA FLY ASH MARKET, BY CLASS, 2022-2032 (KILOTON)
- TABLE 23. NORTH AMERICA FLY ASH MARKET, BY APPLICATION, 2022-2032 ($MILLION)
- TABLE 24. NORTH AMERICA FLY ASH MARKET, BY APPLICATION, 2022-2032 (KILOTON)
- TABLE 25. NORTH AMERICA FLY ASH MARKET, BY COUNTRY, 2022-2032 ($MILLION)
- TABLE 26. NORTH AMERICA FLY ASH MARKET, BY COUNTRY, 2022-2032 (KILOTON)
- TABLE 27. U.S. FLY ASH MARKET, BY CLASS, 2022-2032 ($MILLION)
- TABLE 28. U.S. FLY ASH MARKET, BY CLASS, 2022-2032 (KILOTON)
- TABLE 29. U.S. FLY ASH MARKET, BY APPLICATION, 2022-2032 ($MILLION)
- TABLE 30. U.S. FLY ASH MARKET, BY APPLICATION, 2022-2032 (KILOTON)
- TABLE 31. CANADA FLY ASH MARKET, BY CLASS, 2022-2032 ($MILLION)
- TABLE 32. CANADA FLY ASH MARKET, BY CLASS, 2022-2032 (KILOTON)
- TABLE 33. CANADA FLY ASH MARKET, BY APPLICATION, 2022-2032 ($MILLION)
- TABLE 34. CANADA FLY ASH MARKET, BY APPLICATION, 2022-2032 (KILOTON)
- TABLE 35. MEXICO FLY ASH MARKET, BY CLASS, 2022-2032 ($MILLION)
- TABLE 36. MEXICO FLY ASH MARKET, BY CLASS, 2022-2032 (KILOTON)
- TABLE 37. MEXICO FLY ASH MARKET, BY APPLICATION, 2022-2032 ($MILLION)
- TABLE 38. MEXICO FLY ASH MARKET, BY APPLICATION, 2022-2032 (KILOTON)
- TABLE 39. EUROPE FLY ASH MARKET, BY CLASS, 2022-2032 ($MILLION)
- TABLE 40. EUROPE FLY ASH MARKET, BY CLASS, 2022-2032 (KILOTON)
- TABLE 41. EUROPE FLY ASH MARKET, BY APPLICATION, 2022-2032 ($MILLION)
- TABLE 42. EUROPE FLY ASH MARKET, BY APPLICATION, 2022-2032 (KILOTON)
- TABLE 43. EUROPE FLY ASH MARKET, BY COUNTRY, 2022-2032 ($MILLION)
- TABLE 44. EUROPE FLY ASH MARKET, BY COUNTRY, 2022-2032 (KILOTON)
- TABLE 45. GERMANY FLY ASH MARKET, BY CLASS, 2022-2032 ($MILLION)
- TABLE 46. GERMANY FLY ASH MARKET, BY CLASS, 2022-2032 (KILOTON)
- TABLE 47. GERMANY FLY ASH MARKET, BY APPLICATION, 2022-2032 ($MILLION)
- TABLE 48. GERMANY FLY ASH MARKET, BY APPLICATION, 2022-2032 (KILOTON)
- TABLE 49. UK FLY ASH MARKET, BY CLASS, 2022-2032 ($MILLION)
- TABLE 50. UK FLY ASH MARKET, BY CLASS, 2022-2032 (KILOTON)
- TABLE 51. UK FLY ASH MARKET, BY APPLICATION, 2022-2032 ($MILLION)
- TABLE 52. UK FLY ASH MARKET, BY APPLICATION, 2022-2032 (KILOTON)
- TABLE 53. FRANCE FLY ASH MARKET, BY CLASS, 2022-2032 ($MILLION)
- TABLE 54. FRANCE FLY ASH MARKET, BY CLASS, 2022-2032 (KILOTON)
- TABLE 55. FRANCE FLY ASH MARKET, BY APPLICATION, 2022-2032 ($MILLION)
- TABLE 56. FRANCE FLY ASH MARKET, BY APPLICATION, 2022-2032 (KILOTON)
- TABLE 57. SPAIN FLY ASH MARKET, BY CLASS, 2022-2032 ($MILLION)
- TABLE 58. SPAIN FLY ASH MARKET, BY CLASS, 2022-2032 (KILOTON)
- TABLE 59. SPAIN FLY ASH MARKET, BY APPLICATION, 2022-2032 ($MILLION)
- TABLE 60. SPAIN FLY ASH MARKET, BY APPLICATION, 2022-2032 (KILOTON)
- TABLE 61. ITALY FLY ASH MARKET, BY CLASS, 2022-2032 ($MILLION)
- TABLE 62. ITALY FLY ASH MARKET, BY CLASS, 2022-2032 (KILOTON)
- TABLE 63. ITALY FLY ASH MARKET, BY APPLICATION, 2022-2032 ($MILLION)
- TABLE 64. ITALY FLY ASH MARKET, BY APPLICATION, 2022-2032 (KILOTON)
- TABLE 65. REST OF EUROPE FLY ASH MARKET, BY CLASS, 2022-2032 ($MILLION)
- TABLE 66. REST OF EUROPE FLY ASH MARKET, BY CLASS, 2022-2032 (KILOTON)
- TABLE 67. REST OF EUROPE FLY ASH MARKET, BY APPLICATION, 2022-2032 ($MILLION)
- TABLE 68. REST OF EUROPE FLY ASH MARKET, BY APPLICATION, 2022-2032 (KILOTON)
- TABLE 69. ASIA-PACIFIC FLY ASH MARKET, BY CLASS, 2022-2032 ($MILLION)
- TABLE 70. ASIA-PACIFIC FLY ASH MARKET, BY CLASS, 2022-2032 (KILOTON)
- TABLE 71. ASIA-PACIFIC FLY ASH MARKET, BY APPLICATION, 2022-2032 ($MILLION)
- TABLE 72. ASIA-PACIFIC FLY ASH MARKET, BY APPLICATION, 2022-2032 (KILOTON)
- TABLE 73. ASIA-PACIFIC FLY ASH MARKET, BY COUNTRY, 2022-2032 ($MILLION)
- TABLE 74. ASIA-PACIFIC FLY ASH MARKET, BY COUNTRY, 2022-2032 (KILOTON)
- TABLE 75. CHINA FLY ASH MARKET, BY CLASS, 2022-2032 ($MILLION)
- TABLE 76. CHINA FLY ASH MARKET, BY CLASS, 2022-2032 (KILOTON)
- TABLE 77. CHINA FLY ASH MARKET, BY APPLICATION, 2022-2032 ($MILLION)
- TABLE 78. CHINA FLY ASH MARKET, BY APPLICATION, 2022-2032 (KILOTON)
- TABLE 79. INDIA FLY ASH MARKET, BY CLASS, 2022-2032 ($MILLION)
- TABLE 80. INDIA FLY ASH MARKET, BY CLASS, 2022-2032 (KILOTON)
- TABLE 81. INDIA FLY ASH MARKET, BY APPLICATION, 2022-2032 ($MILLION)
- TABLE 82. INDIA FLY ASH MARKET, BY APPLICATION, 2022-2032 (KILOTON)
- TABLE 83. JAPAN FLY ASH MARKET, BY CLASS, 2022-2032 ($MILLION)
- TABLE 84. JAPAN FLY ASH MARKET, BY CLASS, 2022-2032 (KILOTON)
- TABLE 85. JAPAN FLY ASH MARKET, BY APPLICATION, 2022-2032 ($MILLION)
- TABLE 86. JAPAN FLY ASH MARKET, BY APPLICATION, 2022-2032 (KILOTON)
- TABLE 87. SOUTH KOREA FLY ASH MARKET, BY CLASS, 2022-2032 ($MILLION)
- TABLE 88. SOUTH KOREA FLY ASH MARKET, BY CLASS, 2022-2032 (KILOTON)
- TABLE 89. SOUTH KOREA FLY ASH MARKET, BY APPLICATION, 2022-2032 ($MILLION)
- TABLE 90. SOUTH KOREA FLY ASH MARKET, BY APPLICATION, 2022-2032 (KILOTON)
- TABLE 91. AUSTRALIA FLY ASH MARKET, BY CLASS, 2022-2032 ($MILLION)
- TABLE 92. AUSTRALIA FLY ASH MARKET, BY CLASS, 2022-2032 (KILOTON)
- TABLE 93. AUSTRALIA FLY ASH MARKET, BY APPLICATION, 2022-2032 ($MILLION)
- TABLE 94. AUSTRALIA FLY ASH MARKET, BY APPLICATION, 2022-2032 (KILOTON)
- TABLE 95. REST OF ASIA-PACIFIC FLY ASH MARKET, BY CLASS, 2022-2032 ($MILLION)
- TABLE 96. REST OF ASIA-PACIFIC FLY ASH MARKET, BY CLASS, 2022-2032 (KILOTON)
- TABLE 97. REST OF ASIA-PACIFIC FLY ASH MARKET, BY APPLICATION, 2022-2032 ($MILLION)
- TABLE 98. REST OF ASIA-PACIFIC FLY ASH MARKET, BY APPLICATION, 2022-2032 (KILOTON)
- TABLE 99. LAMEA FLY ASH MARKET, BY CLASS, 2022-2032 ($MILLION)
- TABLE 100. LAMEA FLY ASH MARKET, BY CLASS, 2022-2032 (KILOTON)
- TABLE 101. LAMEA FLY ASH MARKET, BY APPLICATION, 2022-2032 ($MILLION)
- TABLE 102. LAMEA FLY ASH MARKET, BY APPLICATION, 2022-2032 (KILOTON)
- TABLE 103. LAMEA FLY ASH MARKET, BY COUNTRY, 2022-2032 ($MILLION)
- TABLE 104. LAMEA FLY ASH MARKET, BY COUNTRY, 2022-2032 (KILOTON)
- TABLE 105. BRAZIL FLY ASH MARKET, BY CLASS, 2022-2032 ($MILLION)
- TABLE 106. BRAZIL FLY ASH MARKET, BY CLASS, 2022-2032 (KILOTON)
- TABLE 107. BRAZIL FLY ASH MARKET, BY APPLICATION, 2022-2032 ($MILLION)
- TABLE 108. BRAZIL FLY ASH MARKET, BY APPLICATION, 2022-2032 (KILOTON)
- TABLE 109. SAUDI ARABIA FLY ASH MARKET, BY CLASS, 2022-2032 ($MILLION)
- TABLE 110. SAUDI ARABIA FLY ASH MARKET, BY CLASS, 2022-2032 (KILOTON)
- TABLE 111. SAUDI ARABIA FLY ASH MARKET, BY APPLICATION, 2022-2032 ($MILLION)
- TABLE 112. SAUDI ARABIA FLY ASH MARKET, BY APPLICATION, 2022-2032 (KILOTON)
- TABLE 113. SOUTH AFRICA FLY ASH MARKET, BY CLASS, 2022-2032 ($MILLION)
- TABLE 114. SOUTH AFRICA FLY ASH MARKET, BY CLASS, 2022-2032 (KILOTON)
- TABLE 115. SOUTH AFRICA FLY ASH MARKET, BY APPLICATION, 2022-2032 ($MILLION)
- TABLE 116. SOUTH AFRICA FLY ASH MARKET, BY APPLICATION, 2022-2032 (KILOTON)
- TABLE 117. REST OF LAMEA FLY ASH MARKET, BY CLASS, 2022-2032 ($MILLION)
- TABLE 118. REST OF LAMEA FLY ASH MARKET, BY CLASS, 2022-2032 (KILOTON)
- TABLE 119. REST OF LAMEA FLY ASH MARKET, BY APPLICATION, 2022-2032 ($MILLION)
- TABLE 120. REST OF LAMEA FLY ASH MARKET, BY APPLICATION, 2022-2032 (KILOTON)
- TABLE 121. BORAL: KEY EXECUTIVES
- TABLE 122. BORAL: COMPANY SNAPSHOT
- TABLE 123. BORAL: PRODUCT SEGMENTS
- TABLE 124. BORAL: PRODUCT PORTFOLIO
- TABLE 125. CHARAH SOLUTIONS, INC.: KEY EXECUTIVES
- TABLE 126. CHARAH SOLUTIONS, INC.: COMPANY SNAPSHOT
- TABLE 127. CHARAH SOLUTIONS, INC.: PRODUCT SEGMENTS
- TABLE 128. CHARAH SOLUTIONS, INC.: PRODUCT PORTFOLIO
- TABLE 129. CEMEX, S.A.B. DE C.V.: KEY EXECUTIVES
- TABLE 130. CEMEX, S.A.B. DE C.V.: COMPANY SNAPSHOT
- TABLE 131. CEMEX, S.A.B. DE C.V.: PRODUCT SEGMENTS
- TABLE 132. CEMEX, S.A.B. DE C.V.: PRODUCT PORTFOLIO
- TABLE 133. CEMEX, S.A.B. DE C.V.: KEY STRATERGIES
- TABLE 134. HOLCIM: KEY EXECUTIVES
- TABLE 135. HOLCIM: COMPANY SNAPSHOT
- TABLE 136. HOLCIM: PRODUCT SEGMENTS
- TABLE 137. HOLCIM: PRODUCT PORTFOLIO
- TABLE 138. HOLCIM: KEY STRATERGIES
- TABLE 139. CEMENT AUSTRALIA: KEY EXECUTIVES
- TABLE 140. CEMENT AUSTRALIA: COMPANY SNAPSHOT
- TABLE 141. CEMENT AUSTRALIA: PRODUCT SEGMENTS
- TABLE 142. CEMENT AUSTRALIA: PRODUCT PORTFOLIO
- TABLE 143. SALT RIVER MATERIALS GROUP: KEY EXECUTIVES
- TABLE 144. SALT RIVER MATERIALS GROUP: COMPANY SNAPSHOT
- TABLE 145. SALT RIVER MATERIALS GROUP: PRODUCT SEGMENTS
- TABLE 146. SALT RIVER MATERIALS GROUP: PRODUCT PORTFOLIO
- TABLE 147. ASHTECH INDIA PVT. LTD.: KEY EXECUTIVES
- TABLE 148. ASHTECH INDIA PVT. LTD.: COMPANY SNAPSHOT
- TABLE 149. ASHTECH INDIA PVT. LTD.: PRODUCT SEGMENTS
- TABLE 150. ASHTECH INDIA PVT. LTD.: PRODUCT PORTFOLIO
- TABLE 151. U S B CHEMICALS: KEY EXECUTIVES
- TABLE 152. U S B CHEMICALS: COMPANY SNAPSHOT
- TABLE 153. U S B CHEMICALS: PRODUCT SEGMENTS
- TABLE 154. U S B CHEMICALS: PRODUCT PORTFOLIO
- TABLE 155. KUMARASWAMY INDUSTRIES: KEY EXECUTIVES
- TABLE 156. KUMARASWAMY INDUSTRIES: COMPANY SNAPSHOT
- TABLE 157. KUMARASWAMY INDUSTRIES: PRODUCT SEGMENTS
- TABLE 158. KUMARASWAMY INDUSTRIES: PRODUCT PORTFOLIO
- TABLE 159. ANKITRAJ EXPO TRADE PVT. LTD.: KEY EXECUTIVES
- TABLE 160. ANKITRAJ EXPO TRADE PVT. LTD.: COMPANY SNAPSHOT
- TABLE 161. ANKITRAJ EXPO TRADE PVT. LTD.: PRODUCT SEGMENTS
- TABLE 162. ANKITRAJ EXPO TRADE PVT. LTD.: PRODUCT PORTFOLIO
LIST OF FIGURES
- FIGURE 01. FLY ASH MARKET, 2022-2032
- FIGURE 02. SEGMENTATION OF FLY ASH MARKET,2022-2032
- FIGURE 03. TOP IMPACTING FACTORS IN FLY ASH MARKET (2022 TO 2032)
- FIGURE 04. TOP INVESTMENT POCKETS IN FLY ASH MARKET (2023-2032)
- FIGURE 05. MODERATE BARGAINING POWER OF SUPPLIERS
- FIGURE 06. MODERATE THREAT OF NEW ENTRANTS
- FIGURE 07. MODERATE THREAT OF SUBSTITUTES
- FIGURE 08. MODERATE INTENSITY OF RIVALRY
- FIGURE 09. MODERATE BARGAINING POWER OF BUYERS
- FIGURE 10. GLOBAL FLY ASH MARKET:DRIVERS, RESTRAINTS AND OPPORTUNITIES
- FIGURE 11. PATENT ANALYSIS BY COMPANY
- FIGURE 12. PATENT ANALYSIS BY COUNTRY
- FIGURE 13. PRICING ANALYSIS: FLY ASH MARKET 2022 AND 2032
- FIGURE 14. IMPACT OF KEY REGULATION: FLY ASH MARKET
- FIGURE 15. FLY ASH MARKET, BY CLASS, 2022 AND 2032(%)
- FIGURE 16. COMPARATIVE SHARE ANALYSIS OF FLY ASH MARKET FOR CLASS C, BY COUNTRY 2022 AND 2032(%)
- FIGURE 17. COMPARATIVE SHARE ANALYSIS OF FLY ASH MARKET FOR CLASS F, BY COUNTRY 2022 AND 2032(%)
- FIGURE 18. FLY ASH MARKET, BY APPLICATION, 2022 AND 2032(%)
- FIGURE 19. COMPARATIVE SHARE ANALYSIS OF FLY ASH MARKET FOR CEMENT AND CONCRETE, BY COUNTRY 2022 AND 2032(%)
- FIGURE 20. COMPARATIVE SHARE ANALYSIS OF FLY ASH MARKET FOR BRICKS AND BLOCKS, BY COUNTRY 2022 AND 2032(%)
- FIGURE 21. COMPARATIVE SHARE ANALYSIS OF FLY ASH MARKET FOR MINING, BY COUNTRY 2022 AND 2032(%)
- FIGURE 22. COMPARATIVE SHARE ANALYSIS OF FLY ASH MARKET FOR WATER TREATMENT, BY COUNTRY 2022 AND 2032(%)
- FIGURE 23. COMPARATIVE SHARE ANALYSIS OF FLY ASH MARKET FOR OTHERS, BY COUNTRY 2022 AND 2032(%)
- FIGURE 24. FLY ASH MARKET BY REGION, 2022 AND 2032(%)
- FIGURE 25. U.S. FLY ASH MARKET, 2022-2032 ($MILLION)
- FIGURE 26. CANADA FLY ASH MARKET, 2022-2032 ($MILLION)
- FIGURE 27. MEXICO FLY ASH MARKET, 2022-2032 ($MILLION)
- FIGURE 28. GERMANY FLY ASH MARKET, 2022-2032 ($MILLION)
- FIGURE 29. UK FLY ASH MARKET, 2022-2032 ($MILLION)
- FIGURE 30. FRANCE FLY ASH MARKET, 2022-2032 ($MILLION)
- FIGURE 31. SPAIN FLY ASH MARKET, 2022-2032 ($MILLION)
- FIGURE 32. ITALY FLY ASH MARKET, 2022-2032 ($MILLION)
- FIGURE 33. REST OF EUROPE FLY ASH MARKET, 2022-2032 ($MILLION)
- FIGURE 34. CHINA FLY ASH MARKET, 2022-2032 ($MILLION)
- FIGURE 35. INDIA FLY ASH MARKET, 2022-2032 ($MILLION)
- FIGURE 36. JAPAN FLY ASH MARKET, 2022-2032 ($MILLION)
- FIGURE 37. SOUTH KOREA FLY ASH MARKET, 2022-2032 ($MILLION)
- FIGURE 38. AUSTRALIA FLY ASH MARKET, 2022-2032 ($MILLION)
- FIGURE 39. REST OF ASIA-PACIFIC FLY ASH MARKET, 2022-2032 ($MILLION)
- FIGURE 40. BRAZIL FLY ASH MARKET, 2022-2032 ($MILLION)
- FIGURE 41. SAUDI ARABIA FLY ASH MARKET, 2022-2032 ($MILLION)
- FIGURE 42. SOUTH AFRICA FLY ASH MARKET, 2022-2032 ($MILLION)
- FIGURE 43. REST OF LAMEA FLY ASH MARKET, 2022-2032 ($MILLION)
- FIGURE 44. TOP WINNING STRATEGIES, BY YEAR (2020-2023)
- FIGURE 45. TOP WINNING STRATEGIES, BY DEVELOPMENT (2020-2023)
- FIGURE 46. TOP WINNING STRATEGIES, BY COMPANY (2020-2023)
- FIGURE 47. PRODUCT MAPPING OF TOP 10 PLAYERS
- FIGURE 48. COMPETITIVE DASHBOARD
- FIGURE 49. COMPETITIVE HEATMAP: FLY ASH MARKET
- FIGURE 50. TOP PLAYER POSITIONING, 2022
- FIGURE 51. BORAL: NET REVENUE, 2021-2023 ($MILLION)
- FIGURE 52. BORAL: REVENUE SHARE BY SEGMENT, 2023 (%)
- FIGURE 53. CHARAH SOLUTIONS, INC.: NET REVENUE, 2019-2021 ($MILLION)
- FIGURE 54. CEMEX, S.A.B. DE C.V.: NET SALES, 2020-2022 ($MILLION)
- FIGURE 55. CEMEX, S.A.B. DE C.V.: REVENUE SHARE BY REGION, 2022 (%)
- FIGURE 56. HOLCIM: NET SALES, 2020-2022 ($MILLION)
- FIGURE 57. HOLCIM: RESEARCH & DEVELOPMENT EXPENDITURE, 2020-2022 ($MILLION)
- FIGURE 58. HOLCIM: REVENUE SHARE BY SEGMENT, 2022 (%)
- FIGURE 59. HOLCIM: REVENUE SHARE BY REGION, 2022 (%)


