


 |
市场调查报告书
商品编码
1414773
电池管理系统市场:按电池类型、拓扑、应用:2023-2032 年全球机会分析和产业预测Battery Management System Market By Battery Type, By Topology, By Application : Global Opportunity Analysis and Industry Forecast, 2023-2032 |
||||||
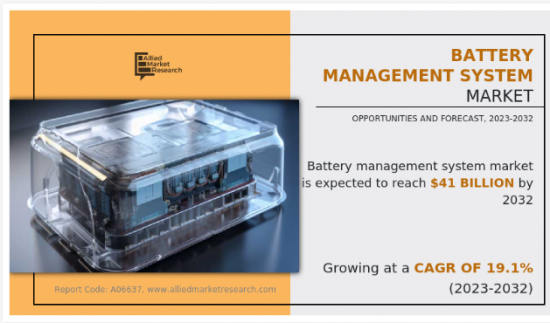
由于二次电池在各种最终用途行业中的使用不断增加,预计从 2023 年到 2032 年,电池管理系统市场将出现 19.1% 的显着增长率。
例如,2023年4月,总部位于班加罗尔的先进电池技术和深度技术新兴企业Log9 Materials建立了印度第一家商业锂离子(Li-ion)电池製造工厂。此外,该公司还推出了 Charvik,这是一种电池管理系统,具有先进的电源控制演算法来管理锂离子电池。此外,2023年1月,电动车充电器和锂离子电池製造商Exicom与英雄电气签署协议,为锂电池提供电池管理系统。根据该协议,Hero Electric 同意每年购买 5,000 套 Exicom 的 BMS(电池管理系统)。此外,锂电池製造商也为其电池提供BMS。
例如,2020年12月,锂离子电池企业Inverted Energy宣布推出首款先进电池管理系统OJAS BMS。此类新兴市场的开拓预计将推动该领域电池管理系统市场的成长。分散式拓扑更准确且更便宜,因为每个单元都有一个专用的微控制器。此外,这种类型的电池管理系统具有扩充性,可以透过改变电池板的数量来进行改造。
此外,这种类型的 BMS 也用于高阶解决方案,例如:
1 个无线 BMS。例如,2022年5月,全球知名汽车供应商马瑞利发布了最新的无线分散式电池管理系统(wBMS),扩展了电动车的电池管理技术。该技术消除了其他架构中对电池管理系统 (BMS) 实体连接的要求。结果是提高了弹性、效率、可靠性和成本效益,所有这些都是电动车的关键考虑因素。
这些优势正在推动分散式拓扑领域的成长。近年来,锂离子电池在汽车、航太、家电等各行业的使用不断增加。这种选择是由于锂离子电池比以前的电池技术具有更高的能量密度、更长的使用寿命和更低的环境影响。因此,对确保这些电池高效、安全运作的电池管理系统 (BMS) 的需求急剧增加。然而,BMS 市场受到组件设计复杂性以及安装高效能温度控管系统相关挑战的限制。此外,世界各国政府正在投资开拓电动车充电站和其他基础设施,以促进电动车的广泛普及,以减少碳排放并应对气候变迁。
政府在电动车基础设施上的支出增加为电池管理系统市场带来了巨大的机会。电池管理系统市场按电池类型、拓扑、应用和区域进行细分。依电池类型分为锂离子电池、铅酸电池、镍电池等。根据拓朴结构,可分为集中式、分散式和模组化。按应用细分为汽车、IT/通讯、家电、工业等。从区域来看,分析包括北美、欧洲、亚太地区和拉丁美洲地区。本报告介绍的主要企业包括Sensata Technologies, Inc.、NXP Semiconductors、瑞萨电子公司、Analog Devices, Inc.、德州仪器(TI)、意法半导体、Leclanche SA、Nuvation Energy、Elithion Inc.、Eberspacher Gruppe GmbH &Co.KG、英飞凌Technologies AG 与 Exponential Power。
目录
第一章简介
第 2 章执行摘要
第三章市场概况
- 市场定义和范围
- 主要发现
- 影响因素
- 主要投资机会
- 波特五力分析
- 市场动态
- 促进因素
- 电动车 (EV) 和混合动力电动车 (HEV) 的采用率增加
- 业界对锂离子电池的使用偏好
- 二次电池在各种最终用途行业中的使用不断增加
- 电动车远距快速充电技术的增加
- 抑制因素
- 添加电池管理系统会增加整体产品成本
- 复杂的组件设计和电池温度控管系统挑战
- 机会
- 基于人工智慧的云端连接电动车电池管理系统的演变
- 增加政府支出发展电动车基础设施
- 可再生能源需求增加
- 无线电池管理系统的开发
- 促进因素
第四章电池管理系统市场:依电池类型
- 概述
- 锂离子电池
- 铅酸蓄电池
- 镍基
- 其他的
第五章电池管理系统市场:依拓朴分类
- 概述
- 集中
- 分散式
- 模组化的
第六章电池管理系统市场:依应用分类
- 概述
- 车
- 通讯
- 家用电器
- 工业的
- 其他的
第七章电池管理系统市场:按地区
- 概述
- 北美洲
- 美国
- 加拿大
- 墨西哥
- 欧洲
- 英国
- 德国
- 法国
- 义大利
- 其他的
- 亚太地区
- 中国
- 日本
- 印度
- 韩国
- 其他的
- 拉丁美洲
- 拉丁美洲
- 中东
- 北非
- 其他非洲
第八章 竞争形势
- 介绍
- 关键成功策略
- 10家主要企业产品图谱
- 竞争对手仪表板
- 竞争热图
- 2022年主要企业定位
第九章 公司简介
- Nuvation Energy
- Exponential Power
- Infineon Technologies AG
- Renesas Electronics Corporation
- Sensata Technologies, Inc.
- Texas Instruments Incorporated
- Elithion Inc.
- Analog Devices, Inc.
- Eberspacher
- NXP Semiconductors
- STMicroelectronics
- Leclanche SA
The Battery Management System Market is expected to experience a significant growth rate of 19.1% from 2023 to 2032 owing to an increase in the use of rechargeable batteries in a wide range of end-use industries - Allied Market Research
For instance, in April 2023, Log9 Materials, a Bengaluru-based advanced battery technology, and deep-technology startup, established first commercial lithium-ion (Li-ion) cell manufacturing plant in India. Moreover, the company also unveiled its battery management system, Charvik, which is equipped with advanced power control algorithms to manage lithium-ion batteries. In addition, in January 2023, Exicom, a manufacturer of electric car chargers and lithium-ion batteries, signed an agreement with Hero Electric to offer its battery management systems for lithium batteries. Hero Electric has agreed to buy 5 lakh Exicom BMS (Battery Management Systems) every year under the terms of the agreement. Moreover, lithium battery manufacturers offered BMS for their batteries.
For instance, in December 2020, Inverted energy, a lithium-ion battery business, announced the launch of its first advanced battery management system, OJAS BMS. Developments like this are anticipated to propel the growth of the battery management system market for this segment. Distributed type of topology provides improved precision, owing to the presence of dedicated microcontrollers for each cell, and are cheaper in price. In addition, these types of battery management systems are scalable and may be transformed by varying the number of cell boards.
Moreover, this type of BMS is adopted for advanced solutions such as wireless BMS. For instance, in May 2022 Marelli, a prominent global automotive supplier, launched a new state-of-the-art Wireless Distributed Battery Management System (wBMS) and expanded battery management technologies for electric vehicles. This technology removes the requirement for physical connections in battery management systems (BMS) found in other architectures. As a result, it offers improved flexibility, efficiency, dependability, and cost-effectiveness, which are crucial considerations for electric vehicles.
Thus, these advantages drive growth for the distributed topology segment. In recent years, the use of lithium-ion batteries has increased in a variety of industries, including automotive, aerospace, and consumer electronics. This movement in choice is being driven by higher energy density, longer lifespan, and lower environmental impact of lithium-ion batteries as compared to previous battery technologies. As a result, the demand for battery management systems (BMS) to ensure the efficient and safe operation of these batteries has expanded dramatically. However, the BMS market is restricted by the complexity of component design and the challenges associated with installing efficient thermal management systems.Moreover, governments throughout the world invest in the development of EV charging stations and other infrastructure to facilitate the broad adoption of EVs in order to cut carbon emissions and combat climate change.
The increased government spending on EV infrastructure creates a substantial opportunity for the battery management system market. The battery management system market is segmented on the basis of battery type, topology, application, and region. On the basis of battery type, the market is categorized into lithium-ion based, lead-acid based, nickel based, and others. On the basis of topology, it is segregated into centralized, distributed, and modular. On the basis of application, it is fragmented into automotive, telecommunication, consumer electronics, industrial, and others. On the basis of region, the market is analyzed across North America, Europe, Asia-Pacific, and LAMEA. Key players profiled in the report include Sensata Technologies, Inc., NXP Semiconductors, Renesas Electronics Corporation., Analog Devices, Inc., Texas Instruments Incorporated, STMicroelectronics, Leclanche SA, Nuvation Energy, Elithion Inc., Eberspacher Gruppe GmbH & Co. KG, Infineon Technologies AG, and Exponential Power.
Key Benefits For Stakeholders
- This report provides a quantitative analysis of the market segments, current trends, estimations, and dynamics of the battery management system market analysis from 2022 to 2032 to identify the prevailing battery management system market opportunities.
- The market research is offered along with information related to key drivers, restraints, and opportunities.
- Porter's five forces analysis highlights the potency of buyers and suppliers to enable stakeholders make profit-oriented business decisions and strengthen their supplier-buyer network.
- In-depth analysis of the battery management system market segmentation assists to determine the prevailing market opportunities.
- Major countries in each region are mapped according to their revenue contribution to the global market.
- Market player positioning facilitates benchmarking and provides a clear understanding of the present position of the market players.
- The report includes the analysis of the regional as well as global battery management system market trends, key players, market segments, application areas, and market growth strategies.
Additional benefits you will get with this purchase are:
- Quarterly Update and* (only available with a corporate license, on listed price)
- 5 additional Company Profile of client Choice pre- or Post-purchase, as a free update.
- Free Upcoming Version on the Purchase of Five and Enterprise User License.
- 16 analyst hours of support* (post-purchase, if you find additional data requirements upon review of the report, you may receive support amounting to 16 analyst hours to solve questions, and post-sale queries)
- 15% Free Customization* (in case the scope or segment of the report does not match your requirements, 15% is equivalent to 3 working days of free work, applicable once)
- Free data Pack on the Five and Enterprise User License. (Excel version of the report)
- Free Updated report if the report is 6-12 months old or older.
- 24-hour priority response*
- Free Industry updates and white papers.
Possible Customization with this report (with additional cost and timeline, please talk to the sales executive to know more)
- Additional company profiles with specific to client's interest
- SWOT Analysis
Key Market Segments
By Battery Type
- Lithium-ion based
- Lead-acid based
- Nickel-based
- Others
By Topology
- Centralized
- Distributed
- Modular
By Application
- Automotive
- Telecommunication
- Consumer electronics
- Industrial
- Others
By Region
- North America
- U.S.
- Canada
- Mexico
- Europe
- UK
- Germany
- France
- Italy
- Rest of Europe
- Asia-Pacific
- China
- Japan
- India
- South Korea
- Rest of Asia-Pacific
- LAMEA
- Latin America
- Middle East
- North Africa
- Rest Of Africa
Key Market Players:
- Infineon Technologies AG
- Renesas Electronics Corporation
- Texas Instruments Incorporated
- Elithion Inc.
- Eberspacher
- Leclanche SA
- Nuvation Energy
- STMicroelectronics
- Analog Devices, Inc.
- Exponential Power
- Sensata Technologies, Inc.
- NXP Semiconductors
TABLE OF CONTENTS
CHAPTER 1: INTRODUCTION
- 1.1. Report description
- 1.2. Key market segments
- 1.3. Key benefits to the stakeholders
- 1.4. Research methodology
- 1.4.1. Primary research
- 1.4.2. Secondary research
- 1.4.3. Analyst tools and models
CHAPTER 2: EXECUTIVE SUMMARY
- 2.1. CXO Perspective
CHAPTER 3: MARKET OVERVIEW
- 3.1. Market definition and scope
- 3.2. Key findings
- 3.2.1. Top impacting factors
- 3.2.2. Top investment pockets
- 3.3. Porter's five forces analysis
- 3.3.1. Low bargaining power of suppliers
- 3.3.2. Low threat of new entrants
- 3.3.3. Low threat of substitutes
- 3.3.4. Low intensity of rivalry
- 3.3.5. Low bargaining power of buyers
- 3.4. Market dynamics
- 3.4.1. Drivers
- 3.4.1.1. Increase in adoption of electric vehicles (EVs) and hybrid electric vehicles (HEVs)
- 3.4.1.2. Surge in industry preference toward the utilization of lithium-ion batteries
- 3.4.1.3. Rise in the use of rechargeable batteries across a variety of end-use industries
- 3.4.1.4. Increase in long-range and fast charging technology in electric vehicles
- 3.4.2. Restraints
- 3.4.2.1. Increase in the overall cost of the product with the addition of a battery management system
- 3.4.2.2. Complex component design and difficulties in battery thermal management systems
- 3.4.3. Opportunities
- 3.4.3.1. Evolution of an AI-based cloud-connected electric vehicle battery management system
- 3.4.3.2. Increase in government spending to develop electric vehicle infrastructure
- 3.4.3.3. Increase in demand for renewable energy
- 3.4.3.4. Development of a wireless battery management system
- 3.4.1. Drivers
CHAPTER 4: BATTERY MANAGEMENT SYSTEM MARKET, BY BATTERY TYPE
- 4.1. Overview
- 4.1.1. Market size and forecast
- 4.2. Lithium-ion based
- 4.2.1. Key market trends, growth factors and opportunities
- 4.2.2. Market size and forecast, by region
- 4.2.3. Market share analysis by country
- 4.3. Lead-acid based
- 4.3.1. Key market trends, growth factors and opportunities
- 4.3.2. Market size and forecast, by region
- 4.3.3. Market share analysis by country
- 4.4. Nickel-based
- 4.4.1. Key market trends, growth factors and opportunities
- 4.4.2. Market size and forecast, by region
- 4.4.3. Market share analysis by country
- 4.5. Others
- 4.5.1. Key market trends, growth factors and opportunities
- 4.5.2. Market size and forecast, by region
- 4.5.3. Market share analysis by country
CHAPTER 5: BATTERY MANAGEMENT SYSTEM MARKET, BY TOPOLOGY
- 5.1. Overview
- 5.1.1. Market size and forecast
- 5.2. Centralized
- 5.2.1. Key market trends, growth factors and opportunities
- 5.2.2. Market size and forecast, by region
- 5.2.3. Market share analysis by country
- 5.3. Distributed
- 5.3.1. Key market trends, growth factors and opportunities
- 5.3.2. Market size and forecast, by region
- 5.3.3. Market share analysis by country
- 5.4. Modular
- 5.4.1. Key market trends, growth factors and opportunities
- 5.4.2. Market size and forecast, by region
- 5.4.3. Market share analysis by country
CHAPTER 6: BATTERY MANAGEMENT SYSTEM MARKET, BY APPLICATION
- 6.1. Overview
- 6.1.1. Market size and forecast
- 6.2. Automotive
- 6.2.1. Key market trends, growth factors and opportunities
- 6.2.2. Market size and forecast, by region
- 6.2.3. Market share analysis by country
- 6.3. Telecommunication
- 6.3.1. Key market trends, growth factors and opportunities
- 6.3.2. Market size and forecast, by region
- 6.3.3. Market share analysis by country
- 6.4. Consumer electronics
- 6.4.1. Key market trends, growth factors and opportunities
- 6.4.2. Market size and forecast, by region
- 6.4.3. Market share analysis by country
- 6.5. Industrial
- 6.5.1. Key market trends, growth factors and opportunities
- 6.5.2. Market size and forecast, by region
- 6.5.3. Market share analysis by country
- 6.6. Others
- 6.6.1. Key market trends, growth factors and opportunities
- 6.6.2. Market size and forecast, by region
- 6.6.3. Market share analysis by country
CHAPTER 7: BATTERY MANAGEMENT SYSTEM MARKET, BY REGION
- 7.1. Overview
- 7.1.1. Market size and forecast By Region
- 7.2. North America
- 7.2.1. Key market trends, growth factors and opportunities
- 7.2.2. Market size and forecast, by Battery Type
- 7.2.3. Market size and forecast, by Topology
- 7.2.4. Market size and forecast, by Application
- 7.2.5. Market size and forecast, by country
- 7.2.5.1. U.S.
- 7.2.5.1.1. Market size and forecast, by Battery Type
- 7.2.5.1.2. Market size and forecast, by Topology
- 7.2.5.1.3. Market size and forecast, by Application
- 7.2.5.2. Canada
- 7.2.5.2.1. Market size and forecast, by Battery Type
- 7.2.5.2.2. Market size and forecast, by Topology
- 7.2.5.2.3. Market size and forecast, by Application
- 7.2.5.3. Mexico
- 7.2.5.3.1. Market size and forecast, by Battery Type
- 7.2.5.3.2. Market size and forecast, by Topology
- 7.2.5.3.3. Market size and forecast, by Application
- 7.3. Europe
- 7.3.1. Key market trends, growth factors and opportunities
- 7.3.2. Market size and forecast, by Battery Type
- 7.3.3. Market size and forecast, by Topology
- 7.3.4. Market size and forecast, by Application
- 7.3.5. Market size and forecast, by country
- 7.3.5.1. UK
- 7.3.5.1.1. Market size and forecast, by Battery Type
- 7.3.5.1.2. Market size and forecast, by Topology
- 7.3.5.1.3. Market size and forecast, by Application
- 7.3.5.2. Germany
- 7.3.5.2.1. Market size and forecast, by Battery Type
- 7.3.5.2.2. Market size and forecast, by Topology
- 7.3.5.2.3. Market size and forecast, by Application
- 7.3.5.3. France
- 7.3.5.3.1. Market size and forecast, by Battery Type
- 7.3.5.3.2. Market size and forecast, by Topology
- 7.3.5.3.3. Market size and forecast, by Application
- 7.3.5.4. Italy
- 7.3.5.4.1. Market size and forecast, by Battery Type
- 7.3.5.4.2. Market size and forecast, by Topology
- 7.3.5.4.3. Market size and forecast, by Application
- 7.3.5.5. Rest of Europe
- 7.3.5.5.1. Market size and forecast, by Battery Type
- 7.3.5.5.2. Market size and forecast, by Topology
- 7.3.5.5.3. Market size and forecast, by Application
- 7.4. Asia-Pacific
- 7.4.1. Key market trends, growth factors and opportunities
- 7.4.2. Market size and forecast, by Battery Type
- 7.4.3. Market size and forecast, by Topology
- 7.4.4. Market size and forecast, by Application
- 7.4.5. Market size and forecast, by country
- 7.4.5.1. China
- 7.4.5.1.1. Market size and forecast, by Battery Type
- 7.4.5.1.2. Market size and forecast, by Topology
- 7.4.5.1.3. Market size and forecast, by Application
- 7.4.5.2. Japan
- 7.4.5.2.1. Market size and forecast, by Battery Type
- 7.4.5.2.2. Market size and forecast, by Topology
- 7.4.5.2.3. Market size and forecast, by Application
- 7.4.5.3. India
- 7.4.5.3.1. Market size and forecast, by Battery Type
- 7.4.5.3.2. Market size and forecast, by Topology
- 7.4.5.3.3. Market size and forecast, by Application
- 7.4.5.4. South Korea
- 7.4.5.4.1. Market size and forecast, by Battery Type
- 7.4.5.4.2. Market size and forecast, by Topology
- 7.4.5.4.3. Market size and forecast, by Application
- 7.4.5.5. Rest of Asia-Pacific
- 7.4.5.5.1. Market size and forecast, by Battery Type
- 7.4.5.5.2. Market size and forecast, by Topology
- 7.4.5.5.3. Market size and forecast, by Application
- 7.5. LAMEA
- 7.5.1. Key market trends, growth factors and opportunities
- 7.5.2. Market size and forecast, by Battery Type
- 7.5.3. Market size and forecast, by Topology
- 7.5.4. Market size and forecast, by Application
- 7.5.5. Market size and forecast, by country
- 7.5.5.1. Latin America
- 7.5.5.1.1. Market size and forecast, by Battery Type
- 7.5.5.1.2. Market size and forecast, by Topology
- 7.5.5.1.3. Market size and forecast, by Application
- 7.5.5.2. Middle East
- 7.5.5.2.1. Market size and forecast, by Battery Type
- 7.5.5.2.2. Market size and forecast, by Topology
- 7.5.5.2.3. Market size and forecast, by Application
- 7.5.5.3. North Africa
- 7.5.5.3.1. Market size and forecast, by Battery Type
- 7.5.5.3.2. Market size and forecast, by Topology
- 7.5.5.3.3. Market size and forecast, by Application
- 7.5.5.4. Rest Of Africa
- 7.5.5.4.1. Market size and forecast, by Battery Type
- 7.5.5.4.2. Market size and forecast, by Topology
- 7.5.5.4.3. Market size and forecast, by Application
CHAPTER 8: COMPETITIVE LANDSCAPE
- 8.1. Introduction
- 8.2. Top winning strategies
- 8.3. Product mapping of top 10 player
- 8.4. Competitive dashboard
- 8.5. Competitive heatmap
- 8.6. Top player positioning, 2022
CHAPTER 9: COMPANY PROFILES
- 9.1. Nuvation Energy
- 9.1.1. Company overview
- 9.1.2. Key executives
- 9.1.3. Company snapshot
- 9.1.4. Operating business segments
- 9.1.5. Product portfolio
- 9.1.6. Key strategic moves and developments
- 9.2. Exponential Power
- 9.2.1. Company overview
- 9.2.2. Key executives
- 9.2.3. Company snapshot
- 9.2.4. Operating business segments
- 9.2.5. Product portfolio
- 9.3. Infineon Technologies AG
- 9.3.1. Company overview
- 9.3.2. Key executives
- 9.3.3. Company snapshot
- 9.3.4. Operating business segments
- 9.3.5. Product portfolio
- 9.3.6. Business performance
- 9.3.7. Key strategic moves and developments
- 9.4. Renesas Electronics Corporation
- 9.4.1. Company overview
- 9.4.2. Key executives
- 9.4.3. Company snapshot
- 9.4.4. Operating business segments
- 9.4.5. Product portfolio
- 9.4.6. Business performance
- 9.4.7. Key strategic moves and developments
- 9.5. Sensata Technologies, Inc.
- 9.5.1. Company overview
- 9.5.2. Key executives
- 9.5.3. Company snapshot
- 9.5.4. Operating business segments
- 9.5.5. Product portfolio
- 9.5.6. Business performance
- 9.5.7. Key strategic moves and developments
- 9.6. Texas Instruments Incorporated
- 9.6.1. Company overview
- 9.6.2. Key executives
- 9.6.3. Company snapshot
- 9.6.4. Operating business segments
- 9.6.5. Product portfolio
- 9.6.6. Business performance
- 9.6.7. Key strategic moves and developments
- 9.7. Elithion Inc.
- 9.7.1. Company overview
- 9.7.2. Key executives
- 9.7.3. Company snapshot
- 9.7.4. Operating business segments
- 9.7.5. Product portfolio
- 9.8. Analog Devices, Inc.
- 9.8.1. Company overview
- 9.8.2. Key executives
- 9.8.3. Company snapshot
- 9.8.4. Operating business segments
- 9.8.5. Product portfolio
- 9.8.6. Business performance
- 9.8.7. Key strategic moves and developments
- 9.9. Eberspacher
- 9.9.1. Company overview
- 9.9.2. Key executives
- 9.9.3. Company snapshot
- 9.9.4. Operating business segments
- 9.9.5. Product portfolio
- 9.9.6. Business performance
- 9.9.7. Key strategic moves and developments
- 9.10. NXP Semiconductors
- 9.10.1. Company overview
- 9.10.2. Key executives
- 9.10.3. Company snapshot
- 9.10.4. Operating business segments
- 9.10.5. Product portfolio
- 9.10.6. Business performance
- 9.10.7. Key strategic moves and developments
- 9.11. STMicroelectronics
- 9.11.1. Company overview
- 9.11.2. Key executives
- 9.11.3. Company snapshot
- 9.11.4. Operating business segments
- 9.11.5. Product portfolio
- 9.11.6. Business performance
- 9.11.7. Key strategic moves and developments
- 9.12. Leclanche SA
- 9.12.1. Company overview
- 9.12.2. Key executives
- 9.12.3. Company snapshot
- 9.12.4. Operating business segments
- 9.12.5. Product portfolio
- 9.12.6. Business performance
- 9.12.7. Key strategic moves and developments
LIST OF TABLES
- TABLE 01. GLOBAL BATTERY MANAGEMENT SYSTEM MARKET, BY BATTERY TYPE, 2022-2032 ($MILLION)
- TABLE 02. BATTERY MANAGEMENT SYSTEM MARKET FOR LITHIUM-ION BASED, BY REGION, 2022-2032 ($MILLION)
- TABLE 03. BATTERY MANAGEMENT SYSTEM MARKET FOR LEAD-ACID BASED, BY REGION, 2022-2032 ($MILLION)
- TABLE 04. BATTERY MANAGEMENT SYSTEM MARKET FOR NICKEL-BASED, BY REGION, 2022-2032 ($MILLION)
- TABLE 05. BATTERY MANAGEMENT SYSTEM MARKET FOR OTHERS, BY REGION, 2022-2032 ($MILLION)
- TABLE 06. GLOBAL BATTERY MANAGEMENT SYSTEM MARKET, BY TOPOLOGY, 2022-2032 ($MILLION)
- TABLE 07. BATTERY MANAGEMENT SYSTEM MARKET FOR CENTRALIZED, BY REGION, 2022-2032 ($MILLION)
- TABLE 08. BATTERY MANAGEMENT SYSTEM MARKET FOR DISTRIBUTED, BY REGION, 2022-2032 ($MILLION)
- TABLE 09. BATTERY MANAGEMENT SYSTEM MARKET FOR MODULAR, BY REGION, 2022-2032 ($MILLION)
- TABLE 10. GLOBAL BATTERY MANAGEMENT SYSTEM MARKET, BY APPLICATION, 2022-2032 ($MILLION)
- TABLE 11. BATTERY MANAGEMENT SYSTEM MARKET FOR AUTOMOTIVE, BY REGION, 2022-2032 ($MILLION)
- TABLE 12. BATTERY MANAGEMENT SYSTEM MARKET FOR TELECOMMUNICATION, BY REGION, 2022-2032 ($MILLION)
- TABLE 13. BATTERY MANAGEMENT SYSTEM MARKET FOR CONSUMER ELECTRONICS, BY REGION, 2022-2032 ($MILLION)
- TABLE 14. BATTERY MANAGEMENT SYSTEM MARKET FOR INDUSTRIAL, BY REGION, 2022-2032 ($MILLION)
- TABLE 15. BATTERY MANAGEMENT SYSTEM MARKET FOR OTHERS, BY REGION, 2022-2032 ($MILLION)
- TABLE 16. BATTERY MANAGEMENT SYSTEM MARKET, BY REGION, 2022-2032 ($MILLION)
- TABLE 17. NORTH AMERICA BATTERY MANAGEMENT SYSTEM MARKET, BY BATTERY TYPE, 2022-2032 ($MILLION)
- TABLE 18. NORTH AMERICA BATTERY MANAGEMENT SYSTEM MARKET, BY TOPOLOGY, 2022-2032 ($MILLION)
- TABLE 19. NORTH AMERICA BATTERY MANAGEMENT SYSTEM MARKET, BY APPLICATION, 2022-2032 ($MILLION)
- TABLE 20. NORTH AMERICA BATTERY MANAGEMENT SYSTEM MARKET, BY COUNTRY, 2022-2032 ($MILLION)
- TABLE 21. U.S. BATTERY MANAGEMENT SYSTEM MARKET, BY BATTERY TYPE, 2022-2032 ($MILLION)
- TABLE 22. U.S. BATTERY MANAGEMENT SYSTEM MARKET, BY TOPOLOGY, 2022-2032 ($MILLION)
- TABLE 23. U.S. BATTERY MANAGEMENT SYSTEM MARKET, BY APPLICATION, 2022-2032 ($MILLION)
- TABLE 24. CANADA BATTERY MANAGEMENT SYSTEM MARKET, BY BATTERY TYPE, 2022-2032 ($MILLION)
- TABLE 25. CANADA BATTERY MANAGEMENT SYSTEM MARKET, BY TOPOLOGY, 2022-2032 ($MILLION)
- TABLE 26. CANADA BATTERY MANAGEMENT SYSTEM MARKET, BY APPLICATION, 2022-2032 ($MILLION)
- TABLE 27. MEXICO BATTERY MANAGEMENT SYSTEM MARKET, BY BATTERY TYPE, 2022-2032 ($MILLION)
- TABLE 28. MEXICO BATTERY MANAGEMENT SYSTEM MARKET, BY TOPOLOGY, 2022-2032 ($MILLION)
- TABLE 29. MEXICO BATTERY MANAGEMENT SYSTEM MARKET, BY APPLICATION, 2022-2032 ($MILLION)
- TABLE 30. EUROPE BATTERY MANAGEMENT SYSTEM MARKET, BY BATTERY TYPE, 2022-2032 ($MILLION)
- TABLE 31. EUROPE BATTERY MANAGEMENT SYSTEM MARKET, BY TOPOLOGY, 2022-2032 ($MILLION)
- TABLE 32. EUROPE BATTERY MANAGEMENT SYSTEM MARKET, BY APPLICATION, 2022-2032 ($MILLION)
- TABLE 33. EUROPE BATTERY MANAGEMENT SYSTEM MARKET, BY COUNTRY, 2022-2032 ($MILLION)
- TABLE 34. UK BATTERY MANAGEMENT SYSTEM MARKET, BY BATTERY TYPE, 2022-2032 ($MILLION)
- TABLE 35. UK BATTERY MANAGEMENT SYSTEM MARKET, BY TOPOLOGY, 2022-2032 ($MILLION)
- TABLE 36. UK BATTERY MANAGEMENT SYSTEM MARKET, BY APPLICATION, 2022-2032 ($MILLION)
- TABLE 37. GERMANY BATTERY MANAGEMENT SYSTEM MARKET, BY BATTERY TYPE, 2022-2032 ($MILLION)
- TABLE 38. GERMANY BATTERY MANAGEMENT SYSTEM MARKET, BY TOPOLOGY, 2022-2032 ($MILLION)
- TABLE 39. GERMANY BATTERY MANAGEMENT SYSTEM MARKET, BY APPLICATION, 2022-2032 ($MILLION)
- TABLE 40. FRANCE BATTERY MANAGEMENT SYSTEM MARKET, BY BATTERY TYPE, 2022-2032 ($MILLION)
- TABLE 41. FRANCE BATTERY MANAGEMENT SYSTEM MARKET, BY TOPOLOGY, 2022-2032 ($MILLION)
- TABLE 42. FRANCE BATTERY MANAGEMENT SYSTEM MARKET, BY APPLICATION, 2022-2032 ($MILLION)
- TABLE 43. ITALY BATTERY MANAGEMENT SYSTEM MARKET, BY BATTERY TYPE, 2022-2032 ($MILLION)
- TABLE 44. ITALY BATTERY MANAGEMENT SYSTEM MARKET, BY TOPOLOGY, 2022-2032 ($MILLION)
- TABLE 45. ITALY BATTERY MANAGEMENT SYSTEM MARKET, BY APPLICATION, 2022-2032 ($MILLION)
- TABLE 46. REST OF EUROPE BATTERY MANAGEMENT SYSTEM MARKET, BY BATTERY TYPE, 2022-2032 ($MILLION)
- TABLE 47. REST OF EUROPE BATTERY MANAGEMENT SYSTEM MARKET, BY TOPOLOGY, 2022-2032 ($MILLION)
- TABLE 48. REST OF EUROPE BATTERY MANAGEMENT SYSTEM MARKET, BY APPLICATION, 2022-2032 ($MILLION)
- TABLE 49. ASIA-PACIFIC BATTERY MANAGEMENT SYSTEM MARKET, BY BATTERY TYPE, 2022-2032 ($MILLION)
- TABLE 50. ASIA-PACIFIC BATTERY MANAGEMENT SYSTEM MARKET, BY TOPOLOGY, 2022-2032 ($MILLION)
- TABLE 51. ASIA-PACIFIC BATTERY MANAGEMENT SYSTEM MARKET, BY APPLICATION, 2022-2032 ($MILLION)
- TABLE 52. ASIA-PACIFIC BATTERY MANAGEMENT SYSTEM MARKET, BY COUNTRY, 2022-2032 ($MILLION)
- TABLE 53. CHINA BATTERY MANAGEMENT SYSTEM MARKET, BY BATTERY TYPE, 2022-2032 ($MILLION)
- TABLE 54. CHINA BATTERY MANAGEMENT SYSTEM MARKET, BY TOPOLOGY, 2022-2032 ($MILLION)
- TABLE 55. CHINA BATTERY MANAGEMENT SYSTEM MARKET, BY APPLICATION, 2022-2032 ($MILLION)
- TABLE 56. JAPAN BATTERY MANAGEMENT SYSTEM MARKET, BY BATTERY TYPE, 2022-2032 ($MILLION)
- TABLE 57. JAPAN BATTERY MANAGEMENT SYSTEM MARKET, BY TOPOLOGY, 2022-2032 ($MILLION)
- TABLE 58. JAPAN BATTERY MANAGEMENT SYSTEM MARKET, BY APPLICATION, 2022-2032 ($MILLION)
- TABLE 59. INDIA BATTERY MANAGEMENT SYSTEM MARKET, BY BATTERY TYPE, 2022-2032 ($MILLION)
- TABLE 60. INDIA BATTERY MANAGEMENT SYSTEM MARKET, BY TOPOLOGY, 2022-2032 ($MILLION)
- TABLE 61. INDIA BATTERY MANAGEMENT SYSTEM MARKET, BY APPLICATION, 2022-2032 ($MILLION)
- TABLE 62. SOUTH KOREA BATTERY MANAGEMENT SYSTEM MARKET, BY BATTERY TYPE, 2022-2032 ($MILLION)
- TABLE 63. SOUTH KOREA BATTERY MANAGEMENT SYSTEM MARKET, BY TOPOLOGY, 2022-2032 ($MILLION)
- TABLE 64. SOUTH KOREA BATTERY MANAGEMENT SYSTEM MARKET, BY APPLICATION, 2022-2032 ($MILLION)
- TABLE 65. REST OF ASIA-PACIFIC BATTERY MANAGEMENT SYSTEM MARKET, BY BATTERY TYPE, 2022-2032 ($MILLION)
- TABLE 66. REST OF ASIA-PACIFIC BATTERY MANAGEMENT SYSTEM MARKET, BY TOPOLOGY, 2022-2032 ($MILLION)
- TABLE 67. REST OF ASIA-PACIFIC BATTERY MANAGEMENT SYSTEM MARKET, BY APPLICATION, 2022-2032 ($MILLION)
- TABLE 68. LAMEA BATTERY MANAGEMENT SYSTEM MARKET, BY BATTERY TYPE, 2022-2032 ($MILLION)
- TABLE 69. LAMEA BATTERY MANAGEMENT SYSTEM MARKET, BY TOPOLOGY, 2022-2032 ($MILLION)
- TABLE 70. LAMEA BATTERY MANAGEMENT SYSTEM MARKET, BY APPLICATION, 2022-2032 ($MILLION)
- TABLE 71. LAMEA BATTERY MANAGEMENT SYSTEM MARKET, BY COUNTRY, 2022-2032 ($MILLION)
- TABLE 72. LATIN AMERICA BATTERY MANAGEMENT SYSTEM MARKET, BY BATTERY TYPE, 2022-2032 ($MILLION)
- TABLE 73. LATIN AMERICA BATTERY MANAGEMENT SYSTEM MARKET, BY TOPOLOGY, 2022-2032 ($MILLION)
- TABLE 74. LATIN AMERICA BATTERY MANAGEMENT SYSTEM MARKET, BY APPLICATION, 2022-2032 ($MILLION)
- TABLE 75. MIDDLE EAST BATTERY MANAGEMENT SYSTEM MARKET, BY BATTERY TYPE, 2022-2032 ($MILLION)
- TABLE 76. MIDDLE EAST BATTERY MANAGEMENT SYSTEM MARKET, BY TOPOLOGY, 2022-2032 ($MILLION)
- TABLE 77. MIDDLE EAST BATTERY MANAGEMENT SYSTEM MARKET, BY APPLICATION, 2022-2032 ($MILLION)
- TABLE 78. NORTH AFRICA BATTERY MANAGEMENT SYSTEM MARKET, BY BATTERY TYPE, 2022-2032 ($MILLION)
- TABLE 79. NORTH AFRICA BATTERY MANAGEMENT SYSTEM MARKET, BY TOPOLOGY, 2022-2032 ($MILLION)
- TABLE 80. NORTH AFRICA BATTERY MANAGEMENT SYSTEM MARKET, BY APPLICATION, 2022-2032 ($MILLION)
- TABLE 81. REST OF AFRICA BATTERY MANAGEMENT SYSTEM MARKET, BY BATTERY TYPE, 2022-2032 ($MILLION)
- TABLE 82. REST OF AFRICA BATTERY MANAGEMENT SYSTEM MARKET, BY TOPOLOGY, 2022-2032 ($MILLION)
- TABLE 83. REST OF AFRICA BATTERY MANAGEMENT SYSTEM MARKET, BY APPLICATION, 2022-2032 ($MILLION)
- TABLE 84. NUVATION ENERGY: KEY EXECUTIVES
- TABLE 85. NUVATION ENERGY: COMPANY SNAPSHOT
- TABLE 86. NUVATION ENERGY: PRODUCT SEGMENTS
- TABLE 87. NUVATION ENERGY: PRODUCT PORTFOLIO
- TABLE 88. NUVATION ENERGY: KEY STRATERGIES
- TABLE 89. EXPONENTIAL POWER: KEY EXECUTIVES
- TABLE 90. EXPONENTIAL POWER: COMPANY SNAPSHOT
- TABLE 91. EXPONENTIAL POWER: PRODUCT SEGMENTS
- TABLE 92. EXPONENTIAL POWER: PRODUCT PORTFOLIO
- TABLE 93. INFINEON TECHNOLOGIES AG: KEY EXECUTIVES
- TABLE 94. INFINEON TECHNOLOGIES AG: COMPANY SNAPSHOT
- TABLE 95. INFINEON TECHNOLOGIES AG: PRODUCT SEGMENTS
- TABLE 96. INFINEON TECHNOLOGIES AG: PRODUCT PORTFOLIO
- TABLE 97. INFINEON TECHNOLOGIES AG: KEY STRATERGIES
- TABLE 98. RENESAS ELECTRONICS CORPORATION: KEY EXECUTIVES
- TABLE 99. RENESAS ELECTRONICS CORPORATION: COMPANY SNAPSHOT
- TABLE 100. RENESAS ELECTRONICS CORPORATION: PRODUCT SEGMENTS
- TABLE 101. RENESAS ELECTRONICS CORPORATION: PRODUCT PORTFOLIO
- TABLE 102. RENESAS ELECTRONICS CORPORATION: KEY STRATERGIES
- TABLE 103. SENSATA TECHNOLOGIES, INC.: KEY EXECUTIVES
- TABLE 104. SENSATA TECHNOLOGIES, INC.: COMPANY SNAPSHOT
- TABLE 105. SENSATA TECHNOLOGIES, INC.: PRODUCT SEGMENTS
- TABLE 106. SENSATA TECHNOLOGIES, INC.: PRODUCT PORTFOLIO
- TABLE 107. SENSATA TECHNOLOGIES, INC.: KEY STRATERGIES
- TABLE 108. TEXAS INSTRUMENTS INCORPORATED: KEY EXECUTIVES
- TABLE 109. TEXAS INSTRUMENTS INCORPORATED: COMPANY SNAPSHOT
- TABLE 110. TEXAS INSTRUMENTS INCORPORATED: PRODUCT SEGMENTS
- TABLE 111. TEXAS INSTRUMENTS INCORPORATED: PRODUCT PORTFOLIO
- TABLE 112. TEXAS INSTRUMENTS INCORPORATED: KEY STRATERGIES
- TABLE 113. ELITHION INC.: KEY EXECUTIVES
- TABLE 114. ELITHION INC.: COMPANY SNAPSHOT
- TABLE 115. ELITHION INC.: PRODUCT SEGMENTS
- TABLE 116. ELITHION INC.: PRODUCT PORTFOLIO
- TABLE 117. ANALOG DEVICES, INC.: KEY EXECUTIVES
- TABLE 118. ANALOG DEVICES, INC.: COMPANY SNAPSHOT
- TABLE 119. ANALOG DEVICES, INC.: PRODUCT SEGMENTS
- TABLE 120. ANALOG DEVICES, INC.: PRODUCT PORTFOLIO
- TABLE 121. ANALOG DEVICES, INC.: KEY STRATERGIES
- TABLE 122. EBERSPACHER: KEY EXECUTIVES
- TABLE 123. EBERSPACHER: COMPANY SNAPSHOT
- TABLE 124. EBERSPACHER: PRODUCT SEGMENTS
- TABLE 125. EBERSPACHER: PRODUCT PORTFOLIO
- TABLE 126. EBERSPACHER: KEY STRATERGIES
- TABLE 127. NXP SEMICONDUCTORS: KEY EXECUTIVES
- TABLE 128. NXP SEMICONDUCTORS: COMPANY SNAPSHOT
- TABLE 129. NXP SEMICONDUCTORS: PRODUCT SEGMENTS
- TABLE 130. NXP SEMICONDUCTORS: PRODUCT PORTFOLIO
- TABLE 131. NXP SEMICONDUCTORS: KEY STRATERGIES
- TABLE 132. STMICROELECTRONICS: KEY EXECUTIVES
- TABLE 133. STMICROELECTRONICS: COMPANY SNAPSHOT
- TABLE 134. STMICROELECTRONICS: PRODUCT SEGMENTS
- TABLE 135. STMICROELECTRONICS: PRODUCT PORTFOLIO
- TABLE 136. STMICROELECTRONICS: KEY STRATERGIES
- TABLE 137. LECLANCHE SA: KEY EXECUTIVES
- TABLE 138. LECLANCHE SA: COMPANY SNAPSHOT
- TABLE 139. LECLANCHE SA: PRODUCT SEGMENTS
- TABLE 140. LECLANCHE SA: PRODUCT PORTFOLIO
- TABLE 141. LECLANCHE SA: KEY STRATERGIES
LIST OF FIGURES
- FIGURE 01. BATTERY MANAGEMENT SYSTEM MARKET, 2022-2032
- FIGURE 02. SEGMENTATION OF BATTERY MANAGEMENT SYSTEM MARKET,2022-2032
- FIGURE 03. TOP IMPACTING FACTORS IN BATTERY MANAGEMENT SYSTEM MARKET (2022 TO 2032)
- FIGURE 04. TOP INVESTMENT POCKETS IN BATTERY MANAGEMENT SYSTEM MARKET (2023-2032)
- FIGURE 05. LOW BARGAINING POWER OF SUPPLIERS
- FIGURE 06. LOW THREAT OF NEW ENTRANTS
- FIGURE 07. LOW THREAT OF SUBSTITUTES
- FIGURE 08. LOW INTENSITY OF RIVALRY
- FIGURE 09. LOW BARGAINING POWER OF BUYERS
- FIGURE 10. GLOBAL BATTERY MANAGEMENT SYSTEM MARKET:DRIVERS, RESTRAINTS AND OPPORTUNITIES
- FIGURE 11. BATTERY MANAGEMENT SYSTEM MARKET, BY BATTERY TYPE, 2022 AND 2032(%)
- FIGURE 12. COMPARATIVE SHARE ANALYSIS OF BATTERY MANAGEMENT SYSTEM MARKET FOR LITHIUM-ION BASED, BY COUNTRY 2022 AND 2032(%)
- FIGURE 13. COMPARATIVE SHARE ANALYSIS OF BATTERY MANAGEMENT SYSTEM MARKET FOR LEAD-ACID BASED, BY COUNTRY 2022 AND 2032(%)
- FIGURE 14. COMPARATIVE SHARE ANALYSIS OF BATTERY MANAGEMENT SYSTEM MARKET FOR NICKEL-BASED, BY COUNTRY 2022 AND 2032(%)
- FIGURE 15. COMPARATIVE SHARE ANALYSIS OF BATTERY MANAGEMENT SYSTEM MARKET FOR OTHERS, BY COUNTRY 2022 AND 2032(%)
- FIGURE 16. BATTERY MANAGEMENT SYSTEM MARKET, BY TOPOLOGY, 2022 AND 2032(%)
- FIGURE 17. COMPARATIVE SHARE ANALYSIS OF BATTERY MANAGEMENT SYSTEM MARKET FOR CENTRALIZED, BY COUNTRY 2022 AND 2032(%)
- FIGURE 18. COMPARATIVE SHARE ANALYSIS OF BATTERY MANAGEMENT SYSTEM MARKET FOR DISTRIBUTED, BY COUNTRY 2022 AND 2032(%)
- FIGURE 19. COMPARATIVE SHARE ANALYSIS OF BATTERY MANAGEMENT SYSTEM MARKET FOR MODULAR, BY COUNTRY 2022 AND 2032(%)
- FIGURE 20. BATTERY MANAGEMENT SYSTEM MARKET, BY APPLICATION, 2022 AND 2032(%)
- FIGURE 21. COMPARATIVE SHARE ANALYSIS OF BATTERY MANAGEMENT SYSTEM MARKET FOR AUTOMOTIVE, BY COUNTRY 2022 AND 2032(%)
- FIGURE 22. COMPARATIVE SHARE ANALYSIS OF BATTERY MANAGEMENT SYSTEM MARKET FOR TELECOMMUNICATION, BY COUNTRY 2022 AND 2032(%)
- FIGURE 23. COMPARATIVE SHARE ANALYSIS OF BATTERY MANAGEMENT SYSTEM MARKET FOR CONSUMER ELECTRONICS, BY COUNTRY 2022 AND 2032(%)
- FIGURE 24. COMPARATIVE SHARE ANALYSIS OF BATTERY MANAGEMENT SYSTEM MARKET FOR INDUSTRIAL, BY COUNTRY 2022 AND 2032(%)
- FIGURE 25. COMPARATIVE SHARE ANALYSIS OF BATTERY MANAGEMENT SYSTEM MARKET FOR OTHERS, BY COUNTRY 2022 AND 2032(%)
- FIGURE 26. BATTERY MANAGEMENT SYSTEM MARKET BY REGION, 2022 AND 2032(%)
- FIGURE 27. U.S. BATTERY MANAGEMENT SYSTEM MARKET, 2022-2032 ($MILLION)
- FIGURE 28. CANADA BATTERY MANAGEMENT SYSTEM MARKET, 2022-2032 ($MILLION)
- FIGURE 29. MEXICO BATTERY MANAGEMENT SYSTEM MARKET, 2022-2032 ($MILLION)
- FIGURE 30. UK BATTERY MANAGEMENT SYSTEM MARKET, 2022-2032 ($MILLION)
- FIGURE 31. GERMANY BATTERY MANAGEMENT SYSTEM MARKET, 2022-2032 ($MILLION)
- FIGURE 32. FRANCE BATTERY MANAGEMENT SYSTEM MARKET, 2022-2032 ($MILLION)
- FIGURE 33. ITALY BATTERY MANAGEMENT SYSTEM MARKET, 2022-2032 ($MILLION)
- FIGURE 34. REST OF EUROPE BATTERY MANAGEMENT SYSTEM MARKET, 2022-2032 ($MILLION)
- FIGURE 35. CHINA BATTERY MANAGEMENT SYSTEM MARKET, 2022-2032 ($MILLION)
- FIGURE 36. JAPAN BATTERY MANAGEMENT SYSTEM MARKET, 2022-2032 ($MILLION)
- FIGURE 37. INDIA BATTERY MANAGEMENT SYSTEM MARKET, 2022-2032 ($MILLION)
- FIGURE 38. SOUTH KOREA BATTERY MANAGEMENT SYSTEM MARKET, 2022-2032 ($MILLION)
- FIGURE 39. REST OF ASIA-PACIFIC BATTERY MANAGEMENT SYSTEM MARKET, 2022-2032 ($MILLION)
- FIGURE 40. LATIN AMERICA BATTERY MANAGEMENT SYSTEM MARKET, 2022-2032 ($MILLION)
- FIGURE 41. MIDDLE EAST BATTERY MANAGEMENT SYSTEM MARKET, 2022-2032 ($MILLION)
- FIGURE 42. NORTH AFRICA BATTERY MANAGEMENT SYSTEM MARKET, 2022-2032 ($MILLION)
- FIGURE 43. REST OF AFRICA BATTERY MANAGEMENT SYSTEM MARKET, 2022-2032 ($MILLION)
- FIGURE 44. TOP WINNING STRATEGIES, BY YEAR (2020-2023)
- FIGURE 45. TOP WINNING STRATEGIES, BY DEVELOPMENT (2020-2023)
- FIGURE 46. TOP WINNING STRATEGIES, BY COMPANY (2020-2023)
- FIGURE 47. PRODUCT MAPPING OF TOP 10 PLAYERS
- FIGURE 48. COMPETITIVE DASHBOARD
- FIGURE 49. COMPETITIVE HEATMAP: BATTERY MANAGEMENT SYSTEM MARKET
- FIGURE 50. TOP PLAYER POSITIONING, 2022
- FIGURE 51. INFINEON TECHNOLOGIES AG: NET REVENUE, 2020-2022 ($MILLION)
- FIGURE 52. INFINEON TECHNOLOGIES AG: RESEARCH & DEVELOPMENT EXPENDITURE, 2020-2022 ($MILLION)
- FIGURE 53. INFINEON TECHNOLOGIES AG: REVENUE SHARE BY SEGMENT, 2022 (%)
- FIGURE 54. INFINEON TECHNOLOGIES AG: REVENUE SHARE BY REGION, 2022 (%)
- FIGURE 55. RENESAS ELECTRONICS CORPORATION: NET REVENUE, 2020-2022 ($MILLION)
- FIGURE 56. RENESAS ELECTRONICS CORPORATION: RESEARCH & DEVELOPMENT EXPENDITURE, 2020-2022 ($MILLION)
- FIGURE 57. RENESAS ELECTRONICS CORPORATION: REVENUE SHARE BY SEGMENT, 2022 (%)
- FIGURE 58. RENESAS ELECTRONICS CORPORATION: REVENUE SHARE BY REGION, 2022 (%)
- FIGURE 59. SENSATA TECHNOLOGIES, INC.: NET SALES, 2020-2022 ($MILLION)
- FIGURE 60. SENSATA TECHNOLOGIES, INC.: RESEARCH & DEVELOPMENT EXPENDITURE, 2020-2022 ($MILLION)
- FIGURE 61. SENSATA TECHNOLOGIES, INC.: REVENUE SHARE BY SEGMENT, 2022 (%)
- FIGURE 62. SENSATA TECHNOLOGIES, INC.: REVENUE SHARE BY REGION, 2022 (%)
- FIGURE 63. TEXAS INSTRUMENTS INCORPORATED: NET REVENUE, 2020-2022 ($MILLION)
- FIGURE 64. TEXAS INSTRUMENTS INCORPORATED: RESEARCH & DEVELOPMENT EXPENDITURE, 2020-2022 ($MILLION)
- FIGURE 65. TEXAS INSTRUMENTS INCORPORATED: REVENUE SHARE BY SEGMENT, 2022 (%)
- FIGURE 66. TEXAS INSTRUMENTS INCORPORATED: REVENUE SHARE BY REGION, 2022 (%)
- FIGURE 67. ANALOG DEVICES, INC.: RESEARCH & DEVELOPMENT EXPENDITURE, 2020-2022 ($MILLION)
- FIGURE 68. ANALOG DEVICES, INC.: NET SALES, 2020-2022 ($MILLION)
- FIGURE 69. ANALOG DEVICES, INC.: REVENUE SHARE BY SEGMENT, 2022 (%)
- FIGURE 70. ANALOG DEVICES, INC.: REVENUE SHARE BY REGION, 2022 (%)
- FIGURE 71. EBERSPACHER: SALES REVENUE, 2020-2022 ($MILLION)
- FIGURE 72. EBERSPACHER: RESEARCH & DEVELOPMENT EXPENDITURE, 2020-2022 ($MILLION)
- FIGURE 73. EBERSPACHER: REVENUE SHARE BY REGION, 2022 (%)
- FIGURE 74. EBERSPACHER: REVENUE SHARE BY SEGMENT, 2022 (%)
- FIGURE 75. NXP SEMICONDUCTORS: RESEARCH & DEVELOPMENT EXPENDITURE, 2020-2022 ($MILLION)
- FIGURE 76. NXP SEMICONDUCTORS: NET REVENUE, 2020-2022 ($MILLION)
- FIGURE 77. NXP SEMICONDUCTORS: REVENUE SHARE BY SEGMENT, 2022 (%)
- FIGURE 78. NXP SEMICONDUCTORS: REVENUE SHARE BY REGION, 2022 (%)
- FIGURE 79. STMICROELECTRONICS: RESEARCH & DEVELOPMENT EXPENDITURE, 2020-2022 ($MILLION)
- FIGURE 80. STMICROELECTRONICS: NET REVENUE, 2020-2022 ($MILLION)
- FIGURE 81. STMICROELECTRONICS: REVENUE SHARE BY SEGMENT, 2022 (%)
- FIGURE 82. STMICROELECTRONICS: REVENUE SHARE BY REGION, 2022 (%)
- FIGURE 83. LECLANCHE SA: NET REVENUE, 2020-2022 ($MILLION)
- FIGURE 84. LECLANCHE SA: RESEARCH & DEVELOPMENT EXPENDITURE, 2020-2022 ($MILLION)
- FIGURE 85. LECLANCHE SA: REVENUE SHARE BY SEGMENT, 2022 (%)
- FIGURE 86. LECLANCHE SA: REVENUE SHARE BY REGION, 2022 (%)
 2025年电池管理系统全球市场报告
 电池管理系统(BMS)的全球市场,产业趋势,按预测(~2035年):电池类别,各技术,拓扑学,各零件,各应用领域,各终端用户,各地区
 电池管理系统市场规模、份额、趋势分析报告:按电池类型、拓扑、应用、地区、细分市场预测,2025-2030 年
 汽车锂离子电池管理系统(BMS)市场(2025-2029)
 全球电池管理系统市场规模、份额、趋势分析报告:按拓扑、电池类型、应用、地区、展望和预测,2025-2032 年
 电池管理系统市场规模、份额、成长分析(按电池类型、拓扑、应用和地区)- 2025-2032 年产业预测
 锂离子电池技术的安全创新:2025-2030年的成长机会
 北美电池管理系统:市场占有率分析、行业趋势和统计数据、成长预测(2025-2030 年)电池管理系统-市场占有率分析、产业趋势与统计、成长预测(2025-2030 年)
 低压电池管理系统 (BMS) 市场 - 全球产业分析、规模、份额、成长、趋势及预测(2025-2035 年)