


 |
市场调查报告书
商品编码
1414917
电缆配线架市场:按类型、材料、表面处理、应用分类:2023-2032 年全球机会分析与产业预测Cable Tray Market By Type, By Material, By Finishing, By Application : Global Opportunity Analysis and Industry Forecast, 2023-2032 |
||||||
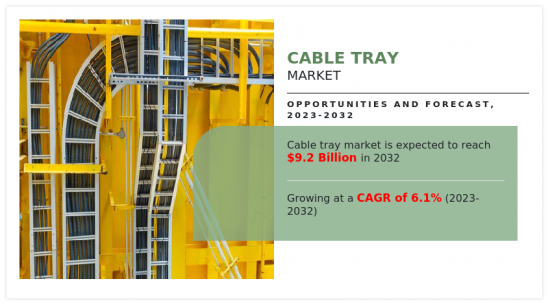
2022年电缆配线架市值为50亿美元,预计2023年至2032年复合年增长率为6.1%,到2032年将达到92亿美元。
电缆配线架是建筑和各种行业中用于支撑、保护和管理电缆和电线的结构和系统。它旨在以安全有序的方式组织和布线电缆,防止损坏、干扰或可能破坏电气系统或造成安全隐患的意外接触。确实如此。电缆桥架设计方便电缆系统的安装、维护与扩充。它还有助于通风,以散发电缆产生的热量,防止电缆缠结,并将电源线和资料线分开以最大程度地减少干扰。
考虑到气候变迁的影响,近年来出现了明显的再生能源来源趋势。世界各国正在製定法律法规,促进再生能源来源的使用,以减少碳排放。此外,离岸风力发电、沙漠太阳能发电场和其他再生能源来源通常位于难以到达的地点。在此类地形中使用这些托盘可以保护电线系统免受损坏,并减少停电和系统中断的可能性。
由于建设产业的成长、组织对安全的重视以及对可再生能源的需求不断增加,电缆桥架市场预计将显着成长,这将推动市场成长。此外,先进技术的整合预计将为预测期内的市场成长提供有利的机会。相反,高昂的安装成本正在限制电缆配线架市场的成长。
目录
第一章简介
第 2 章执行摘要
第三章市场概况
- 市场定义和范围
- 主要发现
- 影响因素
- 主要投资机会
- 波特五力分析
- 市场动态
- 促进因素
- 建设产业的成长和对组织安全的重视
- 对可再生能源的需求不断增长推动市场成长
- 抑制因素
- 安装成本高
- 机会
- 融合先进技术
- 促进因素
- 价值链分析
- 专利状况
第四章电缆配线架市场:依类型
- 概述
- 梯式电缆配线架
- 实心底部电缆配线架
- 槽式电缆配线架
- 通道电缆配线架
- 金属丝网电缆配线架
- 单轨电缆配线架
- 其他的
第五章电缆配线架市场:依材料分类
- 概述
- 铝
- 钢
- 不銹钢
- 其他的
第六章电缆配线架市场:依加工流程分类
- 概述
- 镀锌层
- 热镀锌
- 热镀锌
- 其他的
第七章电缆配线架市场:依应用分类
- 概述
- 电力
- 建造
- 製造业
- 资讯科技/通讯
- 其他的
第八章电缆配线架市场:按地区
- 概述
- 北美洲
- 美国
- 加拿大
- 墨西哥
- 欧洲
- 德国
- 英国
- 法国
- 义大利
- 西班牙
- 其他的
- 亚太地区
- 中国
- 日本
- 印度
- 韩国
- 澳洲
- 其他的
- 拉丁美洲/中东/非洲
- 巴西
- 沙乌地阿拉伯
- 南非
- 其他的
第9章 竞争形势
- 介绍
- 关键成功策略
- 10家主要企业产品图谱
- 竞争对手仪表板
- 竞争热图
- 主要企业定位:2022年
第十章 公司简介
- ABB Ltd.
- Legrand
- Eaton
- OBO Bettermann Holding GmbH & Co. KG
- Hubbell Inc.
- Atkore Inc.
- Basor Electric SA
- Niedax Group
- Chatsworth Products, Inc.
- Superfab Inc.
According to a new report published by Allied Market Research, titled, "Cable Tray Market," The cable tray market was valued at $5.0 billion in 2022, and is estimated to reach $9.2 billion by 2032, growing at a CAGR of 6.1% from 2023 to 2032.
A cable tray is a structure or system used in construction and various industries to support, protect, and manage electrical cables and wires. s It is designed to organize and route cables in a safe and organized manner, preventing damage, interference, or accidental contact that could disrupt electrical systems or pose safety hazards. The design of cable tray allows for easy installation, maintenance, and expansion of cable systems. They offer ventilation to dissipate heat generated by cables, prevent cable entanglement, and facilitate the segregation of power and data cables to minimize interference.
Given the impacts of climate change, there has been a notable movement in recent years toward renewable energy sources. Nations all around the world are enacting laws and regulations that promote the use of renewable energy sources in an effort to reduce their carbon emissions. Furthermore, offshore wind farms, desert solar plants, and other renewable energy sources are frequently installed in difficult-to-reach locations. By using these trays in these types of terrains, you may protect the wire systems from harm and reduce the likelihood of power outages and system shutdown.
The cable tray market is expected to witness notable growth owing to growth in construction industry and emphasis on safety in organizations and rising renewable energy demand to drive the market growth. Moreover, integration of advanced technologies is expected to provide lucrative opportunity for the growth of the market during the forecast period. On the contrary, high installation costs limit the growth of the cable tray market.
The cable tray market is segmented based on type, material, finishing, application, and region. By type, the market is divided into ladder type cable tray, solid bottom cable tray, trough cable tray, channel cable tray, wire mesh cable tray, single rail cable tray, and others. Based on material, the cable tray market is segmented into aluminum, steel, stainless steel, and others. Depending on finishing, galvanized coatings, pre-galvanized, hot-dip galvanized, and others. By application, the market is divided into power, construction, manufacturing, IT telecommunications, and others. Region-wise, the cable tray market is analyzed across North America, Europe, Asia-Pacific, and LAMEA.
The report offers a thorough analysis of the cable tray market with detailed study of various aspects of the market such as
1) market dynamics, vital segments, major geographies, key players, and competitive landscape. The report provides a clear picture of the current market situation and future trends of the Cable tray market based on the impact of various market dynamics and vital forces influencing the market.
The drivers and opportunities in the market contributing to market growth are acknowledged in the market dynamics. Besides, challenges and restraints that hold potential to hamper market growth are also premeditated in the cable tray market. Porter's five forces analysis is delivered through the report which precisely highlights the effects of key forces on the cable tray market. The report offers market size and estimations analyzing the cable tray market through various segments. In addition, the report includes geographical market analysis of these segments. Each segment covered in the report is studied at regional and country level as well to provide complete coverage of cable tray market. Furthermore, the report covers the competitive scenario of the cable tray market. The key players operating in the cable tray market are studied in the report to understand their current market position and competitive strengths in the industry.
The report covers strategies adopted by key players in the market to sustain the competitive environment and increase their market share. The key players operating in the Cable tray market include ABB Ltd. Atkore Inc. Basor Electric S.A, Chatsworth Products, Inc. Eaton, Hubbell Inc. Legrand, Niedax Group, OBO Bettermann Holding GmbH & Co. KG, and Superfab Inc. In addition, the market drivers, restraints, and opportunities are explained in the report.
Key Benefits For Stakeholders
- This report provides a quantitative analysis of the market segments, current trends, estimations, and dynamics of the cable tray market analysis from 2022 to 2032 to identify the prevailing cable tray market opportunities.
- The market research is offered along with information related to key drivers, restraints, and opportunities.
- Porter's five forces analysis highlights the potency of buyers and suppliers to enable stakeholders make profit-oriented business decisions and strengthen their supplier-buyer network.
- In-depth analysis of the cable tray market segmentation assists to determine the prevailing market opportunities.
- Major countries in each region are mapped according to their revenue contribution to the global market.
- Market player positioning facilitates benchmarking and provides a clear understanding of the present position of the market players.
- The report includes the analysis of the regional as well as global cable tray market trends, key players, market segments, application areas, and market growth strategies.
Additional benefits you will get with this purchase are:
- Quarterly Update and* (only available with a corporate license, on listed price)
- 5 additional Company Profile of client Choice pre- or Post-purchase, as a free update.
- Free Upcoming Version on the Purchase of Five and Enterprise User License.
- 16 analyst hours of support* (post-purchase, if you find additional data requirements upon review of the report, you may receive support amounting to 16 analyst hours to solve questions, and post-sale queries)
- 15% Free Customization* (in case the scope or segment of the report does not match your requirements, 15% is equivalent to 3 working days of free work, applicable once)
- Free data Pack on the Five and Enterprise User License. (Excel version of the report)
- Free Updated report if the report is 6-12 months old or older.
- 24-hour priority response*
- Free Industry updates and white papers.
Possible Customization with this report (with additional cost and timeline, please talk to the sales executive to know more)
- Additional company profiles with specific to client's interest
- Additional country or region analysis- market size and forecast
- Expanded list for Company Profiles
- Historic market data
- Key player details (including location, contact details, supplier/vendor network etc. in excel format)
- List of customers/consumers/raw material suppliers- value chain analysis
- SWOT Analysis
Key Market Segments
By Type
- Ladder Type Cable Trays
- Solid Bottom Cable Trays
- Trough Cable Trays
- Channel Cable Trays
- Wire Mesh Cable Trays
- Single Rail Cable Trays
- Others
By Material
- Aluminum
- Steel
- Stainless Steel
- Others
By Finishing
- Galvanized Coatings
- Pre-galvanized
- Hot-dip Galvanized
- Others
By Application
- Power
- Construction
- Manufacturing
- IT and Telecommunication
- Others
By Region
- North America
- U.S.
- Canada
- Mexico
- Europe
- Germany
- UK
- France
- Italy
- Spain
- Rest of Europe
- Asia-Pacific
- China
- Japan
- India
- South Korea
- Australia
- Rest of Asia-Pacific
- LAMEA
- Brazil
- Saudi Arabia
- South Africa
- Rest of LAMEA
Key Market Players:
- Hubbell Inc.
- Chatsworth Products, Inc.
- Basor Electric S.A
- Niedax Group
- Superfab Inc.
- ABB Ltd.
- Legrand
- Eaton
- Atkore Inc.
- OBO Bettermann Holding GmbH & Co. KG
TABLE OF CONTENTS
CHAPTER 1: INTRODUCTION
- 1.1. Report description
- 1.2. Key market segments
- 1.3. Key benefits to the stakeholders
- 1.4. Research methodology
- 1.4.1. Primary research
- 1.4.2. Secondary research
- 1.4.3. Analyst tools and models
CHAPTER 2: EXECUTIVE SUMMARY
- 2.1. CXO Perspective
CHAPTER 3: MARKET OVERVIEW
- 3.1. Market definition and scope
- 3.2. Key findings
- 3.2.1. Top impacting factors
- 3.2.2. Top investment pockets
- 3.3. Porter's five forces analysis
- 3.3.1. Low bargaining power of suppliers
- 3.3.2. Low threat of new entrants
- 3.3.3. Low threat of substitutes
- 3.3.4. Low intensity of rivalry
- 3.3.5. Low bargaining power of buyers
- 3.4. Market dynamics
- 3.4.1. Drivers
- 3.4.1.1. Growth in construction industry and emphasis on safety in organizations
- 3.4.1.2. Rising Renewable Energy Demand to Drive the Market Growth
- 3.4.2. Restraints
- 3.4.2.1. High Installation Costs
- 3.4.3. Opportunities
- 3.4.3.1. Integration of Advanced Technologies
- 3.4.1. Drivers
- 3.5. Value Chain Analysis
- 3.6. Patent Landscape
CHAPTER 4: CABLE TRAY MARKET, BY TYPE
- 4.1. Overview
- 4.1.1. Market size and forecast
- 4.2. Ladder Type Cable Trays
- 4.2.1. Key market trends, growth factors and opportunities
- 4.2.2. Market size and forecast, by region
- 4.2.3. Market share analysis by country
- 4.3. Solid Bottom Cable Trays
- 4.3.1. Key market trends, growth factors and opportunities
- 4.3.2. Market size and forecast, by region
- 4.3.3. Market share analysis by country
- 4.4. Trough Cable Trays
- 4.4.1. Key market trends, growth factors and opportunities
- 4.4.2. Market size and forecast, by region
- 4.4.3. Market share analysis by country
- 4.5. Channel Cable Trays
- 4.5.1. Key market trends, growth factors and opportunities
- 4.5.2. Market size and forecast, by region
- 4.5.3. Market share analysis by country
- 4.6. Wire Mesh Cable Trays
- 4.6.1. Key market trends, growth factors and opportunities
- 4.6.2. Market size and forecast, by region
- 4.6.3. Market share analysis by country
- 4.7. Single Rail Cable Trays
- 4.7.1. Key market trends, growth factors and opportunities
- 4.7.2. Market size and forecast, by region
- 4.7.3. Market share analysis by country
- 4.8. Others
- 4.8.1. Key market trends, growth factors and opportunities
- 4.8.2. Market size and forecast, by region
- 4.8.3. Market share analysis by country
CHAPTER 5: CABLE TRAY MARKET, BY MATERIAL
- 5.1. Overview
- 5.1.1. Market size and forecast
- 5.2. Aluminum
- 5.2.1. Key market trends, growth factors and opportunities
- 5.2.2. Market size and forecast, by region
- 5.2.3. Market share analysis by country
- 5.3. Steel
- 5.3.1. Key market trends, growth factors and opportunities
- 5.3.2. Market size and forecast, by region
- 5.3.3. Market share analysis by country
- 5.4. Stainless Steel
- 5.4.1. Key market trends, growth factors and opportunities
- 5.4.2. Market size and forecast, by region
- 5.4.3. Market share analysis by country
- 5.5. Others
- 5.5.1. Key market trends, growth factors and opportunities
- 5.5.2. Market size and forecast, by region
- 5.5.3. Market share analysis by country
CHAPTER 6: CABLE TRAY MARKET, BY FINISHING
- 6.1. Overview
- 6.1.1. Market size and forecast
- 6.2. Galvanized Coatings
- 6.2.1. Key market trends, growth factors and opportunities
- 6.2.2. Market size and forecast, by region
- 6.2.3. Market share analysis by country
- 6.3. Pre-galvanized
- 6.3.1. Key market trends, growth factors and opportunities
- 6.3.2. Market size and forecast, by region
- 6.3.3. Market share analysis by country
- 6.4. Hot-dip Galvanized
- 6.4.1. Key market trends, growth factors and opportunities
- 6.4.2. Market size and forecast, by region
- 6.4.3. Market share analysis by country
- 6.5. Others
- 6.5.1. Key market trends, growth factors and opportunities
- 6.5.2. Market size and forecast, by region
- 6.5.3. Market share analysis by country
CHAPTER 7: CABLE TRAY MARKET, BY APPLICATION
- 7.1. Overview
- 7.1.1. Market size and forecast
- 7.2. Power
- 7.2.1. Key market trends, growth factors and opportunities
- 7.2.2. Market size and forecast, by region
- 7.2.3. Market share analysis by country
- 7.3. Construction
- 7.3.1. Key market trends, growth factors and opportunities
- 7.3.2. Market size and forecast, by region
- 7.3.3. Market share analysis by country
- 7.4. Manufacturing
- 7.4.1. Key market trends, growth factors and opportunities
- 7.4.2. Market size and forecast, by region
- 7.4.3. Market share analysis by country
- 7.5. IT and Telecommunication
- 7.5.1. Key market trends, growth factors and opportunities
- 7.5.2. Market size and forecast, by region
- 7.5.3. Market share analysis by country
- 7.6. Others
- 7.6.1. Key market trends, growth factors and opportunities
- 7.6.2. Market size and forecast, by region
- 7.6.3. Market share analysis by country
CHAPTER 8: CABLE TRAY MARKET, BY REGION
- 8.1. Overview
- 8.1.1. Market size and forecast By Region
- 8.2. North America
- 8.2.1. Key market trends, growth factors and opportunities
- 8.2.2. Market size and forecast, by Type
- 8.2.3. Market size and forecast, by Material
- 8.2.4. Market size and forecast, by Finishing
- 8.2.5. Market size and forecast, by Application
- 8.2.6. Market size and forecast, by country
- 8.2.6.1. U.S.
- 8.2.6.1.1. Market size and forecast, by Type
- 8.2.6.1.2. Market size and forecast, by Material
- 8.2.6.1.3. Market size and forecast, by Finishing
- 8.2.6.1.4. Market size and forecast, by Application
- 8.2.6.2. Canada
- 8.2.6.2.1. Market size and forecast, by Type
- 8.2.6.2.2. Market size and forecast, by Material
- 8.2.6.2.3. Market size and forecast, by Finishing
- 8.2.6.2.4. Market size and forecast, by Application
- 8.2.6.3. Mexico
- 8.2.6.3.1. Market size and forecast, by Type
- 8.2.6.3.2. Market size and forecast, by Material
- 8.2.6.3.3. Market size and forecast, by Finishing
- 8.2.6.3.4. Market size and forecast, by Application
- 8.3. Europe
- 8.3.1. Key market trends, growth factors and opportunities
- 8.3.2. Market size and forecast, by Type
- 8.3.3. Market size and forecast, by Material
- 8.3.4. Market size and forecast, by Finishing
- 8.3.5. Market size and forecast, by Application
- 8.3.6. Market size and forecast, by country
- 8.3.6.1. Germany
- 8.3.6.1.1. Market size and forecast, by Type
- 8.3.6.1.2. Market size and forecast, by Material
- 8.3.6.1.3. Market size and forecast, by Finishing
- 8.3.6.1.4. Market size and forecast, by Application
- 8.3.6.2. UK
- 8.3.6.2.1. Market size and forecast, by Type
- 8.3.6.2.2. Market size and forecast, by Material
- 8.3.6.2.3. Market size and forecast, by Finishing
- 8.3.6.2.4. Market size and forecast, by Application
- 8.3.6.3. France
- 8.3.6.3.1. Market size and forecast, by Type
- 8.3.6.3.2. Market size and forecast, by Material
- 8.3.6.3.3. Market size and forecast, by Finishing
- 8.3.6.3.4. Market size and forecast, by Application
- 8.3.6.4. Italy
- 8.3.6.4.1. Market size and forecast, by Type
- 8.3.6.4.2. Market size and forecast, by Material
- 8.3.6.4.3. Market size and forecast, by Finishing
- 8.3.6.4.4. Market size and forecast, by Application
- 8.3.6.5. Spain
- 8.3.6.5.1. Market size and forecast, by Type
- 8.3.6.5.2. Market size and forecast, by Material
- 8.3.6.5.3. Market size and forecast, by Finishing
- 8.3.6.5.4. Market size and forecast, by Application
- 8.3.6.6. Rest of Europe
- 8.3.6.6.1. Market size and forecast, by Type
- 8.3.6.6.2. Market size and forecast, by Material
- 8.3.6.6.3. Market size and forecast, by Finishing
- 8.3.6.6.4. Market size and forecast, by Application
- 8.4. Asia-Pacific
- 8.4.1. Key market trends, growth factors and opportunities
- 8.4.2. Market size and forecast, by Type
- 8.4.3. Market size and forecast, by Material
- 8.4.4. Market size and forecast, by Finishing
- 8.4.5. Market size and forecast, by Application
- 8.4.6. Market size and forecast, by country
- 8.4.6.1. China
- 8.4.6.1.1. Market size and forecast, by Type
- 8.4.6.1.2. Market size and forecast, by Material
- 8.4.6.1.3. Market size and forecast, by Finishing
- 8.4.6.1.4. Market size and forecast, by Application
- 8.4.6.2. Japan
- 8.4.6.2.1. Market size and forecast, by Type
- 8.4.6.2.2. Market size and forecast, by Material
- 8.4.6.2.3. Market size and forecast, by Finishing
- 8.4.6.2.4. Market size and forecast, by Application
- 8.4.6.3. India
- 8.4.6.3.1. Market size and forecast, by Type
- 8.4.6.3.2. Market size and forecast, by Material
- 8.4.6.3.3. Market size and forecast, by Finishing
- 8.4.6.3.4. Market size and forecast, by Application
- 8.4.6.4. South Korea
- 8.4.6.4.1. Market size and forecast, by Type
- 8.4.6.4.2. Market size and forecast, by Material
- 8.4.6.4.3. Market size and forecast, by Finishing
- 8.4.6.4.4. Market size and forecast, by Application
- 8.4.6.5. Australia
- 8.4.6.5.1. Market size and forecast, by Type
- 8.4.6.5.2. Market size and forecast, by Material
- 8.4.6.5.3. Market size and forecast, by Finishing
- 8.4.6.5.4. Market size and forecast, by Application
- 8.4.6.6. Rest of Asia-Pacific
- 8.4.6.6.1. Market size and forecast, by Type
- 8.4.6.6.2. Market size and forecast, by Material
- 8.4.6.6.3. Market size and forecast, by Finishing
- 8.4.6.6.4. Market size and forecast, by Application
- 8.5. LAMEA
- 8.5.1. Key market trends, growth factors and opportunities
- 8.5.2. Market size and forecast, by Type
- 8.5.3. Market size and forecast, by Material
- 8.5.4. Market size and forecast, by Finishing
- 8.5.5. Market size and forecast, by Application
- 8.5.6. Market size and forecast, by country
- 8.5.6.1. Brazil
- 8.5.6.1.1. Market size and forecast, by Type
- 8.5.6.1.2. Market size and forecast, by Material
- 8.5.6.1.3. Market size and forecast, by Finishing
- 8.5.6.1.4. Market size and forecast, by Application
- 8.5.6.2. Saudi Arabia
- 8.5.6.2.1. Market size and forecast, by Type
- 8.5.6.2.2. Market size and forecast, by Material
- 8.5.6.2.3. Market size and forecast, by Finishing
- 8.5.6.2.4. Market size and forecast, by Application
- 8.5.6.3. South Africa
- 8.5.6.3.1. Market size and forecast, by Type
- 8.5.6.3.2. Market size and forecast, by Material
- 8.5.6.3.3. Market size and forecast, by Finishing
- 8.5.6.3.4. Market size and forecast, by Application
- 8.5.6.4. Rest of LAMEA
- 8.5.6.4.1. Market size and forecast, by Type
- 8.5.6.4.2. Market size and forecast, by Material
- 8.5.6.4.3. Market size and forecast, by Finishing
- 8.5.6.4.4. Market size and forecast, by Application
CHAPTER 9: COMPETITIVE LANDSCAPE
- 9.1. Introduction
- 9.2. Top winning strategies
- 9.3. Product mapping of top 10 player
- 9.4. Competitive dashboard
- 9.5. Competitive heatmap
- 9.6. Top player positioning, 2022
CHAPTER 10: COMPANY PROFILES
- 10.1. ABB Ltd.
- 10.1.1. Company overview
- 10.1.2. Key executives
- 10.1.3. Company snapshot
- 10.1.4. Operating business segments
- 10.1.5. Product portfolio
- 10.1.6. Business performance
- 10.2. Legrand
- 10.2.1. Company overview
- 10.2.2. Key executives
- 10.2.3. Company snapshot
- 10.2.4. Operating business segments
- 10.2.5. Product portfolio
- 10.2.6. Key strategic moves and developments
- 10.3. Eaton
- 10.3.1. Company overview
- 10.3.2. Key executives
- 10.3.3. Company snapshot
- 10.3.4. Operating business segments
- 10.3.5. Product portfolio
- 10.3.6. Business performance
- 10.4. OBO Bettermann Holding GmbH & Co. KG
- 10.4.1. Company overview
- 10.4.2. Key executives
- 10.4.3. Company snapshot
- 10.4.4. Operating business segments
- 10.4.5. Product portfolio
- 10.5. Hubbell Inc.
- 10.5.1. Company overview
- 10.5.2. Key executives
- 10.5.3. Company snapshot
- 10.5.4. Operating business segments
- 10.5.5. Product portfolio
- 10.5.6. Business performance
- 10.6. Atkore Inc.
- 10.6.1. Company overview
- 10.6.2. Key executives
- 10.6.3. Company snapshot
- 10.6.4. Operating business segments
- 10.6.5. Product portfolio
- 10.6.6. Business performance
- 10.7. Basor Electric S.A
- 10.7.1. Company overview
- 10.7.2. Key executives
- 10.7.3. Company snapshot
- 10.7.4. Operating business segments
- 10.7.5. Product portfolio
- 10.8. Niedax Group
- 10.8.1. Company overview
- 10.8.2. Key executives
- 10.8.3. Company snapshot
- 10.8.4. Operating business segments
- 10.8.5. Product portfolio
- 10.8.6. Key strategic moves and developments
- 10.9. Chatsworth Products, Inc.
- 10.9.1. Company overview
- 10.9.2. Key executives
- 10.9.3. Company snapshot
- 10.9.4. Operating business segments
- 10.9.5. Product portfolio
- 10.9.6. Key strategic moves and developments
- 10.10. Superfab Inc.
- 10.10.1. Company overview
- 10.10.2. Key executives
- 10.10.3. Company snapshot
- 10.10.4. Operating business segments
- 10.10.5. Product portfolio
LIST OF TABLES
- TABLE 01. GLOBAL CABLE TRAY MARKET, BY TYPE, 2022-2032 ($MILLION)
- TABLE 02. CABLE TRAY MARKET FOR LADDER TYPE CABLE TRAYS, BY REGION, 2022-2032 ($MILLION)
- TABLE 03. CABLE TRAY MARKET FOR SOLID BOTTOM CABLE TRAYS, BY REGION, 2022-2032 ($MILLION)
- TABLE 04. CABLE TRAY MARKET FOR TROUGH CABLE TRAYS, BY REGION, 2022-2032 ($MILLION)
- TABLE 05. CABLE TRAY MARKET FOR CHANNEL CABLE TRAYS, BY REGION, 2022-2032 ($MILLION)
- TABLE 06. CABLE TRAY MARKET FOR WIRE MESH CABLE TRAYS, BY REGION, 2022-2032 ($MILLION)
- TABLE 07. CABLE TRAY MARKET FOR SINGLE RAIL CABLE TRAYS, BY REGION, 2022-2032 ($MILLION)
- TABLE 08. CABLE TRAY MARKET FOR OTHERS, BY REGION, 2022-2032 ($MILLION)
- TABLE 09. GLOBAL CABLE TRAY MARKET, BY MATERIAL, 2022-2032 ($MILLION)
- TABLE 10. CABLE TRAY MARKET FOR ALUMINUM, BY REGION, 2022-2032 ($MILLION)
- TABLE 11. CABLE TRAY MARKET FOR STEEL, BY REGION, 2022-2032 ($MILLION)
- TABLE 12. CABLE TRAY MARKET FOR STAINLESS STEEL, BY REGION, 2022-2032 ($MILLION)
- TABLE 13. CABLE TRAY MARKET FOR OTHERS, BY REGION, 2022-2032 ($MILLION)
- TABLE 14. GLOBAL CABLE TRAY MARKET, BY FINISHING, 2022-2032 ($MILLION)
- TABLE 15. CABLE TRAY MARKET FOR GALVANIZED COATINGS, BY REGION, 2022-2032 ($MILLION)
- TABLE 16. CABLE TRAY MARKET FOR PRE-GALVANIZED, BY REGION, 2022-2032 ($MILLION)
- TABLE 17. CABLE TRAY MARKET FOR HOT-DIP GALVANIZED, BY REGION, 2022-2032 ($MILLION)
- TABLE 18. CABLE TRAY MARKET FOR OTHERS, BY REGION, 2022-2032 ($MILLION)
- TABLE 19. GLOBAL CABLE TRAY MARKET, BY APPLICATION, 2022-2032 ($MILLION)
- TABLE 20. CABLE TRAY MARKET FOR POWER, BY REGION, 2022-2032 ($MILLION)
- TABLE 21. CABLE TRAY MARKET FOR CONSTRUCTION, BY REGION, 2022-2032 ($MILLION)
- TABLE 22. CABLE TRAY MARKET FOR MANUFACTURING, BY REGION, 2022-2032 ($MILLION)
- TABLE 23. CABLE TRAY MARKET FOR IT AND TELECOMMUNICATION, BY REGION, 2022-2032 ($MILLION)
- TABLE 24. CABLE TRAY MARKET FOR OTHERS, BY REGION, 2022-2032 ($MILLION)
- TABLE 25. CABLE TRAY MARKET, BY REGION, 2022-2032 ($MILLION)
- TABLE 26. NORTH AMERICA CABLE TRAY MARKET, BY TYPE, 2022-2032 ($MILLION)
- TABLE 27. NORTH AMERICA CABLE TRAY MARKET, BY MATERIAL, 2022-2032 ($MILLION)
- TABLE 28. NORTH AMERICA CABLE TRAY MARKET, BY FINISHING, 2022-2032 ($MILLION)
- TABLE 29. NORTH AMERICA CABLE TRAY MARKET, BY APPLICATION, 2022-2032 ($MILLION)
- TABLE 30. NORTH AMERICA CABLE TRAY MARKET, BY COUNTRY, 2022-2032 ($MILLION)
- TABLE 31. U.S. CABLE TRAY MARKET, BY TYPE, 2022-2032 ($MILLION)
- TABLE 32. U.S. CABLE TRAY MARKET, BY MATERIAL, 2022-2032 ($MILLION)
- TABLE 33. U.S. CABLE TRAY MARKET, BY FINISHING, 2022-2032 ($MILLION)
- TABLE 34. U.S. CABLE TRAY MARKET, BY APPLICATION, 2022-2032 ($MILLION)
- TABLE 35. CANADA CABLE TRAY MARKET, BY TYPE, 2022-2032 ($MILLION)
- TABLE 36. CANADA CABLE TRAY MARKET, BY MATERIAL, 2022-2032 ($MILLION)
- TABLE 37. CANADA CABLE TRAY MARKET, BY FINISHING, 2022-2032 ($MILLION)
- TABLE 38. CANADA CABLE TRAY MARKET, BY APPLICATION, 2022-2032 ($MILLION)
- TABLE 39. MEXICO CABLE TRAY MARKET, BY TYPE, 2022-2032 ($MILLION)
- TABLE 40. MEXICO CABLE TRAY MARKET, BY MATERIAL, 2022-2032 ($MILLION)
- TABLE 41. MEXICO CABLE TRAY MARKET, BY FINISHING, 2022-2032 ($MILLION)
- TABLE 42. MEXICO CABLE TRAY MARKET, BY APPLICATION, 2022-2032 ($MILLION)
- TABLE 43. EUROPE CABLE TRAY MARKET, BY TYPE, 2022-2032 ($MILLION)
- TABLE 44. EUROPE CABLE TRAY MARKET, BY MATERIAL, 2022-2032 ($MILLION)
- TABLE 45. EUROPE CABLE TRAY MARKET, BY FINISHING, 2022-2032 ($MILLION)
- TABLE 46. EUROPE CABLE TRAY MARKET, BY APPLICATION, 2022-2032 ($MILLION)
- TABLE 47. EUROPE CABLE TRAY MARKET, BY COUNTRY, 2022-2032 ($MILLION)
- TABLE 48. GERMANY CABLE TRAY MARKET, BY TYPE, 2022-2032 ($MILLION)
- TABLE 49. GERMANY CABLE TRAY MARKET, BY MATERIAL, 2022-2032 ($MILLION)
- TABLE 50. GERMANY CABLE TRAY MARKET, BY FINISHING, 2022-2032 ($MILLION)
- TABLE 51. GERMANY CABLE TRAY MARKET, BY APPLICATION, 2022-2032 ($MILLION)
- TABLE 52. UK CABLE TRAY MARKET, BY TYPE, 2022-2032 ($MILLION)
- TABLE 53. UK CABLE TRAY MARKET, BY MATERIAL, 2022-2032 ($MILLION)
- TABLE 54. UK CABLE TRAY MARKET, BY FINISHING, 2022-2032 ($MILLION)
- TABLE 55. UK CABLE TRAY MARKET, BY APPLICATION, 2022-2032 ($MILLION)
- TABLE 56. FRANCE CABLE TRAY MARKET, BY TYPE, 2022-2032 ($MILLION)
- TABLE 57. FRANCE CABLE TRAY MARKET, BY MATERIAL, 2022-2032 ($MILLION)
- TABLE 58. FRANCE CABLE TRAY MARKET, BY FINISHING, 2022-2032 ($MILLION)
- TABLE 59. FRANCE CABLE TRAY MARKET, BY APPLICATION, 2022-2032 ($MILLION)
- TABLE 60. ITALY CABLE TRAY MARKET, BY TYPE, 2022-2032 ($MILLION)
- TABLE 61. ITALY CABLE TRAY MARKET, BY MATERIAL, 2022-2032 ($MILLION)
- TABLE 62. ITALY CABLE TRAY MARKET, BY FINISHING, 2022-2032 ($MILLION)
- TABLE 63. ITALY CABLE TRAY MARKET, BY APPLICATION, 2022-2032 ($MILLION)
- TABLE 64. SPAIN CABLE TRAY MARKET, BY TYPE, 2022-2032 ($MILLION)
- TABLE 65. SPAIN CABLE TRAY MARKET, BY MATERIAL, 2022-2032 ($MILLION)
- TABLE 66. SPAIN CABLE TRAY MARKET, BY FINISHING, 2022-2032 ($MILLION)
- TABLE 67. SPAIN CABLE TRAY MARKET, BY APPLICATION, 2022-2032 ($MILLION)
- TABLE 68. REST OF EUROPE CABLE TRAY MARKET, BY TYPE, 2022-2032 ($MILLION)
- TABLE 69. REST OF EUROPE CABLE TRAY MARKET, BY MATERIAL, 2022-2032 ($MILLION)
- TABLE 70. REST OF EUROPE CABLE TRAY MARKET, BY FINISHING, 2022-2032 ($MILLION)
- TABLE 71. REST OF EUROPE CABLE TRAY MARKET, BY APPLICATION, 2022-2032 ($MILLION)
- TABLE 72. ASIA-PACIFIC CABLE TRAY MARKET, BY TYPE, 2022-2032 ($MILLION)
- TABLE 73. ASIA-PACIFIC CABLE TRAY MARKET, BY MATERIAL, 2022-2032 ($MILLION)
- TABLE 74. ASIA-PACIFIC CABLE TRAY MARKET, BY FINISHING, 2022-2032 ($MILLION)
- TABLE 75. ASIA-PACIFIC CABLE TRAY MARKET, BY APPLICATION, 2022-2032 ($MILLION)
- TABLE 76. ASIA-PACIFIC CABLE TRAY MARKET, BY COUNTRY, 2022-2032 ($MILLION)
- TABLE 77. CHINA CABLE TRAY MARKET, BY TYPE, 2022-2032 ($MILLION)
- TABLE 78. CHINA CABLE TRAY MARKET, BY MATERIAL, 2022-2032 ($MILLION)
- TABLE 79. CHINA CABLE TRAY MARKET, BY FINISHING, 2022-2032 ($MILLION)
- TABLE 80. CHINA CABLE TRAY MARKET, BY APPLICATION, 2022-2032 ($MILLION)
- TABLE 81. JAPAN CABLE TRAY MARKET, BY TYPE, 2022-2032 ($MILLION)
- TABLE 82. JAPAN CABLE TRAY MARKET, BY MATERIAL, 2022-2032 ($MILLION)
- TABLE 83. JAPAN CABLE TRAY MARKET, BY FINISHING, 2022-2032 ($MILLION)
- TABLE 84. JAPAN CABLE TRAY MARKET, BY APPLICATION, 2022-2032 ($MILLION)
- TABLE 85. INDIA CABLE TRAY MARKET, BY TYPE, 2022-2032 ($MILLION)
- TABLE 86. INDIA CABLE TRAY MARKET, BY MATERIAL, 2022-2032 ($MILLION)
- TABLE 87. INDIA CABLE TRAY MARKET, BY FINISHING, 2022-2032 ($MILLION)
- TABLE 88. INDIA CABLE TRAY MARKET, BY APPLICATION, 2022-2032 ($MILLION)
- TABLE 89. SOUTH KOREA CABLE TRAY MARKET, BY TYPE, 2022-2032 ($MILLION)
- TABLE 90. SOUTH KOREA CABLE TRAY MARKET, BY MATERIAL, 2022-2032 ($MILLION)
- TABLE 91. SOUTH KOREA CABLE TRAY MARKET, BY FINISHING, 2022-2032 ($MILLION)
- TABLE 92. SOUTH KOREA CABLE TRAY MARKET, BY APPLICATION, 2022-2032 ($MILLION)
- TABLE 93. AUSTRALIA CABLE TRAY MARKET, BY TYPE, 2022-2032 ($MILLION)
- TABLE 94. AUSTRALIA CABLE TRAY MARKET, BY MATERIAL, 2022-2032 ($MILLION)
- TABLE 95. AUSTRALIA CABLE TRAY MARKET, BY FINISHING, 2022-2032 ($MILLION)
- TABLE 96. AUSTRALIA CABLE TRAY MARKET, BY APPLICATION, 2022-2032 ($MILLION)
- TABLE 97. REST OF ASIA-PACIFIC CABLE TRAY MARKET, BY TYPE, 2022-2032 ($MILLION)
- TABLE 98. REST OF ASIA-PACIFIC CABLE TRAY MARKET, BY MATERIAL, 2022-2032 ($MILLION)
- TABLE 99. REST OF ASIA-PACIFIC CABLE TRAY MARKET, BY FINISHING, 2022-2032 ($MILLION)
- TABLE 100. REST OF ASIA-PACIFIC CABLE TRAY MARKET, BY APPLICATION, 2022-2032 ($MILLION)
- TABLE 101. LAMEA CABLE TRAY MARKET, BY TYPE, 2022-2032 ($MILLION)
- TABLE 102. LAMEA CABLE TRAY MARKET, BY MATERIAL, 2022-2032 ($MILLION)
- TABLE 103. LAMEA CABLE TRAY MARKET, BY FINISHING, 2022-2032 ($MILLION)
- TABLE 104. LAMEA CABLE TRAY MARKET, BY APPLICATION, 2022-2032 ($MILLION)
- TABLE 105. LAMEA CABLE TRAY MARKET, BY COUNTRY, 2022-2032 ($MILLION)
- TABLE 106. BRAZIL CABLE TRAY MARKET, BY TYPE, 2022-2032 ($MILLION)
- TABLE 107. BRAZIL CABLE TRAY MARKET, BY MATERIAL, 2022-2032 ($MILLION)
- TABLE 108. BRAZIL CABLE TRAY MARKET, BY FINISHING, 2022-2032 ($MILLION)
- TABLE 109. BRAZIL CABLE TRAY MARKET, BY APPLICATION, 2022-2032 ($MILLION)
- TABLE 110. SAUDI ARABIA CABLE TRAY MARKET, BY TYPE, 2022-2032 ($MILLION)
- TABLE 111. SAUDI ARABIA CABLE TRAY MARKET, BY MATERIAL, 2022-2032 ($MILLION)
- TABLE 112. SAUDI ARABIA CABLE TRAY MARKET, BY FINISHING, 2022-2032 ($MILLION)
- TABLE 113. SAUDI ARABIA CABLE TRAY MARKET, BY APPLICATION, 2022-2032 ($MILLION)
- TABLE 114. SOUTH AFRICA CABLE TRAY MARKET, BY TYPE, 2022-2032 ($MILLION)
- TABLE 115. SOUTH AFRICA CABLE TRAY MARKET, BY MATERIAL, 2022-2032 ($MILLION)
- TABLE 116. SOUTH AFRICA CABLE TRAY MARKET, BY FINISHING, 2022-2032 ($MILLION)
- TABLE 117. SOUTH AFRICA CABLE TRAY MARKET, BY APPLICATION, 2022-2032 ($MILLION)
- TABLE 118. REST OF LAMEA CABLE TRAY MARKET, BY TYPE, 2022-2032 ($MILLION)
- TABLE 119. REST OF LAMEA CABLE TRAY MARKET, BY MATERIAL, 2022-2032 ($MILLION)
- TABLE 120. REST OF LAMEA CABLE TRAY MARKET, BY FINISHING, 2022-2032 ($MILLION)
- TABLE 121. REST OF LAMEA CABLE TRAY MARKET, BY APPLICATION, 2022-2032 ($MILLION)
- TABLE 122. ABB LTD.: KEY EXECUTIVES
- TABLE 123. ABB LTD.: COMPANY SNAPSHOT
- TABLE 124. ABB LTD.: SERVICE SEGMENTS
- TABLE 125. ABB LTD.: PRODUCT PORTFOLIO
- TABLE 126. LEGRAND: KEY EXECUTIVES
- TABLE 127. LEGRAND: COMPANY SNAPSHOT
- TABLE 128. LEGRAND: PRODUCT SEGMENTS
- TABLE 129. LEGRAND: PRODUCT PORTFOLIO
- TABLE 130. LEGRAND: KEY STRATERGIES
- TABLE 131. EATON: KEY EXECUTIVES
- TABLE 132. EATON: COMPANY SNAPSHOT
- TABLE 133. EATON: PRODUCT SEGMENTS
- TABLE 134. EATON: PRODUCT PORTFOLIO
- TABLE 135. OBO BETTERMANN HOLDING GMBH & CO. KG: KEY EXECUTIVES
- TABLE 136. OBO BETTERMANN HOLDING GMBH & CO. KG: COMPANY SNAPSHOT
- TABLE 137. OBO BETTERMANN HOLDING GMBH & CO. KG: PRODUCT SEGMENTS
- TABLE 138. OBO BETTERMANN HOLDING GMBH & CO. KG: PRODUCT PORTFOLIO
- TABLE 139. HUBBELL INC.: KEY EXECUTIVES
- TABLE 140. HUBBELL INC.: COMPANY SNAPSHOT
- TABLE 141. HUBBELL INC.: PRODUCT SEGMENTS
- TABLE 142. HUBBELL INC.: PRODUCT PORTFOLIO
- TABLE 143. ATKORE INC.: KEY EXECUTIVES
- TABLE 144. ATKORE INC.: COMPANY SNAPSHOT
- TABLE 145. ATKORE INC.: SERVICE SEGMENTS
- TABLE 146. ATKORE INC.: PRODUCT PORTFOLIO
- TABLE 147. BASOR ELECTRIC S.A: KEY EXECUTIVES
- TABLE 148. BASOR ELECTRIC S.A: COMPANY SNAPSHOT
- TABLE 149. BASOR ELECTRIC S.A: PRODUCT SEGMENTS
- TABLE 150. BASOR ELECTRIC S.A: PRODUCT PORTFOLIO
- TABLE 151. NIEDAX GROUP: KEY EXECUTIVES
- TABLE 152. NIEDAX GROUP: COMPANY SNAPSHOT
- TABLE 153. NIEDAX GROUP: PRODUCT SEGMENTS
- TABLE 154. NIEDAX GROUP: PRODUCT PORTFOLIO
- TABLE 155. NIEDAX GROUP: KEY STRATERGIES
- TABLE 156. CHATSWORTH PRODUCTS, INC.: KEY EXECUTIVES
- TABLE 157. CHATSWORTH PRODUCTS, INC.: COMPANY SNAPSHOT
- TABLE 158. CHATSWORTH PRODUCTS, INC.: PRODUCT SEGMENTS
- TABLE 159. CHATSWORTH PRODUCTS, INC.: PRODUCT PORTFOLIO
- TABLE 160. CHATSWORTH PRODUCTS, INC.: KEY STRATERGIES
- TABLE 161. SUPERFAB INC.: KEY EXECUTIVES
- TABLE 162. SUPERFAB INC.: COMPANY SNAPSHOT
- TABLE 163. SUPERFAB INC.: PRODUCT SEGMENTS
- TABLE 164. SUPERFAB INC.: PRODUCT PORTFOLIO
LIST OF FIGURES
- FIGURE 01. CABLE TRAY MARKET, 2022-2032
- FIGURE 02. SEGMENTATION OF CABLE TRAY MARKET,2022-2032
- FIGURE 03. TOP IMPACTING FACTORS IN CABLE TRAY MARKET (2022 TO 2032)
- FIGURE 04. TOP INVESTMENT POCKETS IN CABLE TRAY MARKET (2023-2032)
- FIGURE 05. LOW BARGAINING POWER OF SUPPLIERS
- FIGURE 06. LOW THREAT OF NEW ENTRANTS
- FIGURE 07. LOW THREAT OF SUBSTITUTES
- FIGURE 08. LOW INTENSITY OF RIVALRY
- FIGURE 09. LOW BARGAINING POWER OF BUYERS
- FIGURE 10. GLOBAL CABLE TRAY MARKET:DRIVERS, RESTRAINTS AND OPPORTUNITIES
- FIGURE 11. PATENT ANALYSIS BY COMPANY
- FIGURE 12. PATENT ANALYSIS BY COUNTRY
- FIGURE 13. CABLE TRAY MARKET, BY TYPE, 2022 AND 2032(%)
- FIGURE 14. COMPARATIVE SHARE ANALYSIS OF CABLE TRAY MARKET FOR LADDER TYPE CABLE TRAYS, BY COUNTRY 2022 AND 2032(%)
- FIGURE 15. COMPARATIVE SHARE ANALYSIS OF CABLE TRAY MARKET FOR SOLID BOTTOM CABLE TRAYS, BY COUNTRY 2022 AND 2032(%)
- FIGURE 16. COMPARATIVE SHARE ANALYSIS OF CABLE TRAY MARKET FOR TROUGH CABLE TRAYS, BY COUNTRY 2022 AND 2032(%)
- FIGURE 17. COMPARATIVE SHARE ANALYSIS OF CABLE TRAY MARKET FOR CHANNEL CABLE TRAYS, BY COUNTRY 2022 AND 2032(%)
- FIGURE 18. COMPARATIVE SHARE ANALYSIS OF CABLE TRAY MARKET FOR WIRE MESH CABLE TRAYS, BY COUNTRY 2022 AND 2032(%)
- FIGURE 19. COMPARATIVE SHARE ANALYSIS OF CABLE TRAY MARKET FOR SINGLE RAIL CABLE TRAYS, BY COUNTRY 2022 AND 2032(%)
- FIGURE 20. COMPARATIVE SHARE ANALYSIS OF CABLE TRAY MARKET FOR OTHERS, BY COUNTRY 2022 AND 2032(%)
- FIGURE 21. CABLE TRAY MARKET, BY MATERIAL, 2022 AND 2032(%)
- FIGURE 22. COMPARATIVE SHARE ANALYSIS OF CABLE TRAY MARKET FOR ALUMINUM, BY COUNTRY 2022 AND 2032(%)
- FIGURE 23. COMPARATIVE SHARE ANALYSIS OF CABLE TRAY MARKET FOR STEEL, BY COUNTRY 2022 AND 2032(%)
- FIGURE 24. COMPARATIVE SHARE ANALYSIS OF CABLE TRAY MARKET FOR STAINLESS STEEL, BY COUNTRY 2022 AND 2032(%)
- FIGURE 25. COMPARATIVE SHARE ANALYSIS OF CABLE TRAY MARKET FOR OTHERS, BY COUNTRY 2022 AND 2032(%)
- FIGURE 26. CABLE TRAY MARKET, BY FINISHING, 2022 AND 2032(%)
- FIGURE 27. COMPARATIVE SHARE ANALYSIS OF CABLE TRAY MARKET FOR GALVANIZED COATINGS, BY COUNTRY 2022 AND 2032(%)
- FIGURE 28. COMPARATIVE SHARE ANALYSIS OF CABLE TRAY MARKET FOR PRE-GALVANIZED, BY COUNTRY 2022 AND 2032(%)
- FIGURE 29. COMPARATIVE SHARE ANALYSIS OF CABLE TRAY MARKET FOR HOT-DIP GALVANIZED, BY COUNTRY 2022 AND 2032(%)
- FIGURE 30. COMPARATIVE SHARE ANALYSIS OF CABLE TRAY MARKET FOR OTHERS, BY COUNTRY 2022 AND 2032(%)
- FIGURE 31. CABLE TRAY MARKET, BY APPLICATION, 2022 AND 2032(%)
- FIGURE 32. COMPARATIVE SHARE ANALYSIS OF CABLE TRAY MARKET FOR POWER, BY COUNTRY 2022 AND 2032(%)
- FIGURE 33. COMPARATIVE SHARE ANALYSIS OF CABLE TRAY MARKET FOR CONSTRUCTION, BY COUNTRY 2022 AND 2032(%)
- FIGURE 34. COMPARATIVE SHARE ANALYSIS OF CABLE TRAY MARKET FOR MANUFACTURING, BY COUNTRY 2022 AND 2032(%)
- FIGURE 35. COMPARATIVE SHARE ANALYSIS OF CABLE TRAY MARKET FOR IT AND TELECOMMUNICATION, BY COUNTRY 2022 AND 2032(%)
- FIGURE 36. COMPARATIVE SHARE ANALYSIS OF CABLE TRAY MARKET FOR OTHERS, BY COUNTRY 2022 AND 2032(%)
- FIGURE 37. CABLE TRAY MARKET BY REGION, 2022 AND 2032(%)
- FIGURE 38. U.S. CABLE TRAY MARKET, 2022-2032 ($MILLION)
- FIGURE 39. CANADA CABLE TRAY MARKET, 2022-2032 ($MILLION)
- FIGURE 40. MEXICO CABLE TRAY MARKET, 2022-2032 ($MILLION)
- FIGURE 41. GERMANY CABLE TRAY MARKET, 2022-2032 ($MILLION)
- FIGURE 42. UK CABLE TRAY MARKET, 2022-2032 ($MILLION)
- FIGURE 43. FRANCE CABLE TRAY MARKET, 2022-2032 ($MILLION)
- FIGURE 44. ITALY CABLE TRAY MARKET, 2022-2032 ($MILLION)
- FIGURE 45. SPAIN CABLE TRAY MARKET, 2022-2032 ($MILLION)
- FIGURE 46. REST OF EUROPE CABLE TRAY MARKET, 2022-2032 ($MILLION)
- FIGURE 47. CHINA CABLE TRAY MARKET, 2022-2032 ($MILLION)
- FIGURE 48. JAPAN CABLE TRAY MARKET, 2022-2032 ($MILLION)
- FIGURE 49. INDIA CABLE TRAY MARKET, 2022-2032 ($MILLION)
- FIGURE 50. SOUTH KOREA CABLE TRAY MARKET, 2022-2032 ($MILLION)
- FIGURE 51. AUSTRALIA CABLE TRAY MARKET, 2022-2032 ($MILLION)
- FIGURE 52. REST OF ASIA-PACIFIC CABLE TRAY MARKET, 2022-2032 ($MILLION)
- FIGURE 53. BRAZIL CABLE TRAY MARKET, 2022-2032 ($MILLION)
- FIGURE 54. SAUDI ARABIA CABLE TRAY MARKET, 2022-2032 ($MILLION)
- FIGURE 55. SOUTH AFRICA CABLE TRAY MARKET, 2022-2032 ($MILLION)
- FIGURE 56. REST OF LAMEA CABLE TRAY MARKET, 2022-2032 ($MILLION)
- FIGURE 57. TOP WINNING STRATEGIES, BY YEAR (2021-2023)
- FIGURE 58. TOP WINNING STRATEGIES, BY DEVELOPMENT (2021-2023)
- FIGURE 59. TOP WINNING STRATEGIES, BY COMPANY (2021-2023)
- FIGURE 60. PRODUCT MAPPING OF TOP 10 PLAYERS
- FIGURE 61. COMPETITIVE DASHBOARD
- FIGURE 62. COMPETITIVE HEATMAP: CABLE TRAY MARKET
- FIGURE 63. TOP PLAYER POSITIONING, 2022
- FIGURE 64. ABB LTD.: NET SALES, 2020-2022 ($MILLION)
- FIGURE 65. ABB LTD.: REVENUE SHARE BY SEGMENT, 2022 (%)
- FIGURE 66. ABB LTD.: REVENUE SHARE BY REGION, 2022 (%)
- FIGURE 67. EATON: NET REVENUE, 2020-2022 ($MILLION)
- FIGURE 68. EATON: RESEARCH & DEVELOPMENT EXPENDITURE, 2020-2022
- FIGURE 69. EATON: REVENUE SHARE BY SEGMENT, 2022 (%)
- FIGURE 70. EATON: REVENUE SHARE BY REGION, 2022 (%)
- FIGURE 71. HUBBELL INC.: NET SALES, 2020-2022 ($MILLION)
- FIGURE 72. HUBBELL INC.: RESEARCH & DEVELOPMENT EXPENDITURE, 2020-2022 ($MILLION)
- FIGURE 73. HUBBELL INC.: REVENUE SHARE BY SEGMENT, 2022 (%)
- FIGURE 74. HUBBELL INC.: REVENUE SHARE BY REGION, 2022 (%)
- FIGURE 75. ATKORE INC.: NET REVENUE, 2020-2022 ($MILLION)
 2025-2029年全球电缆桥架市场
 全球电缆桥架市场研究报告-产业分析、规模、份额、成长、趋势及2025年至2033年预测
 2025年全球金属网格丝网电缆桥架市场报告2025 年全球电缆配线架市场报告
 电缆桥架市场机会、成长驱动因素、产业趋势分析及 2024 年至 2032 年预测
 电缆配线架市场规模、份额和成长分析:按类型、按材料、按表面处理、按应用、按地区 - 行业预测,2024-2031 年
 电缆配线架:市场占有率分析、产业趋势与统计、成长预测(2024-2029)
 全球 FRP 电缆桥架市场规模研究,按类型(梯子、通道、其他)按应用(化学品、石油和天然气、电力、建筑等)和区域预测 2022-2032
 金属製电缆配线架的全球市场,实际成果与预测(2019年~2030年)
 2030 年电缆配线架市场预测:按类型、表面处理、材料、最终用户和地区进行的全球分析