


 |
市场调查报告书
商品编码
1414939
清真食品市场:依产品类型、通路划分:2023-2032 年全球机会分析与产业预测Halal Food Market By Product Type, By Distribution Channel : Global Opportunity Analysis and Industry Forecast, 2023-2032 |
||||||
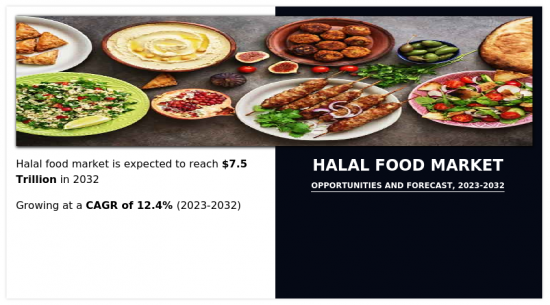
清真食品市场预估2022年价值2.3兆美元,2032年达7.4509兆美元,2023年至2032年复合年增长率为12.4%。
Halal是一个阿拉伯词,在英语中的意思是“允许的”,指的是根据伊斯兰法律允许使用的事物或活动。 “halal”和“Haram”这两个词的意思都是“禁止的”或“伊斯兰法律禁止的东西”,在《古兰经》中是有对比的。要被归类为清真食品,某些物品必须由符合某些内容和/或程序标准的认可机构进行认证。
在过去的几十年里,美国的清真业务显着成长,而这种成长预计将持续下去。在其他宗教中长大的美国现在正在皈依伊斯兰教,因为美国社会对不同于自己的观点变得更加宽容。随着该国穆斯林人口的成长,美国杂货店可能会出售更多的清真产品。因此,预计会有更多餐厅申请清真认证,以便他们向顾客提供清真食品。由于提供清真食品的美国零售商和餐厅不多,这些企业可能会得到穆斯林社区的大力支持。如果他们成功了,其他零售商和餐厅可能会效仿。
清真食品和产品在美国和世界各地的受欢迎程度正在迅速增加。清真消费者群体需要能够购买日常生活中需要的产品,例如清真美容产品和清真肉类。如果公司获得清真认证或开始经营清真产品,伊斯兰社群将能够购买到满足其需求的产品。随着越来越多的企业销售清真产品和餐厅提供清真食品,穆斯林社区将有更多的购物选择。一些公司将生产专门针对伊斯兰社区宗教习俗的产品。一旦了解清真产品的真相,人们就会意识到发展清真企业的好处及其对全球经济的有益经济影响。
清真美食的日益普及体现了中东烹饪传统的丰富多样性,并与世界各地消费者不断变化的美食偏好产生共鸣。清真食品的芳香已经渗透到古朴的乡村和繁华的大都市,超越了单纯的营养,成为一种传统与现代生活和谐相处的生活方式选择。
宗教因素,尤其是伊斯兰用餐法,是推动清真食品需求的重要因素。这种饮食选择得到了不同宗教的支持,反映了不同的动机。清真菜单的多面性反映了其迅速流行背后的复杂原因。
清真食品的需求不断增加,品质成为关键的驱动力。清真认证通常涉及遵守严格的品管通讯协定,确保满足安全、卫生和整体卓越的最高标准。人道对待动物和道德采购等道德考量进一步增加了清真食品对负责任的消费者的吸引力。
在全球范围内,各国正在调整其经济政策,以适应消费者的偏好并灌输对清真产品的信心。一个显着的例子是印尼,该国拥有世界上最多的穆斯林人口(2.07 亿人),并于 2019 年颁布了清真产品法。该法律要求在国内交易的所有消费品和相关服务必须获得清真认证。还有一些物品被视为Haram,例如:
- 虽然法律允许某些被视为非法的物品,例如酒精、猪肉和猪产品、Haram和非清真肉类,但它们必须遵守特定的法规,以确保符合伊斯兰原则。这些监管变化反映了更广泛的全球趋势,即使经济政策与清真产品不断增长的需求保持一致。
印尼引入强制性清真认证立法,提高了政府对该国生产和贸易的控制和监督水准。这项监管措施旨在增强消费者信心并简化清真物流系统。值得注意的是,综合清真产品编码和贸易资料系统预计将于年终投入运作。该系统旨在透过优化清真物流流程和提高整个供应链的可追溯性来增强消费者信心。
同样,沙乌地阿拉伯王国于 2019 年扩大了强制清真认证的范围。此次扩张包括进口乳製品、油脂、糖果零食、冷藏和冷冻食品以及延长保质期的物品。清真认证的广泛应用反映了沙乌地阿拉伯政府对确保进入市场的各种产品的清真完整性的承诺。这些措施有助于清真实践的标准化,并加强清真认证在国际贸易中的重要性。
目录
第一章简介
第 2 章执行摘要
第三章市场概况
- 市场定义和范围
- 主要发现
- 影响因素
- 主要投资机会
- 波特五力分析
- 市场动态
- 促进因素
- 穆斯林人口增加
- 消费者购买力增加
- 清真食品的需求不断增加
- 抑制因素
- 有关清真食品认证的政府法规
- 储存和运输设施限制
- 机会
- 清真认证的需求不断成长
- 促进因素
第四章清真食品市场:依产品类型
- 概述
- 肉/鸡肉
- 乳製品
- 鱼贝类
- 谷物/糖果零食
- 其他的
第五章清真食品市场:依分销管道分类
- 概述
- 传统零售商
- 超级市场和大卖场
- 在线的
- 其他的
第六章 清真食品市场:依地区
- 概述
- 北美洲
- 美国
- 加拿大
- 墨西哥
- 欧洲
- 德国
- 义大利
- 英国
- 法国
- 西班牙
- 其他的
- 亚太地区
- 中国
- 印度
- 印尼
- 澳洲
- 马来西亚
- 其他的
- 拉丁美洲/中东/非洲
- 巴西
- UAE
- 沙乌地阿拉伯
- 阿根廷
- 土耳其
- 其他的
第七章 竞争形势
- 介绍
- 关键成功策略
- 10家主要企业产品图谱
- 竞争对手仪表板
- 竞争热图
- 2022年主要企业定位
第八章 公司简介
- Saffron Road
- Al Islami Foods
- QL Resources Berhad
- Kawan Food Berhad
- Nestle SA
- Tahira Foods Ltd.
- American Foods Group, LLC
- BRF SA
- Unilever PLC
- Cargill, Incorporated
According to a new report published by Allied Market Research, titled, "Halal Food Market," The halal food market was valued at $2.3 trillion in 2022, and is estimated to reach $7450.9 billion by 2032, growing at a CAGR of 12.4% from 2023 to 2032.
Halal, an Arabic word meaning "permissible" in English, refers to something that is allowed to be used or an activity that is approved under Islamic law. The words "halal" and "haram," which both imply "forbidden" or "prohibited by Islamic law," are contrasted throughout the Koran. For some items to be classified as halal, they need to be certified by an authorized body that meets certain content and/or procedure standards.
Over the past few decades, the American halal business has grown significantly, and this growth is expected to continue in the future. Americans who were raised in other religions are now switching to Islam because society in the US has grown more tolerant of viewpoints that diverge from their own. There will be more halal items available in American grocery shops as the Muslim population in the country grows. This will also result in more eateries applying for halal certification so they may provide their patrons with halal food. These businesses will receive strong support from the Islamic community because there aren't many American retailers and eateries offering halal food. If they are successful, other retailers and eateries will follow suit.
The popularity of halal food and goods is rising quickly both in the US and globally. The halal consumer community needs to be able to buy products for their daily lives, including halal beauty products and halal meat. After businesses become certified in halal practices or start stocking halal goods, the Islamic community can start buying products tailored to their needs. The Islamic community will have more shopping options as more businesses will sell halal goods and restaurants will provide halal cuisine. This is because some companies will produce goods that are specially tailored to the religious practices of the Islamic community. People will see the benefits of a growing halal business and the beneficial economic effects it will have on the world economy once they are informed about the truth about halal products.
The increasing popularity of halal cuisine is a testament to the rich diversity of Middle Eastern culinary traditions, resonating with the evolving gastronomic preferences of consumers worldwide. The aromatic allure of halal food has permeated both quaint rural areas and bustling metropolises, transcending mere sustenance to become a lifestyle choice that harmonizes tradition with contemporary living.
Religious considerations, notably for Islamic dietary laws, emerge as a prominent factor driving the growing demand for halal food. This culinary choice has found favor across various religions, reflecting a diverse array of motivations. The multifaceted nature of halal menus mirrors the complexity of reasons behind its burgeoning popularity.
Quality is a pivotal driver in the escalating demand for halal cuisine. The certification as halal often entails adherence to rigorous quality control protocols, ensuring that the food meets the highest standards of safety, hygiene, and overall excellence. Ethical considerations, such as humane treatment of animals and ethical sourcing, further contribute to the appeal of halal cuisine among conscientious consumers.
On a global scale, nations are adapting their economic policies to accommodate consumer preferences and instill confidence in halal products. A notable example is Indonesia, home to the world's largest Muslim population (207 million people), which enacted the Halal Product Law in 2019. This legislation mandates halal certification for all consumer items and related services traded within the country. While certain items considered haram, such as alcohol, pig or hog byproducts, blood, and non-halal meat, are permitted under the law, they are subject to specific regulations to ensure compliance with Islamic principles. This regulatory shift reflects the broader global trend of aligning economic policies with the growing demand for halal products.
The introduction of mandatory halal certification laws in Indonesia has resulted in an increased level of government control and oversight over the country's production and trade. This regulatory measure aims to bolster consumer confidence and streamline the halal logistics system. Notably, an integrated halal product codification and trade data system is slated to become operational by the end of 2021. This system is designed to enhance consumer trust by optimizing halal logistics processes and improving traceability throughout the supply chain.
In a similar vein, the Kingdom of Saudi Arabia expanded the scope of its mandatory halal certification requirements in 2019. The extension included imported dairy products, oils and fats, confections, chilled and frozen meals, as well as items with a prolonged shelf life. This broader application of halal certification reflects the Saudi government's commitment to ensuring the halal integrity of a diverse range of products entering the market. Such measures contribute to the standardization of halal practices and reinforce the significance of halal certification in international trade.
The halal food market is segmented based on type, end-user, and region. Based on product type, the market is categorized into meat and poultry, dairy products, fish and seafood, cereals and confectionery, and others. According to the distribution channel, it is fragmented into traditional retailers, supermarkets and hypermarkets, online, and others. Region-wise, the market is analyzed across North America (the U.S., Canada, and Mexico), Europe (Germany, France, UK, Italy, Spain, and the rest of Europe), Asia-Pacific (China, India, Indonesia, Australia, Malaysia, Rest of Asia Pacific), and LAMEA (Brazil, UAE, Saudi Arabia, Argentina, Turkey, and the rest of LAMEA).
The major players operating in the global halal food are Saffron Road, Kawan Food Manufacturing Sdn Bhd, Al Islami Foods, QL Foods Sdn Bhd, Nestle S.A., American Foods Group, LLC, BRF S.A., Unilever PLC, Cargill, Incorporated, and TAHIRA
Key Benefits For Stakeholders
- This report provides a quantitative analysis of the market segments, current trends, estimations, and dynamics of the halal food market analysis from 2022 to 2032 to identify the prevailing halal food market opportunities.
- The market research is offered along with information related to key drivers, restraints, and opportunities.
- Porter's five forces analysis highlights the potency of buyers and suppliers to enable stakeholders make profit-oriented business decisions and strengthen their supplier-buyer network.
- In-depth analysis of the halal food market segmentation assists to determine the prevailing market opportunities.
- Major countries in each region are mapped according to their revenue contribution to the global market.
- Market player positioning facilitates benchmarking and provides a clear understanding of the present position of the market players.
- The report includes the analysis of the regional as well as global halal food market trends, key players, market segments, application areas, and market growth strategies.
Additional benefits you will get with this purchase are:
- Quarterly Update and* (only available with a corporate license, on listed price)
- 5 additional Company Profile of client Choice pre- or Post-purchase, as a free update.
- Free Upcoming Version on the Purchase of Five and Enterprise User License.
- 16 analyst hours of support* (post-purchase, if you find additional data requirements upon review of the report, you may receive support amounting to 16 analyst hours to solve questions, and post-sale queries)
- 15% Free Customization* (in case the scope or segment of the report does not match your requirements, 15% is equivalent to 3 working days of free work, applicable once)
- Free data Pack on the Five and Enterprise User License. (Excel version of the report)
- Free Updated report if the report is 6-12 months old or older.
- 24-hour priority response*
- Free Industry updates and white papers.
Possible Customization with this report (with additional cost and timeline, please talk to the sales executive to know more)
- Average Consumer Expenditure
- Regulatory Guidelines
- Strategic Recommedations
- Additional company profiles with specific to client's interest
- Additional country or region analysis- market size and forecast
- Average Selling Price Analysis / Price Point Analysis
- Expanded list for Company Profiles
- Historic market data
- List of customers/consumers/raw material suppliers- value chain analysis
- Per Capita Consumption Trends
- Product Consumption Analysis
Key Market Segments
By Product Type
- Meat and Poultry
- Dairy Products
- Fish and Seafood
- Cereals and Confectionery
- Others
By Distribution Channel
- Traditional Retailers
- Supermarkets and Hypermarkets
- Online
- Others
By Region
- North America
- U.S.
- Canada
- Mexico
- Europe
- Germany
- Italy
- UK
- France
- Spain
- Rest of Europe
- Asia-Pacific
- China
- India
- Indonesia
- Australia
- Malaysia
- Rest of Asia-Pacific
- LAMEA
- Brazil
- UAE
- Saudi Arabia
- Argentina
- Turkey
- Rest of LAMEA
Key Market Players:
- Saffron Road
- Al Islami Foods
- Kawan Food Berhad
- QL Resources Berhad
- Nestle S.A.
- American Foods Group, LLC
- BRF S.A.
- Unilever PLC
- Cargill, Incorporated
- Tahira Foods Ltd.
TABLE OF CONTENTS
CHAPTER 1: INTRODUCTION
- 1.1. Report description
- 1.2. Key market segments
- 1.3. Key benefits to the stakeholders
- 1.4. Research methodology
- 1.4.1. Primary research
- 1.4.2. Secondary research
- 1.4.3. Analyst tools and models
CHAPTER 2: EXECUTIVE SUMMARY
- 2.1. CXO Perspective
CHAPTER 3: MARKET OVERVIEW
- 3.1. Market definition and scope
- 3.2. Key findings
- 3.2.1. Top impacting factors
- 3.2.2. Top investment pockets
- 3.3. Porter's five forces analysis
- 3.3.1. Low bargaining power of suppliers
- 3.3.2. Low threat of new entrants
- 3.3.3. Low threat of substitutes
- 3.3.4. Low intensity of rivalry
- 3.3.5. Low bargaining power of buyers
- 3.4. Market dynamics
- 3.4.1. Drivers
- 3.4.1.1. Growing Muslim Population
- 3.4.1.2. Increase in Purchasing Power of Consumers
- 3.4.1.3. Increasing demand for halal food products
- 3.4.2. Restraints
- 3.4.2.1. Government regulations on Halal food certification
- 3.4.2.2. Restrictions during storage and transport facility
- 3.4.3. Opportunities
- 3.4.3.1. Increasing need of Halal Certification
- 3.4.1. Drivers
CHAPTER 4: HALAL FOOD MARKET, BY PRODUCT TYPE
- 4.1. Overview
- 4.1.1. Market size and forecast
- 4.2. Meat and Poultry
- 4.2.1. Key market trends, growth factors and opportunities
- 4.2.2. Market size and forecast, by region
- 4.2.3. Market share analysis by country
- 4.3. Dairy Products
- 4.3.1. Key market trends, growth factors and opportunities
- 4.3.2. Market size and forecast, by region
- 4.3.3. Market share analysis by country
- 4.4. Fish and Seafood
- 4.4.1. Key market trends, growth factors and opportunities
- 4.4.2. Market size and forecast, by region
- 4.4.3. Market share analysis by country
- 4.5. Cereals and Confectionery
- 4.5.1. Key market trends, growth factors and opportunities
- 4.5.2. Market size and forecast, by region
- 4.5.3. Market share analysis by country
- 4.6. Others
- 4.6.1. Key market trends, growth factors and opportunities
- 4.6.2. Market size and forecast, by region
- 4.6.3. Market share analysis by country
CHAPTER 5: HALAL FOOD MARKET, BY DISTRIBUTION CHANNEL
- 5.1. Overview
- 5.1.1. Market size and forecast
- 5.2. Traditional Retailers
- 5.2.1. Key market trends, growth factors and opportunities
- 5.2.2. Market size and forecast, by region
- 5.2.3. Market share analysis by country
- 5.3. Supermarkets and Hypermarkets
- 5.3.1. Key market trends, growth factors and opportunities
- 5.3.2. Market size and forecast, by region
- 5.3.3. Market share analysis by country
- 5.4. Online
- 5.4.1. Key market trends, growth factors and opportunities
- 5.4.2. Market size and forecast, by region
- 5.4.3. Market share analysis by country
- 5.5. Others
- 5.5.1. Key market trends, growth factors and opportunities
- 5.5.2. Market size and forecast, by region
- 5.5.3. Market share analysis by country
CHAPTER 6: HALAL FOOD MARKET, BY REGION
- 6.1. Overview
- 6.1.1. Market size and forecast By Region
- 6.2. North America
- 6.2.1. Key market trends, growth factors and opportunities
- 6.2.2. Market size and forecast, by Product Type
- 6.2.3. Market size and forecast, by Distribution Channel
- 6.2.4. Market size and forecast, by country
- 6.2.4.1. U.S.
- 6.2.4.1.1. Market size and forecast, by Product Type
- 6.2.4.1.2. Market size and forecast, by Distribution Channel
- 6.2.4.2. Canada
- 6.2.4.2.1. Market size and forecast, by Product Type
- 6.2.4.2.2. Market size and forecast, by Distribution Channel
- 6.2.4.3. Mexico
- 6.2.4.3.1. Market size and forecast, by Product Type
- 6.2.4.3.2. Market size and forecast, by Distribution Channel
- 6.3. Europe
- 6.3.1. Key market trends, growth factors and opportunities
- 6.3.2. Market size and forecast, by Product Type
- 6.3.3. Market size and forecast, by Distribution Channel
- 6.3.4. Market size and forecast, by country
- 6.3.4.1. Germany
- 6.3.4.1.1. Market size and forecast, by Product Type
- 6.3.4.1.2. Market size and forecast, by Distribution Channel
- 6.3.4.2. Italy
- 6.3.4.2.1. Market size and forecast, by Product Type
- 6.3.4.2.2. Market size and forecast, by Distribution Channel
- 6.3.4.3. UK
- 6.3.4.3.1. Market size and forecast, by Product Type
- 6.3.4.3.2. Market size and forecast, by Distribution Channel
- 6.3.4.4. France
- 6.3.4.4.1. Market size and forecast, by Product Type
- 6.3.4.4.2. Market size and forecast, by Distribution Channel
- 6.3.4.5. Spain
- 6.3.4.5.1. Market size and forecast, by Product Type
- 6.3.4.5.2. Market size and forecast, by Distribution Channel
- 6.3.4.6. Rest of Europe
- 6.3.4.6.1. Market size and forecast, by Product Type
- 6.3.4.6.2. Market size and forecast, by Distribution Channel
- 6.4. Asia-Pacific
- 6.4.1. Key market trends, growth factors and opportunities
- 6.4.2. Market size and forecast, by Product Type
- 6.4.3. Market size and forecast, by Distribution Channel
- 6.4.4. Market size and forecast, by country
- 6.4.4.1. China
- 6.4.4.1.1. Market size and forecast, by Product Type
- 6.4.4.1.2. Market size and forecast, by Distribution Channel
- 6.4.4.2. India
- 6.4.4.2.1. Market size and forecast, by Product Type
- 6.4.4.2.2. Market size and forecast, by Distribution Channel
- 6.4.4.3. Indonesia
- 6.4.4.3.1. Market size and forecast, by Product Type
- 6.4.4.3.2. Market size and forecast, by Distribution Channel
- 6.4.4.4. Australia
- 6.4.4.4.1. Market size and forecast, by Product Type
- 6.4.4.4.2. Market size and forecast, by Distribution Channel
- 6.4.4.5. Malaysia
- 6.4.4.5.1. Market size and forecast, by Product Type
- 6.4.4.5.2. Market size and forecast, by Distribution Channel
- 6.4.4.6. Rest of Asia-Pacific
- 6.4.4.6.1. Market size and forecast, by Product Type
- 6.4.4.6.2. Market size and forecast, by Distribution Channel
- 6.5. LAMEA
- 6.5.1. Key market trends, growth factors and opportunities
- 6.5.2. Market size and forecast, by Product Type
- 6.5.3. Market size and forecast, by Distribution Channel
- 6.5.4. Market size and forecast, by country
- 6.5.4.1. Brazil
- 6.5.4.1.1. Market size and forecast, by Product Type
- 6.5.4.1.2. Market size and forecast, by Distribution Channel
- 6.5.4.2. UAE
- 6.5.4.2.1. Market size and forecast, by Product Type
- 6.5.4.2.2. Market size and forecast, by Distribution Channel
- 6.5.4.3. Saudi Arabia
- 6.5.4.3.1. Market size and forecast, by Product Type
- 6.5.4.3.2. Market size and forecast, by Distribution Channel
- 6.5.4.4. Argentina
- 6.5.4.4.1. Market size and forecast, by Product Type
- 6.5.4.4.2. Market size and forecast, by Distribution Channel
- 6.5.4.5. Turkey
- 6.5.4.5.1. Market size and forecast, by Product Type
- 6.5.4.5.2. Market size and forecast, by Distribution Channel
- 6.5.4.6. Rest of LAMEA
- 6.5.4.6.1. Market size and forecast, by Product Type
- 6.5.4.6.2. Market size and forecast, by Distribution Channel
CHAPTER 7: COMPETITIVE LANDSCAPE
- 7.1. Introduction
- 7.2. Top winning strategies
- 7.3. Product mapping of top 10 player
- 7.4. Competitive dashboard
- 7.5. Competitive heatmap
- 7.6. Top player positioning, 2022
CHAPTER 8: COMPANY PROFILES
- 8.1. Saffron Road
- 8.1.1. Company overview
- 8.1.2. Key executives
- 8.1.3. Company snapshot
- 8.1.4. Operating business segments
- 8.1.5. Product portfolio
- 8.2. Al Islami Foods
- 8.2.1. Company overview
- 8.2.2. Key executives
- 8.2.3. Company snapshot
- 8.2.4. Operating business segments
- 8.2.5. Product portfolio
- 8.2.6. Key strategic moves and developments
- 8.3. QL Resources Berhad
- 8.3.1. Company overview
- 8.3.2. Key executives
- 8.3.3. Company snapshot
- 8.3.4. Operating business segments
- 8.3.5. Product portfolio
- 8.3.6. Business performance
- 8.4. Kawan Food Berhad
- 8.4.1. Company overview
- 8.4.2. Key executives
- 8.4.3. Company snapshot
- 8.4.4. Operating business segments
- 8.4.5. Product portfolio
- 8.4.6. Business performance
- 8.4.7. Key strategic moves and developments
- 8.5. Nestle S.A.
- 8.5.1. Company overview
- 8.5.2. Key executives
- 8.5.3. Company snapshot
- 8.5.4. Operating business segments
- 8.5.5. Product portfolio
- 8.5.6. Business performance
- 8.5.7. Key strategic moves and developments
- 8.6. Tahira Foods Ltd.
- 8.6.1. Company overview
- 8.6.2. Key executives
- 8.6.3. Company snapshot
- 8.6.4. Operating business segments
- 8.6.5. Product portfolio
- 8.6.6. Key strategic moves and developments
- 8.7. American Foods Group, LLC
- 8.7.1. Company overview
- 8.7.2. Key executives
- 8.7.3. Company snapshot
- 8.7.4. Operating business segments
- 8.7.5. Product portfolio
- 8.7.6. Key strategic moves and developments
- 8.8. BRF S.A.
- 8.8.1. Company overview
- 8.8.2. Key executives
- 8.8.3. Company snapshot
- 8.8.4. Operating business segments
- 8.8.5. Product portfolio
- 8.8.6. Business performance
- 8.8.7. Key strategic moves and developments
- 8.9. Unilever PLC
- 8.9.1. Company overview
- 8.9.2. Key executives
- 8.9.3. Company snapshot
- 8.9.4. Operating business segments
- 8.9.5. Product portfolio
- 8.9.6. Business performance
- 8.9.7. Key strategic moves and developments
- 8.10. Cargill, Incorporated
- 8.10.1. Company overview
- 8.10.2. Key executives
- 8.10.3. Company snapshot
- 8.10.4. Operating business segments
- 8.10.5. Product portfolio
- 8.10.6. Business performance
- 8.10.7. Key strategic moves and developments
LIST OF TABLES
- TABLE 01. GLOBAL HALAL FOOD MARKET, BY PRODUCT TYPE, 2022-2032 ($BILLION)
- TABLE 02. HALAL FOOD MARKET FOR MEAT AND POULTRY, BY REGION, 2022-2032 ($BILLION)
- TABLE 03. HALAL FOOD MARKET FOR DAIRY PRODUCTS, BY REGION, 2022-2032 ($BILLION)
- TABLE 04. HALAL FOOD MARKET FOR FISH AND SEAFOOD, BY REGION, 2022-2032 ($BILLION)
- TABLE 05. HALAL FOOD MARKET FOR CEREALS AND CONFECTIONERY, BY REGION, 2022-2032 ($BILLION)
- TABLE 06. HALAL FOOD MARKET FOR OTHERS, BY REGION, 2022-2032 ($BILLION)
- TABLE 07. GLOBAL HALAL FOOD MARKET, BY DISTRIBUTION CHANNEL, 2022-2032 ($BILLION)
- TABLE 08. HALAL FOOD MARKET FOR TRADITIONAL RETAILERS, BY REGION, 2022-2032 ($BILLION)
- TABLE 09. HALAL FOOD MARKET FOR SUPERMARKETS AND HYPERMARKETS, BY REGION, 2022-2032 ($BILLION)
- TABLE 10. HALAL FOOD MARKET FOR ONLINE, BY REGION, 2022-2032 ($BILLION)
- TABLE 11. HALAL FOOD MARKET FOR OTHERS, BY REGION, 2022-2032 ($BILLION)
- TABLE 12. HALAL FOOD MARKET, BY REGION, 2022-2032 ($BILLION)
- TABLE 13. NORTH AMERICA HALAL FOOD MARKET, BY PRODUCT TYPE, 2022-2032 ($BILLION)
- TABLE 14. NORTH AMERICA HALAL FOOD MARKET, BY DISTRIBUTION CHANNEL, 2022-2032 ($BILLION)
- TABLE 15. NORTH AMERICA HALAL FOOD MARKET, BY COUNTRY, 2022-2032 ($BILLION)
- TABLE 16. U.S. HALAL FOOD MARKET, BY PRODUCT TYPE, 2022-2032 ($BILLION)
- TABLE 17. U.S. HALAL FOOD MARKET, BY DISTRIBUTION CHANNEL, 2022-2032 ($BILLION)
- TABLE 18. CANADA HALAL FOOD MARKET, BY PRODUCT TYPE, 2022-2032 ($BILLION)
- TABLE 19. CANADA HALAL FOOD MARKET, BY DISTRIBUTION CHANNEL, 2022-2032 ($BILLION)
- TABLE 20. MEXICO HALAL FOOD MARKET, BY PRODUCT TYPE, 2022-2032 ($BILLION)
- TABLE 21. MEXICO HALAL FOOD MARKET, BY DISTRIBUTION CHANNEL, 2022-2032 ($BILLION)
- TABLE 22. EUROPE HALAL FOOD MARKET, BY PRODUCT TYPE, 2022-2032 ($BILLION)
- TABLE 23. EUROPE HALAL FOOD MARKET, BY DISTRIBUTION CHANNEL, 2022-2032 ($BILLION)
- TABLE 24. EUROPE HALAL FOOD MARKET, BY COUNTRY, 2022-2032 ($BILLION)
- TABLE 25. GERMANY HALAL FOOD MARKET, BY PRODUCT TYPE, 2022-2032 ($BILLION)
- TABLE 26. GERMANY HALAL FOOD MARKET, BY DISTRIBUTION CHANNEL, 2022-2032 ($BILLION)
- TABLE 27. ITALY HALAL FOOD MARKET, BY PRODUCT TYPE, 2022-2032 ($BILLION)
- TABLE 28. ITALY HALAL FOOD MARKET, BY DISTRIBUTION CHANNEL, 2022-2032 ($BILLION)
- TABLE 29. UK HALAL FOOD MARKET, BY PRODUCT TYPE, 2022-2032 ($BILLION)
- TABLE 30. UK HALAL FOOD MARKET, BY DISTRIBUTION CHANNEL, 2022-2032 ($BILLION)
- TABLE 31. FRANCE HALAL FOOD MARKET, BY PRODUCT TYPE, 2022-2032 ($BILLION)
- TABLE 32. FRANCE HALAL FOOD MARKET, BY DISTRIBUTION CHANNEL, 2022-2032 ($BILLION)
- TABLE 33. SPAIN HALAL FOOD MARKET, BY PRODUCT TYPE, 2022-2032 ($BILLION)
- TABLE 34. SPAIN HALAL FOOD MARKET, BY DISTRIBUTION CHANNEL, 2022-2032 ($BILLION)
- TABLE 35. REST OF EUROPE HALAL FOOD MARKET, BY PRODUCT TYPE, 2022-2032 ($BILLION)
- TABLE 36. REST OF EUROPE HALAL FOOD MARKET, BY DISTRIBUTION CHANNEL, 2022-2032 ($BILLION)
- TABLE 37. ASIA-PACIFIC HALAL FOOD MARKET, BY PRODUCT TYPE, 2022-2032 ($BILLION)
- TABLE 38. ASIA-PACIFIC HALAL FOOD MARKET, BY DISTRIBUTION CHANNEL, 2022-2032 ($BILLION)
- TABLE 39. ASIA-PACIFIC HALAL FOOD MARKET, BY COUNTRY, 2022-2032 ($BILLION)
- TABLE 40. CHINA HALAL FOOD MARKET, BY PRODUCT TYPE, 2022-2032 ($BILLION)
- TABLE 41. CHINA HALAL FOOD MARKET, BY DISTRIBUTION CHANNEL, 2022-2032 ($BILLION)
- TABLE 42. INDIA HALAL FOOD MARKET, BY PRODUCT TYPE, 2022-2032 ($BILLION)
- TABLE 43. INDIA HALAL FOOD MARKET, BY DISTRIBUTION CHANNEL, 2022-2032 ($BILLION)
- TABLE 44. INDONESIA HALAL FOOD MARKET, BY PRODUCT TYPE, 2022-2032 ($BILLION)
- TABLE 45. INDONESIA HALAL FOOD MARKET, BY DISTRIBUTION CHANNEL, 2022-2032 ($BILLION)
- TABLE 46. AUSTRALIA HALAL FOOD MARKET, BY PRODUCT TYPE, 2022-2032 ($BILLION)
- TABLE 47. AUSTRALIA HALAL FOOD MARKET, BY DISTRIBUTION CHANNEL, 2022-2032 ($BILLION)
- TABLE 48. MALAYSIA HALAL FOOD MARKET, BY PRODUCT TYPE, 2022-2032 ($BILLION)
- TABLE 49. MALAYSIA HALAL FOOD MARKET, BY DISTRIBUTION CHANNEL, 2022-2032 ($BILLION)
- TABLE 50. REST OF ASIA-PACIFIC HALAL FOOD MARKET, BY PRODUCT TYPE, 2022-2032 ($BILLION)
- TABLE 51. REST OF ASIA-PACIFIC HALAL FOOD MARKET, BY DISTRIBUTION CHANNEL, 2022-2032 ($BILLION)
- TABLE 52. LAMEA HALAL FOOD MARKET, BY PRODUCT TYPE, 2022-2032 ($BILLION)
- TABLE 53. LAMEA HALAL FOOD MARKET, BY DISTRIBUTION CHANNEL, 2022-2032 ($BILLION)
- TABLE 54. LAMEA HALAL FOOD MARKET, BY COUNTRY, 2022-2032 ($BILLION)
- TABLE 55. BRAZIL HALAL FOOD MARKET, BY PRODUCT TYPE, 2022-2032 ($BILLION)
- TABLE 56. BRAZIL HALAL FOOD MARKET, BY DISTRIBUTION CHANNEL, 2022-2032 ($BILLION)
- TABLE 57. UAE HALAL FOOD MARKET, BY PRODUCT TYPE, 2022-2032 ($BILLION)
- TABLE 58. UAE HALAL FOOD MARKET, BY DISTRIBUTION CHANNEL, 2022-2032 ($BILLION)
- TABLE 59. SAUDI ARABIA HALAL FOOD MARKET, BY PRODUCT TYPE, 2022-2032 ($BILLION)
- TABLE 60. SAUDI ARABIA HALAL FOOD MARKET, BY DISTRIBUTION CHANNEL, 2022-2032 ($BILLION)
- TABLE 61. ARGENTINA HALAL FOOD MARKET, BY PRODUCT TYPE, 2022-2032 ($BILLION)
- TABLE 62. ARGENTINA HALAL FOOD MARKET, BY DISTRIBUTION CHANNEL, 2022-2032 ($BILLION)
- TABLE 63. TURKEY HALAL FOOD MARKET, BY PRODUCT TYPE, 2022-2032 ($BILLION)
- TABLE 64. TURKEY HALAL FOOD MARKET, BY DISTRIBUTION CHANNEL, 2022-2032 ($BILLION)
- TABLE 65. REST OF LAMEA HALAL FOOD MARKET, BY PRODUCT TYPE, 2022-2032 ($BILLION)
- TABLE 66. REST OF LAMEA HALAL FOOD MARKET, BY DISTRIBUTION CHANNEL, 2022-2032 ($BILLION)
- TABLE 67. SAFFRON ROAD: KEY EXECUTIVES
- TABLE 68. SAFFRON ROAD: COMPANY SNAPSHOT
- TABLE 69. SAFFRON ROAD: PRODUCT SEGMENTS
- TABLE 70. SAFFRON ROAD: PRODUCT PORTFOLIO
- TABLE 71. AL ISLAMI FOODS: KEY EXECUTIVES
- TABLE 72. AL ISLAMI FOODS: COMPANY SNAPSHOT
- TABLE 73. AL ISLAMI FOODS: PRODUCT SEGMENTS
- TABLE 74. AL ISLAMI FOODS: PRODUCT PORTFOLIO
- TABLE 75. AL ISLAMI FOODS: KEY STRATERGIES
- TABLE 76. QL RESOURCES BERHAD: KEY EXECUTIVES
- TABLE 77. QL RESOURCES BERHAD: COMPANY SNAPSHOT
- TABLE 78. QL RESOURCES BERHAD: PRODUCT SEGMENTS
- TABLE 79. QL RESOURCES BERHAD: PRODUCT PORTFOLIO
- TABLE 80. KAWAN FOOD BERHAD: KEY EXECUTIVES
- TABLE 81. KAWAN FOOD BERHAD: COMPANY SNAPSHOT
- TABLE 82. KAWAN FOOD BERHAD: PRODUCT SEGMENTS
- TABLE 83. KAWAN FOOD BERHAD: PRODUCT PORTFOLIO
- TABLE 84. KAWAN FOOD BERHAD: KEY STRATERGIES
- TABLE 85. NESTLE S.A.: KEY EXECUTIVES
- TABLE 86. NESTLE S.A.: COMPANY SNAPSHOT
- TABLE 87. NESTLE S.A.: PRODUCT SEGMENTS
- TABLE 88. NESTLE S.A.: PRODUCT PORTFOLIO
- TABLE 89. NESTLE S.A.: KEY STRATERGIES
- TABLE 90. TAHIRA FOODS LTD.: KEY EXECUTIVES
- TABLE 91. TAHIRA FOODS LTD.: COMPANY SNAPSHOT
- TABLE 92. TAHIRA FOODS LTD.: PRODUCT SEGMENTS
- TABLE 93. TAHIRA FOODS LTD.: PRODUCT PORTFOLIO
- TABLE 94. TAHIRA FOODS LTD.: KEY STRATERGIES
- TABLE 95. AMERICAN FOODS GROUP, LLC: KEY EXECUTIVES
- TABLE 96. AMERICAN FOODS GROUP, LLC: COMPANY SNAPSHOT
- TABLE 97. AMERICAN FOODS GROUP, LLC: PRODUCT SEGMENTS
- TABLE 98. AMERICAN FOODS GROUP, LLC: PRODUCT PORTFOLIO
- TABLE 99. AMERICAN FOODS GROUP, LLC: KEY STRATERGIES
- TABLE 100. BRF S.A.: KEY EXECUTIVES
- TABLE 101. BRF S.A.: COMPANY SNAPSHOT
- TABLE 102. BRF S.A.: PRODUCT SEGMENTS
- TABLE 103. BRF S.A.: PRODUCT PORTFOLIO
- TABLE 104. BRF S.A.: KEY STRATERGIES
- TABLE 105. UNILEVER PLC: KEY EXECUTIVES
- TABLE 106. UNILEVER PLC: COMPANY SNAPSHOT
- TABLE 107. UNILEVER PLC: PRODUCT SEGMENTS
- TABLE 108. UNILEVER PLC: PRODUCT PORTFOLIO
- TABLE 109. UNILEVER PLC: KEY STRATERGIES
- TABLE 110. CARGILL, INCORPORATED: KEY EXECUTIVES
- TABLE 111. CARGILL, INCORPORATED: COMPANY SNAPSHOT
- TABLE 112. CARGILL, INCORPORATED: PRODUCT SEGMENTS
- TABLE 113. CARGILL, INCORPORATED: PRODUCT PORTFOLIO
- TABLE 114. CARGILL, INCORPORATED: KEY STRATERGIES
LIST OF FIGURES
- FIGURE 01. HALAL FOOD MARKET, 2022-2032
- FIGURE 02. SEGMENTATION OF HALAL FOOD MARKET,2022-2032
- FIGURE 03. TOP IMPACTING FACTORS IN HALAL FOOD MARKET (2022 TO 2032)
- FIGURE 04. TOP INVESTMENT POCKETS IN HALAL FOOD MARKET (2023-2032)
- FIGURE 05. LOW BARGAINING POWER OF SUPPLIERS
- FIGURE 06. LOW THREAT OF NEW ENTRANTS
- FIGURE 07. LOW THREAT OF SUBSTITUTES
- FIGURE 08. LOW INTENSITY OF RIVALRY
- FIGURE 09. LOW BARGAINING POWER OF BUYERS
- FIGURE 10. GLOBAL HALAL FOOD MARKET:DRIVERS, RESTRAINTS AND OPPORTUNITIES
- FIGURE 11. HALAL FOOD MARKET, BY PRODUCT TYPE, 2022 AND 2032(%)
- FIGURE 12. COMPARATIVE SHARE ANALYSIS OF HALAL FOOD MARKET FOR MEAT AND POULTRY, BY COUNTRY 2022 AND 2032(%)
- FIGURE 13. COMPARATIVE SHARE ANALYSIS OF HALAL FOOD MARKET FOR DAIRY PRODUCTS, BY COUNTRY 2022 AND 2032(%)
- FIGURE 14. COMPARATIVE SHARE ANALYSIS OF HALAL FOOD MARKET FOR FISH AND SEAFOOD, BY COUNTRY 2022 AND 2032(%)
- FIGURE 15. COMPARATIVE SHARE ANALYSIS OF HALAL FOOD MARKET FOR CEREALS AND CONFECTIONERY, BY COUNTRY 2022 AND 2032(%)
- FIGURE 16. COMPARATIVE SHARE ANALYSIS OF HALAL FOOD MARKET FOR OTHERS, BY COUNTRY 2022 AND 2032(%)
- FIGURE 17. HALAL FOOD MARKET, BY DISTRIBUTION CHANNEL, 2022 AND 2032(%)
- FIGURE 18. COMPARATIVE SHARE ANALYSIS OF HALAL FOOD MARKET FOR TRADITIONAL RETAILERS, BY COUNTRY 2022 AND 2032(%)
- FIGURE 19. COMPARATIVE SHARE ANALYSIS OF HALAL FOOD MARKET FOR SUPERMARKETS AND HYPERMARKETS, BY COUNTRY 2022 AND 2032(%)
- FIGURE 20. COMPARATIVE SHARE ANALYSIS OF HALAL FOOD MARKET FOR ONLINE, BY COUNTRY 2022 AND 2032(%)
- FIGURE 21. COMPARATIVE SHARE ANALYSIS OF HALAL FOOD MARKET FOR OTHERS, BY COUNTRY 2022 AND 2032(%)
- FIGURE 22. HALAL FOOD MARKET BY REGION, 2022 AND 2032(%)
- FIGURE 23. U.S. HALAL FOOD MARKET, 2022-2032 ($BILLION)
- FIGURE 24. CANADA HALAL FOOD MARKET, 2022-2032 ($BILLION)
- FIGURE 25. MEXICO HALAL FOOD MARKET, 2022-2032 ($BILLION)
- FIGURE 26. GERMANY HALAL FOOD MARKET, 2022-2032 ($BILLION)
- FIGURE 27. ITALY HALAL FOOD MARKET, 2022-2032 ($BILLION)
- FIGURE 28. UK HALAL FOOD MARKET, 2022-2032 ($BILLION)
- FIGURE 29. FRANCE HALAL FOOD MARKET, 2022-2032 ($BILLION)
- FIGURE 30. SPAIN HALAL FOOD MARKET, 2022-2032 ($BILLION)
- FIGURE 31. REST OF EUROPE HALAL FOOD MARKET, 2022-2032 ($BILLION)
- FIGURE 32. CHINA HALAL FOOD MARKET, 2022-2032 ($BILLION)
- FIGURE 33. INDIA HALAL FOOD MARKET, 2022-2032 ($BILLION)
- FIGURE 34. INDONESIA HALAL FOOD MARKET, 2022-2032 ($BILLION)
- FIGURE 35. AUSTRALIA HALAL FOOD MARKET, 2022-2032 ($BILLION)
- FIGURE 36. MALAYSIA HALAL FOOD MARKET, 2022-2032 ($BILLION)
- FIGURE 37. REST OF ASIA-PACIFIC HALAL FOOD MARKET, 2022-2032 ($BILLION)
- FIGURE 38. BRAZIL HALAL FOOD MARKET, 2022-2032 ($BILLION)
- FIGURE 39. UAE HALAL FOOD MARKET, 2022-2032 ($BILLION)
- FIGURE 40. SAUDI ARABIA HALAL FOOD MARKET, 2022-2032 ($BILLION)
- FIGURE 41. ARGENTINA HALAL FOOD MARKET, 2022-2032 ($BILLION)
- FIGURE 42. TURKEY HALAL FOOD MARKET, 2022-2032 ($BILLION)
- FIGURE 43. REST OF LAMEA HALAL FOOD MARKET, 2022-2032 ($BILLION)
- FIGURE 44. TOP WINNING STRATEGIES, BY YEAR (2021-2023)
- FIGURE 45. TOP WINNING STRATEGIES, BY DEVELOPMENT (2021-2023)
- FIGURE 46. TOP WINNING STRATEGIES, BY COMPANY (2021-2023)
- FIGURE 47. PRODUCT MAPPING OF TOP 10 PLAYERS
- FIGURE 48. COMPETITIVE DASHBOARD
- FIGURE 49. COMPETITIVE HEATMAP: HALAL FOOD MARKET
- FIGURE 50. TOP PLAYER POSITIONING, 2022
- FIGURE 51. QL RESOURCES BERHAD: SALES REVENUE, 2021-2023 ($MILLION)
- FIGURE 52. QL RESOURCES BERHAD: REVENUE SHARE BY SEGMENT, 2023 (%)
- FIGURE 53. QL RESOURCES BERHAD: REVENUE SHARE BY REGION, 2023 (%)
- FIGURE 54. KAWAN FOOD BERHAD: SALES REVENUE, 2020-2022 ($MILLION)
- FIGURE 55. NESTLE S.A.: NET REVENUE, 2020-2022 ($MILLION)
- FIGURE 56. NESTLE S.A.: REVENUE SHARE BY SEGMENT, 2022 (%)
- FIGURE 57. NESTLE S.A.: REVENUE SHARE BY REGION, 2022 (%)
- FIGURE 58. BRF S.A.: SALES REVENUE, 2020-2022 ($MILLION)
- FIGURE 59. BRF S.A.: REVENUE SHARE BY SEGMENT, 2022 (%)
- FIGURE 60. UNILEVER PLC: NET SALES, 2020-2022 ($MILLION)
- FIGURE 61. UNILEVER PLC: RESEARCH & DEVELOPMENT EXPENDITURE, 2020-2022 ($MILLION)
- FIGURE 62. UNILEVER PLC: REVENUE SHARE BY SEGMENT, 2022 (%)
- FIGURE 63. UNILEVER PLC: REVENUE SHARE BY REGION, 2022 (%)
- FIGURE 64. CARGILL, INCORPORATED: NET REVENUE, 2020-2022 ($MILLION)
 清真食品服务市场规模及预测 2021 - 2031、全球及地区份额、趋势及成长机会分析报告涵盖范围:依产品类型、最终用户及地理划分
 清真食品和饮料市场规模、份额及成长分析(按产品类型、分销管道和地区)-2025-2032 年产业预测
 清真食品市场规模、份额和成长分析(按性质、产品类型、用途和地区):产业预测(2024-2031)
 清真食品市场规模、占有率、趋势、行业分析报告(按产品类型、分销管道和地区)- 市场预测,2025-2034 年清真食品和饮料市场:全球产业分析、规模、占有率、成长、趋势、2024-2031年预测
 清真食品市场 - 全球产业规模、份额、趋势、机会和预测,按类型、配销通路、地区和竞争细分,2019-2029F
 全球清真食品市场研究报告 - 2024 年至 2032 年产业分析、规模、份额、成长、趋势与预测