


 |
市场调查报告书
商品编码
1414986
绿氢市场:按技术、按应用、按最终用途产业:2023-2032 年全球机会分析与产业预测Green Hydrogen Market By Technology, By Application, By End-use industry : Global Opportunity Analysis and Industry Forecast, 2023-2032 |
||||||
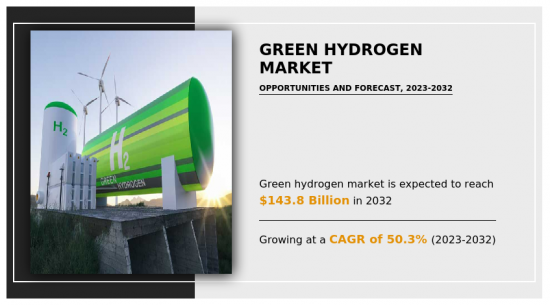
2022年绿氢市场规模为25亿美元,预计2032年将达1,438亿美元,2023年至2032年复合年增长率为50.3%。
绿氢是透过电解水产生的。该过程使用可再生电力将水分子分解为氢气和氧气。主要应用包括与电力并行的高温製程、生产绿色氨和有机化学品的原料、替代煤焦炼钢等重工业、航运和航空等远距运输以及长期运输。能源储存。
由于绿氢生产和基础设施成本下降,北美绿氢产业在预测期内显着成长。绿氢预计将在经济脱碳和向清洁能源未来过渡方面发挥重要作用。根据国际能源总署(IEA)统计,在北美,重工业和远距运输领域的绿色氢能应用目前仅占全球整体氢能投资的0.1%。
全球绿氢市场,特别是电解市场,预计将从 2022 年的不到 11 吉瓦呈指数级增长,到 2030 年电解槽的装置容量将达到 550 吉瓦。美国在2005年至2020年间将电力业碳排放减少40%方面取得了令人瞩目的成果,现任政府的目标是到2035年减少100%。此外,作为《减少通货膨胀法案》(IRA) 的一部分,我们将提供新的清洁氢特定生产税额扣抵(PTC),为每公斤清洁氢计划提供高达 3 美元的税收减免。
此外,世界各国政府的支持性政策、奖励和雄心勃勃的可再生能源目标正在推动绿氢生产和基础设施的投资和倡议。各国政府与私人公司和研究机构正在共同努力推动创新、降低生产成本并扩大绿氢计划。从应用来看,交通运输业预计将在2022年占据最高的市场占有率,几乎占全球绿氢市场收益的一半,并在整个绿氢市场估计和预测期内保持主导地位。
随着人口增长、都市化和经济发展导致汽车数量的增加以及对高效交通系统的需求,交通需求正在稳步增长。此外,绿氢作为跨多个行业(包括交通、工业、发电和供暖)的能源载体的多功能性正在促进全球需求的成长。在难以电气化的行业中替代石化燃料并作为多功能清洁能源解决方案的潜力引起了人们的极大兴趣。
此外,国际伙伴关係和合作正在促进绿氢计划的知识、最佳实践和投资的交流,加速全球绿氢市场的成长轨迹。由于这些综合因素,绿氢市场正在迅速扩大,并成为全球转型为永续低碳能源系统的关键参与者。
目录
第一章简介
第 2 章执行摘要
第三章市场概况
- 市场定义和范围
- 主要发现
- 影响因素
- 主要投资机会
- 波特五力分析
- 市场动态
- 促进因素
- 全球日益致力于实现净零碳排放
- 电解槽技术的进步
- 抑制因素
- 製造成本高
- 机会
- 政府扶持政策
- 促进因素
- 市场占有率分析
- 价值链分析
- 关键监管分析
- 专利形势
第四章绿氢市场:依技术分类
- 概述
- 质子交换膜电解槽
- 碱性电解槽
- 固体氧化物电解槽
第五章 绿色氢能市场:依应用分类
- 概述
- 发电
- 运输
- 其他的
第六章 绿氢市场:依最终用途产业
- 概述
- 食品和饮料
- 医疗保健
- 化学
- 石油化学
- 玻璃
- 其他的
第七章 绿氢能市场:依地区
- 概述
- 北美洲
- 美国
- 加拿大
- 墨西哥
- 欧洲
- 德国
- 法国
- 义大利
- 英国
- 西班牙
- 其他的
- 亚太地区
- 中国
- 印度
- 日本
- 韩国
- 澳洲
- 其他的
- 拉丁美洲/中东/非洲
- 巴西
- 南阿拉伯
- 南非
- 其他的
第八章 竞争形势
- 介绍
- 关键成功策略
- 10家主要企业产品图谱
- 竞争对手仪表板
- 竞争热图
- 2022年主要企业定位
第九章 公司简介
- Green Hydrogen Systems
- Royal Dutch Shell
- Air Liquide
- Enapter
- Plug Power Inc.
- Ballard Power Systems
- Linde Plc
- Reliance Industries
- GAIL(India)Limited
- Adani Green Energy Ltd
According to a new report published by Allied Market Research, titled, "Green Hydrogen Market," The green hydrogen market was valued at $2.5 billion in 2022, and is estimated to reach $143.8 billion by 2032, growing at a CAGR of 50.3% from 2023 to 2032.
Green hydrogen is produced by water electrolysis. In this process, renewable electricity is used to split water molecules into hydrogen and oxygen gas. Its main applications include heavy industry, such as high temperature processes alongside electricity, feedstock for production of green ammonia and organic chemicals, as an alternative to coal-derived coke for steel manufacturing; long-haul transport, such as shipping and aviation; and long-term energy storage.
North America green hydrogen industry poised significant growth during forecast period owing to cost declines in green hydrogen production and infrastructure. Green hydrogen is expected to play a major role in decarbonizing the economy and transitioning to a clean energy future. According to the International Energy Agency, in North America, green hydrogen applications in heavy industries and long-distance transport currently account for only 0.1% of all hydrogen investments globally.
The global market for green hydrogen, specifically electrolysis, is expected to grow exponentially to a global installed base of 550 GW of electrolyzers by 2030, up from less than 11 GW in 2022. The U.S. reached an impressive 40% reduction in carbon dioxide emissions from the electricity sector between 2005 and 2020, with the current administration targeting a 100 percent reduction by 2035. Furthermore, offer a new clean hydrogen-specific production tax credit (PTC) as part of the Inflation Reduction Act (IRA) with up to $3 per clean hydrogen kg tax incentive for projects.
Moreover, supportive policies, incentives, and ambitious renewable energy targets set by governments globally have propelled investments and initiatives in green hydrogen production and infrastructure. Governments, along with private industries and research institutions, have collaborated to drive innovation, reduce production costs, and scale up green hydrogen projects. Based on application, transport segment held the highest market share in 2022, accounting for nearly half of the global green hydrogen market revenue, and is estimated to maintain its leadership status throughout the green hydrogen market forecast.
Demand for transportation has steadily increased owing to population growth, urbanization, and economic development contributing to a rise in the number of vehicles and the need for efficient transportation systems. In addition, the versatility of green hydrogen as an energy carrier across multiple sectors, including transportation, industry, power generation, and heating, contributes to its increase in global demand. Its potential to replace fossil fuels in hard-to-electrify sectors and serve as a versatile, clean energy solution has gained significant interest.
Furthermore, international partnerships and collaborations have fostered the exchange of knowledge, best practices, and investments in green hydrogen projects, accelerating global green hydrogen market growth trajectory. As a result of these combined factors, the green hydrogen market has experienced rapid expansion, positioning itself as a critical player in the transition toward sustainable and low-carbon energy systems on a global scale.
The green hydrogen market is segmented on the basis of technology, application, end-use industry, and region. On the basis of technology, it is classified into proton exchange membrane electrolyzer, alkaline electrolyzer, and solid oxide electrolyzer. On the basis of application, it is divided into power generation, transport, and others. On the basis of end-use industry, it is fragmented into food and beverages, medical, chemical, petrochemicals, glass, others. On the basis of region, the market is studied across North America, Europe, Asia-Pacific, and LAMEA. Presently, Europe accounts for the largest share of the market, followed by Asia-Pacific and North America.
In addition, this report analyses green hydrogen market trends across different applications such as into power generation, transport, and others. Furthermore, it also analyses green hydrogen market size across end users such as food and beverages, medical, chemical, petrochemicals, glass, others. Moreover, the report analyses the market trends across North America, Europe, Asia-Pacific, and LAMEA. In addition, it also highlights market dynamics that impact the growth of the global green hydrogen market, such as key drivers, restraints, growth green hydrogen market opportunities, and the role of different key players in the market. Further, the report presents the quantitative data in terms of value.
Green Hydrogen Systems, Air Liquide, Shell plc, Enapter S.r.l., Plug Power Inc., Ballard Power Systems, Linde plc, Reliance Industries, GAIL (India) Limited and Adani Green Energy Ltd. are some of the major players discussed in the report. The report provides a detailed green hydrogen market analysis of these key players. These players have adopted different strategies such as new product launches, collaborations, expansion, joint ventures, agreements, and others to increase their green hydrogen market share and maintain dominant shares in different regions. Further, key strategies adopted by potential market leaders to facilitate effective planning have been discussed under green hydrogen market scope in this report.
Key Benefits For Stakeholders
- This report provides a quantitative analysis of the market segments, current trends, estimations, and dynamics of the green hydrogen market analysis from 2022 to 2032 to identify the prevailing green hydrogen market opportunities.
- The market research is offered along with information related to key drivers, restraints, and opportunities.
- Porter's five forces analysis highlights the potency of buyers and suppliers to enable stakeholders make profit-oriented business decisions and strengthen their supplier-buyer network.
- In-depth analysis of the green hydrogen market segmentation assists to determine the prevailing market opportunities.
- Major countries in each region are mapped according to their revenue contribution to the global market.
- Market player positioning facilitates benchmarking and provides a clear understanding of the present position of the market players.
- The report includes the analysis of the regional as well as global green hydrogen market trends, key players, market segments, application areas, and market growth strategies.
Additional benefits you will get with this purchase are:
- Quarterly Update and* (only available with a corporate license, on listed price)
- 5 additional Company Profile of client Choice pre- or Post-purchase, as a free update.
- Free Upcoming Version on the Purchase of Five and Enterprise User License.
- 16 analyst hours of support* (post-purchase, if you find additional data requirements upon review of the report, you may receive support amounting to 16 analyst hours to solve questions, and post-sale queries)
- 15% Free Customization* (in case the scope or segment of the report does not match your requirements, 15% is equivalent to 3 working days of free work, applicable once)
- Free data Pack on the Five and Enterprise User License. (Excel version of the report)
- Free Updated report if the report is 6-12 months old or older.
- 24-hour priority response*
- Free Industry updates and white papers.
Possible Customization with this report (with additional cost and timeline, please talk to the sales executive to know more)
- End user preferences and pain points
- Investment Opportunities
- Supply Chain Analysis & Vendor Margins
- Upcoming/New Entrant by Regions
- Technology Trend Analysis
- Market share analysis of players by products/segments
- New Product Development/ Product Matrix of Key Players
- Regulatory Guidelines
- Surgical procedures data- specific or multiple surgery types
- Additional company profiles with specific to client's interest
- Additional country or region analysis- market size and forecast
- Criss-cross segment analysis- market size and forecast
- Historic market data
- Key player details (including location, contact details, supplier/vendor network etc. in excel format)
- SWOT Analysis
Key Market Segments
By Technology
- Proton exchange membrane electrolyzer
- Alkaline electrolyzer
- Solid oxide electrolyzer
By Application
- Power generation
- Transport
- Others
By End-use industry
- Food and beverages
- Medical
- Chemical
- Petrochemicals
- Glass
- Others
By Region
- North America
- U.S.
- Canada
- Mexico
- Europe
- Germany
- France
- Italy
- UK
- Spain
- Rest of Europe
- Asia-Pacific
- China
- India
- Japan
- South Korea
- Australia
- Rest of Asia-Pacific
- LAMEA
- Brazil
- South Arabia
- South Africa
- Rest of LAMEA
Key Market Players:
- Air Liquide
- Ballard Power Systems
- Plug Power Inc.
- Royal Dutch Shell
- Adani Green Energy Ltd
- Green Hydrogen Systems
- Linde Plc
- Reliance Industries
- Enapter
- GAIL (India) Limited
TABLE OF CONTENTS
CHAPTER 1: INTRODUCTION
- 1.1. Report description
- 1.2. Key market segments
- 1.3. Key benefits to the stakeholders
- 1.4. Research methodology
- 1.4.1. Primary research
- 1.4.2. Secondary research
- 1.4.3. Analyst tools and models
CHAPTER 2: EXECUTIVE SUMMARY
- 2.1. CXO Perspective
CHAPTER 3: MARKET OVERVIEW
- 3.1. Market definition and scope
- 3.2. Key findings
- 3.2.1. Top impacting factors
- 3.2.2. Top investment pockets
- 3.3. Porter's five forces analysis
- 3.3.1. Low bargaining power of suppliers
- 3.3.2. Low threat of new entrants
- 3.3.3. Low threat of substitutes
- 3.3.4. Low intensity of rivalry
- 3.3.5. Low bargaining power of buyers
- 3.4. Market dynamics
- 3.4.1. Drivers
- 3.4.1.1. Increase in global commitment to achieve net-zero carbon emissions
- 3.4.1.2. Advancements in technologies for electrolyzers
- 3.4.2. Restraints
- 3.4.2.1. High production cost
- 3.4.3. Opportunities
- 3.4.3.1. Supportive government policies
- 3.4.1. Drivers
- 3.5. Market Share Analysis
- 3.6. Value Chain Analysis
- 3.7. Key Regulation Analysis
- 3.8. Patent Landscape
CHAPTER 4: GREEN HYDROGEN MARKET, BY TECHNOLOGY
- 4.1. Overview
- 4.1.1. Market size and forecast
- 4.2. Proton exchange membrane electrolyzer
- 4.2.1. Key market trends, growth factors and opportunities
- 4.2.2. Market size and forecast, by region
- 4.2.3. Market share analysis by country
- 4.3. Alkaline electrolyzer
- 4.3.1. Key market trends, growth factors and opportunities
- 4.3.2. Market size and forecast, by region
- 4.3.3. Market share analysis by country
- 4.4. Solid oxide electrolyzer
- 4.4.1. Key market trends, growth factors and opportunities
- 4.4.2. Market size and forecast, by region
- 4.4.3. Market share analysis by country
CHAPTER 5: GREEN HYDROGEN MARKET, BY APPLICATION
- 5.1. Overview
- 5.1.1. Market size and forecast
- 5.2. Power generation
- 5.2.1. Key market trends, growth factors and opportunities
- 5.2.2. Market size and forecast, by region
- 5.2.3. Market share analysis by country
- 5.3. Transport
- 5.3.1. Key market trends, growth factors and opportunities
- 5.3.2. Market size and forecast, by region
- 5.3.3. Market share analysis by country
- 5.4. Others
- 5.4.1. Key market trends, growth factors and opportunities
- 5.4.2. Market size and forecast, by region
- 5.4.3. Market share analysis by country
CHAPTER 6: GREEN HYDROGEN MARKET, BY END-USE INDUSTRY
- 6.1. Overview
- 6.1.1. Market size and forecast
- 6.2. Food and beverages
- 6.2.1. Key market trends, growth factors and opportunities
- 6.2.2. Market size and forecast, by region
- 6.2.3. Market share analysis by country
- 6.3. Medical
- 6.3.1. Key market trends, growth factors and opportunities
- 6.3.2. Market size and forecast, by region
- 6.3.3. Market share analysis by country
- 6.4. Chemical
- 6.4.1. Key market trends, growth factors and opportunities
- 6.4.2. Market size and forecast, by region
- 6.4.3. Market share analysis by country
- 6.5. Petrochemicals
- 6.5.1. Key market trends, growth factors and opportunities
- 6.5.2. Market size and forecast, by region
- 6.5.3. Market share analysis by country
- 6.6. Glass
- 6.6.1. Key market trends, growth factors and opportunities
- 6.6.2. Market size and forecast, by region
- 6.6.3. Market share analysis by country
- 6.7. Others
- 6.7.1. Key market trends, growth factors and opportunities
- 6.7.2. Market size and forecast, by region
- 6.7.3. Market share analysis by country
CHAPTER 7: GREEN HYDROGEN MARKET, BY REGION
- 7.1. Overview
- 7.1.1. Market size and forecast By Region
- 7.2. North America
- 7.2.1. Key market trends, growth factors and opportunities
- 7.2.2. Market size and forecast, by Technology
- 7.2.3. Market size and forecast, by Application
- 7.2.4. Market size and forecast, by End-use industry
- 7.2.5. Market size and forecast, by country
- 7.2.5.1. U.S.
- 7.2.5.1.1. Market size and forecast, by Technology
- 7.2.5.1.2. Market size and forecast, by Application
- 7.2.5.1.3. Market size and forecast, by End-use industry
- 7.2.5.2. Canada
- 7.2.5.2.1. Market size and forecast, by Technology
- 7.2.5.2.2. Market size and forecast, by Application
- 7.2.5.2.3. Market size and forecast, by End-use industry
- 7.2.5.3. Mexico
- 7.2.5.3.1. Market size and forecast, by Technology
- 7.2.5.3.2. Market size and forecast, by Application
- 7.2.5.3.3. Market size and forecast, by End-use industry
- 7.3. Europe
- 7.3.1. Key market trends, growth factors and opportunities
- 7.3.2. Market size and forecast, by Technology
- 7.3.3. Market size and forecast, by Application
- 7.3.4. Market size and forecast, by End-use industry
- 7.3.5. Market size and forecast, by country
- 7.3.5.1. Germany
- 7.3.5.1.1. Market size and forecast, by Technology
- 7.3.5.1.2. Market size and forecast, by Application
- 7.3.5.1.3. Market size and forecast, by End-use industry
- 7.3.5.2. France
- 7.3.5.2.1. Market size and forecast, by Technology
- 7.3.5.2.2. Market size and forecast, by Application
- 7.3.5.2.3. Market size and forecast, by End-use industry
- 7.3.5.3. Italy
- 7.3.5.3.1. Market size and forecast, by Technology
- 7.3.5.3.2. Market size and forecast, by Application
- 7.3.5.3.3. Market size and forecast, by End-use industry
- 7.3.5.4. UK
- 7.3.5.4.1. Market size and forecast, by Technology
- 7.3.5.4.2. Market size and forecast, by Application
- 7.3.5.4.3. Market size and forecast, by End-use industry
- 7.3.5.5. Spain
- 7.3.5.5.1. Market size and forecast, by Technology
- 7.3.5.5.2. Market size and forecast, by Application
- 7.3.5.5.3. Market size and forecast, by End-use industry
- 7.3.5.6. Rest of Europe
- 7.3.5.6.1. Market size and forecast, by Technology
- 7.3.5.6.2. Market size and forecast, by Application
- 7.3.5.6.3. Market size and forecast, by End-use industry
- 7.4. Asia-Pacific
- 7.4.1. Key market trends, growth factors and opportunities
- 7.4.2. Market size and forecast, by Technology
- 7.4.3. Market size and forecast, by Application
- 7.4.4. Market size and forecast, by End-use industry
- 7.4.5. Market size and forecast, by country
- 7.4.5.1. China
- 7.4.5.1.1. Market size and forecast, by Technology
- 7.4.5.1.2. Market size and forecast, by Application
- 7.4.5.1.3. Market size and forecast, by End-use industry
- 7.4.5.2. India
- 7.4.5.2.1. Market size and forecast, by Technology
- 7.4.5.2.2. Market size and forecast, by Application
- 7.4.5.2.3. Market size and forecast, by End-use industry
- 7.4.5.3. Japan
- 7.4.5.3.1. Market size and forecast, by Technology
- 7.4.5.3.2. Market size and forecast, by Application
- 7.4.5.3.3. Market size and forecast, by End-use industry
- 7.4.5.4. South Korea
- 7.4.5.4.1. Market size and forecast, by Technology
- 7.4.5.4.2. Market size and forecast, by Application
- 7.4.5.4.3. Market size and forecast, by End-use industry
- 7.4.5.5. Australia
- 7.4.5.5.1. Market size and forecast, by Technology
- 7.4.5.5.2. Market size and forecast, by Application
- 7.4.5.5.3. Market size and forecast, by End-use industry
- 7.4.5.6. Rest of Asia-Pacific
- 7.4.5.6.1. Market size and forecast, by Technology
- 7.4.5.6.2. Market size and forecast, by Application
- 7.4.5.6.3. Market size and forecast, by End-use industry
- 7.5. LAMEA
- 7.5.1. Key market trends, growth factors and opportunities
- 7.5.2. Market size and forecast, by Technology
- 7.5.3. Market size and forecast, by Application
- 7.5.4. Market size and forecast, by End-use industry
- 7.5.5. Market size and forecast, by country
- 7.5.5.1. Brazil
- 7.5.5.1.1. Market size and forecast, by Technology
- 7.5.5.1.2. Market size and forecast, by Application
- 7.5.5.1.3. Market size and forecast, by End-use industry
- 7.5.5.2. South Arabia
- 7.5.5.2.1. Market size and forecast, by Technology
- 7.5.5.2.2. Market size and forecast, by Application
- 7.5.5.2.3. Market size and forecast, by End-use industry
- 7.5.5.3. South Africa
- 7.5.5.3.1. Market size and forecast, by Technology
- 7.5.5.3.2. Market size and forecast, by Application
- 7.5.5.3.3. Market size and forecast, by End-use industry
- 7.5.5.4. Rest of LAMEA
- 7.5.5.4.1. Market size and forecast, by Technology
- 7.5.5.4.2. Market size and forecast, by Application
- 7.5.5.4.3. Market size and forecast, by End-use industry
CHAPTER 8: COMPETITIVE LANDSCAPE
- 8.1. Introduction
- 8.2. Top winning strategies
- 8.3. Product mapping of top 10 player
- 8.4. Competitive dashboard
- 8.5. Competitive heatmap
- 8.6. Top player positioning, 2022
CHAPTER 9: COMPANY PROFILES
- 9.1. Green Hydrogen Systems
- 9.1.1. Company overview
- 9.1.2. Key executives
- 9.1.3. Company snapshot
- 9.1.4. Operating business segments
- 9.1.5. Product portfolio
- 9.1.6. Key strategic moves and developments
- 9.2. Royal Dutch Shell
- 9.2.1. Company overview
- 9.2.2. Key executives
- 9.2.3. Company snapshot
- 9.2.4. Operating business segments
- 9.2.5. Product portfolio
- 9.2.6. Business performance
- 9.2.7. Key strategic moves and developments
- 9.3. Air Liquide
- 9.3.1. Company overview
- 9.3.2. Key executives
- 9.3.3. Company snapshot
- 9.3.4. Operating business segments
- 9.3.5. Product portfolio
- 9.3.6. Business performance
- 9.3.7. Key strategic moves and developments
- 9.4. Enapter
- 9.4.1. Company overview
- 9.4.2. Key executives
- 9.4.3. Company snapshot
- 9.4.4. Operating business segments
- 9.4.5. Product portfolio
- 9.4.6. Business performance
- 9.4.7. Key strategic moves and developments
- 9.5. Plug Power Inc.
- 9.5.1. Company overview
- 9.5.2. Key executives
- 9.5.3. Company snapshot
- 9.5.4. Operating business segments
- 9.5.5. Product portfolio
- 9.5.6. Business performance
- 9.5.7. Key strategic moves and developments
- 9.6. Ballard Power Systems
- 9.6.1. Company overview
- 9.6.2. Key executives
- 9.6.3. Company snapshot
- 9.6.4. Operating business segments
- 9.6.5. Product portfolio
- 9.6.6. Business performance
- 9.7. Linde Plc
- 9.7.1. Company overview
- 9.7.2. Key executives
- 9.7.3. Company snapshot
- 9.7.4. Operating business segments
- 9.7.5. Product portfolio
- 9.7.6. Business performance
- 9.7.7. Key strategic moves and developments
- 9.8. Reliance Industries
- 9.8.1. Company overview
- 9.8.2. Key executives
- 9.8.3. Company snapshot
- 9.8.4. Operating business segments
- 9.8.5. Product portfolio
- 9.8.6. Business performance
- 9.9. GAIL (India) Limited
- 9.9.1. Company overview
- 9.9.2. Key executives
- 9.9.3. Company snapshot
- 9.9.4. Operating business segments
- 9.9.5. Product portfolio
- 9.9.6. Business performance
- 9.10. Adani Green Energy Ltd
- 9.10.1. Company overview
- 9.10.2. Key executives
- 9.10.3. Company snapshot
- 9.10.4. Operating business segments
- 9.10.5. Product portfolio
- 9.10.6. Business performance
LIST OF TABLES
- TABLE 01. GLOBAL GREEN HYDROGEN MARKET, BY TECHNOLOGY, 2022-2032 ($MILLION)
- TABLE 02. GLOBAL GREEN HYDROGEN MARKET, BY TECHNOLOGY, 2022-2032 (KILOTON)
- TABLE 03. GREEN HYDROGEN MARKET FOR PROTON EXCHANGE MEMBRANE ELECTROLYZER, BY REGION, 2022-2032 ($MILLION)
- TABLE 04. GREEN HYDROGEN MARKET FOR PROTON EXCHANGE MEMBRANE ELECTROLYZER, BY REGION, 2022-2032 (KILOTON)
- TABLE 05. GREEN HYDROGEN MARKET FOR ALKALINE ELECTROLYZER, BY REGION, 2022-2032 ($MILLION)
- TABLE 06. GREEN HYDROGEN MARKET FOR ALKALINE ELECTROLYZER, BY REGION, 2022-2032 (KILOTON)
- TABLE 07. GREEN HYDROGEN MARKET FOR SOLID OXIDE ELECTROLYZER, BY REGION, 2022-2032 ($MILLION)
- TABLE 08. GREEN HYDROGEN MARKET FOR SOLID OXIDE ELECTROLYZER, BY REGION, 2022-2032 (KILOTON)
- TABLE 09. GLOBAL GREEN HYDROGEN MARKET, BY APPLICATION, 2022-2032 ($MILLION)
- TABLE 10. GLOBAL GREEN HYDROGEN MARKET, BY APPLICATION, 2022-2032 (KILOTON)
- TABLE 11. GREEN HYDROGEN MARKET FOR POWER GENERATION, BY REGION, 2022-2032 ($MILLION)
- TABLE 12. GREEN HYDROGEN MARKET FOR POWER GENERATION, BY REGION, 2022-2032 (KILOTON)
- TABLE 13. GREEN HYDROGEN MARKET FOR TRANSPORT, BY REGION, 2022-2032 ($MILLION)
- TABLE 14. GREEN HYDROGEN MARKET FOR TRANSPORT, BY REGION, 2022-2032 (KILOTON)
- TABLE 15. GREEN HYDROGEN MARKET FOR OTHERS, BY REGION, 2022-2032 ($MILLION)
- TABLE 16. GREEN HYDROGEN MARKET FOR OTHERS, BY REGION, 2022-2032 (KILOTON)
- TABLE 17. GLOBAL GREEN HYDROGEN MARKET, BY END-USE INDUSTRY, 2022-2032 ($MILLION)
- TABLE 18. GLOBAL GREEN HYDROGEN MARKET, BY END-USE INDUSTRY, 2022-2032 (KILOTON)
- TABLE 19. GREEN HYDROGEN MARKET FOR FOOD AND BEVERAGES, BY REGION, 2022-2032 ($MILLION)
- TABLE 20. GREEN HYDROGEN MARKET FOR FOOD AND BEVERAGES, BY REGION, 2022-2032 (KILOTON)
- TABLE 21. GREEN HYDROGEN MARKET FOR MEDICAL, BY REGION, 2022-2032 ($MILLION)
- TABLE 22. GREEN HYDROGEN MARKET FOR MEDICAL, BY REGION, 2022-2032 (KILOTON)
- TABLE 23. GREEN HYDROGEN MARKET FOR CHEMICAL, BY REGION, 2022-2032 ($MILLION)
- TABLE 24. GREEN HYDROGEN MARKET FOR CHEMICAL, BY REGION, 2022-2032 (KILOTON)
- TABLE 25. GREEN HYDROGEN MARKET FOR PETROCHEMICALS, BY REGION, 2022-2032 ($MILLION)
- TABLE 26. GREEN HYDROGEN MARKET FOR PETROCHEMICALS, BY REGION, 2022-2032 (KILOTON)
- TABLE 27. GREEN HYDROGEN MARKET FOR GLASS, BY REGION, 2022-2032 ($MILLION)
- TABLE 28. GREEN HYDROGEN MARKET FOR GLASS, BY REGION, 2022-2032 (KILOTON)
- TABLE 29. GREEN HYDROGEN MARKET FOR OTHERS, BY REGION, 2022-2032 ($MILLION)
- TABLE 30. GREEN HYDROGEN MARKET FOR OTHERS, BY REGION, 2022-2032 (KILOTON)
- TABLE 31. GREEN HYDROGEN MARKET, BY REGION, 2022-2032 ($MILLION)
- TABLE 32. GREEN HYDROGEN MARKET, BY REGION, 2022-2032 (KILOTON)
- TABLE 33. NORTH AMERICA GREEN HYDROGEN MARKET, BY TECHNOLOGY, 2022-2032 ($MILLION)
- TABLE 34. NORTH AMERICA GREEN HYDROGEN MARKET, BY TECHNOLOGY, 2022-2032 (KILOTON)
- TABLE 35. NORTH AMERICA GREEN HYDROGEN MARKET, BY APPLICATION, 2022-2032 ($MILLION)
- TABLE 36. NORTH AMERICA GREEN HYDROGEN MARKET, BY APPLICATION, 2022-2032 (KILOTON)
- TABLE 37. NORTH AMERICA GREEN HYDROGEN MARKET, BY END-USE INDUSTRY, 2022-2032 ($MILLION)
- TABLE 38. NORTH AMERICA GREEN HYDROGEN MARKET, BY END-USE INDUSTRY, 2022-2032 (KILOTON)
- TABLE 39. NORTH AMERICA GREEN HYDROGEN MARKET, BY COUNTRY, 2022-2032 ($MILLION)
- TABLE 40. NORTH AMERICA GREEN HYDROGEN MARKET, BY COUNTRY, 2022-2032 (KILOTON)
- TABLE 41. U.S. GREEN HYDROGEN MARKET, BY TECHNOLOGY, 2022-2032 ($MILLION)
- TABLE 42. U.S. GREEN HYDROGEN MARKET, BY TECHNOLOGY, 2022-2032 (KILOTON)
- TABLE 43. U.S. GREEN HYDROGEN MARKET, BY APPLICATION, 2022-2032 ($MILLION)
- TABLE 44. U.S. GREEN HYDROGEN MARKET, BY APPLICATION, 2022-2032 (KILOTON)
- TABLE 45. U.S. GREEN HYDROGEN MARKET, BY END-USE INDUSTRY, 2022-2032 ($MILLION)
- TABLE 46. U.S. GREEN HYDROGEN MARKET, BY END-USE INDUSTRY, 2022-2032 (KILOTON)
- TABLE 47. CANADA GREEN HYDROGEN MARKET, BY TECHNOLOGY, 2022-2032 ($MILLION)
- TABLE 48. CANADA GREEN HYDROGEN MARKET, BY TECHNOLOGY, 2022-2032 (KILOTON)
- TABLE 49. CANADA GREEN HYDROGEN MARKET, BY APPLICATION, 2022-2032 ($MILLION)
- TABLE 50. CANADA GREEN HYDROGEN MARKET, BY APPLICATION, 2022-2032 (KILOTON)
- TABLE 51. CANADA GREEN HYDROGEN MARKET, BY END-USE INDUSTRY, 2022-2032 ($MILLION)
- TABLE 52. CANADA GREEN HYDROGEN MARKET, BY END-USE INDUSTRY, 2022-2032 (KILOTON)
- TABLE 53. MEXICO GREEN HYDROGEN MARKET, BY TECHNOLOGY, 2022-2032 ($MILLION)
- TABLE 54. MEXICO GREEN HYDROGEN MARKET, BY TECHNOLOGY, 2022-2032 (KILOTON)
- TABLE 55. MEXICO GREEN HYDROGEN MARKET, BY APPLICATION, 2022-2032 ($MILLION)
- TABLE 56. MEXICO GREEN HYDROGEN MARKET, BY APPLICATION, 2022-2032 (KILOTON)
- TABLE 57. MEXICO GREEN HYDROGEN MARKET, BY END-USE INDUSTRY, 2022-2032 ($MILLION)
- TABLE 58. MEXICO GREEN HYDROGEN MARKET, BY END-USE INDUSTRY, 2022-2032 (KILOTON)
- TABLE 59. EUROPE GREEN HYDROGEN MARKET, BY TECHNOLOGY, 2022-2032 ($MILLION)
- TABLE 60. EUROPE GREEN HYDROGEN MARKET, BY TECHNOLOGY, 2022-2032 (KILOTON)
- TABLE 61. EUROPE GREEN HYDROGEN MARKET, BY APPLICATION, 2022-2032 ($MILLION)
- TABLE 62. EUROPE GREEN HYDROGEN MARKET, BY APPLICATION, 2022-2032 (KILOTON)
- TABLE 63. EUROPE GREEN HYDROGEN MARKET, BY END-USE INDUSTRY, 2022-2032 ($MILLION)
- TABLE 64. EUROPE GREEN HYDROGEN MARKET, BY END-USE INDUSTRY, 2022-2032 (KILOTON)
- TABLE 65. EUROPE GREEN HYDROGEN MARKET, BY COUNTRY, 2022-2032 ($MILLION)
- TABLE 66. EUROPE GREEN HYDROGEN MARKET, BY COUNTRY, 2022-2032 (KILOTON)
- TABLE 67. GERMANY GREEN HYDROGEN MARKET, BY TECHNOLOGY, 2022-2032 ($MILLION)
- TABLE 68. GERMANY GREEN HYDROGEN MARKET, BY TECHNOLOGY, 2022-2032 (KILOTON)
- TABLE 69. GERMANY GREEN HYDROGEN MARKET, BY APPLICATION, 2022-2032 ($MILLION)
- TABLE 70. GERMANY GREEN HYDROGEN MARKET, BY APPLICATION, 2022-2032 (KILOTON)
- TABLE 71. GERMANY GREEN HYDROGEN MARKET, BY END-USE INDUSTRY, 2022-2032 ($MILLION)
- TABLE 72. GERMANY GREEN HYDROGEN MARKET, BY END-USE INDUSTRY, 2022-2032 (KILOTON)
- TABLE 73. FRANCE GREEN HYDROGEN MARKET, BY TECHNOLOGY, 2022-2032 ($MILLION)
- TABLE 74. FRANCE GREEN HYDROGEN MARKET, BY TECHNOLOGY, 2022-2032 (KILOTON)
- TABLE 75. FRANCE GREEN HYDROGEN MARKET, BY APPLICATION, 2022-2032 ($MILLION)
- TABLE 76. FRANCE GREEN HYDROGEN MARKET, BY APPLICATION, 2022-2032 (KILOTON)
- TABLE 77. FRANCE GREEN HYDROGEN MARKET, BY END-USE INDUSTRY, 2022-2032 ($MILLION)
- TABLE 78. FRANCE GREEN HYDROGEN MARKET, BY END-USE INDUSTRY, 2022-2032 (KILOTON)
- TABLE 79. ITALY GREEN HYDROGEN MARKET, BY TECHNOLOGY, 2022-2032 ($MILLION)
- TABLE 80. ITALY GREEN HYDROGEN MARKET, BY TECHNOLOGY, 2022-2032 (KILOTON)
- TABLE 81. ITALY GREEN HYDROGEN MARKET, BY APPLICATION, 2022-2032 ($MILLION)
- TABLE 82. ITALY GREEN HYDROGEN MARKET, BY APPLICATION, 2022-2032 (KILOTON)
- TABLE 83. ITALY GREEN HYDROGEN MARKET, BY END-USE INDUSTRY, 2022-2032 ($MILLION)
- TABLE 84. ITALY GREEN HYDROGEN MARKET, BY END-USE INDUSTRY, 2022-2032 (KILOTON)
- TABLE 85. UK GREEN HYDROGEN MARKET, BY TECHNOLOGY, 2022-2032 ($MILLION)
- TABLE 86. UK GREEN HYDROGEN MARKET, BY TECHNOLOGY, 2022-2032 (KILOTON)
- TABLE 87. UK GREEN HYDROGEN MARKET, BY APPLICATION, 2022-2032 ($MILLION)
- TABLE 88. UK GREEN HYDROGEN MARKET, BY APPLICATION, 2022-2032 (KILOTON)
- TABLE 89. UK GREEN HYDROGEN MARKET, BY END-USE INDUSTRY, 2022-2032 ($MILLION)
- TABLE 90. UK GREEN HYDROGEN MARKET, BY END-USE INDUSTRY, 2022-2032 (KILOTON)
- TABLE 91. SPAIN GREEN HYDROGEN MARKET, BY TECHNOLOGY, 2022-2032 ($MILLION)
- TABLE 92. SPAIN GREEN HYDROGEN MARKET, BY TECHNOLOGY, 2022-2032 (KILOTON)
- TABLE 93. SPAIN GREEN HYDROGEN MARKET, BY APPLICATION, 2022-2032 ($MILLION)
- TABLE 94. SPAIN GREEN HYDROGEN MARKET, BY APPLICATION, 2022-2032 (KILOTON)
- TABLE 95. SPAIN GREEN HYDROGEN MARKET, BY END-USE INDUSTRY, 2022-2032 ($MILLION)
- TABLE 96. SPAIN GREEN HYDROGEN MARKET, BY END-USE INDUSTRY, 2022-2032 (KILOTON)
- TABLE 97. REST OF EUROPE GREEN HYDROGEN MARKET, BY TECHNOLOGY, 2022-2032 ($MILLION)
- TABLE 98. REST OF EUROPE GREEN HYDROGEN MARKET, BY TECHNOLOGY, 2022-2032 (KILOTON)
- TABLE 99. REST OF EUROPE GREEN HYDROGEN MARKET, BY APPLICATION, 2022-2032 ($MILLION)
- TABLE 100. REST OF EUROPE GREEN HYDROGEN MARKET, BY APPLICATION, 2022-2032 (KILOTON)
- TABLE 101. REST OF EUROPE GREEN HYDROGEN MARKET, BY END-USE INDUSTRY, 2022-2032 ($MILLION)
- TABLE 102. REST OF EUROPE GREEN HYDROGEN MARKET, BY END-USE INDUSTRY, 2022-2032 (KILOTON)
- TABLE 103. ASIA-PACIFIC GREEN HYDROGEN MARKET, BY TECHNOLOGY, 2022-2032 ($MILLION)
- TABLE 104. ASIA-PACIFIC GREEN HYDROGEN MARKET, BY TECHNOLOGY, 2022-2032 (KILOTON)
- TABLE 105. ASIA-PACIFIC GREEN HYDROGEN MARKET, BY APPLICATION, 2022-2032 ($MILLION)
- TABLE 106. ASIA-PACIFIC GREEN HYDROGEN MARKET, BY APPLICATION, 2022-2032 (KILOTON)
- TABLE 107. ASIA-PACIFIC GREEN HYDROGEN MARKET, BY END-USE INDUSTRY, 2022-2032 ($MILLION)
- TABLE 108. ASIA-PACIFIC GREEN HYDROGEN MARKET, BY END-USE INDUSTRY, 2022-2032 (KILOTON)
- TABLE 109. ASIA-PACIFIC GREEN HYDROGEN MARKET, BY COUNTRY, 2022-2032 ($MILLION)
- TABLE 110. ASIA-PACIFIC GREEN HYDROGEN MARKET, BY COUNTRY, 2022-2032 (KILOTON)
- TABLE 111. CHINA GREEN HYDROGEN MARKET, BY TECHNOLOGY, 2022-2032 ($MILLION)
- TABLE 112. CHINA GREEN HYDROGEN MARKET, BY TECHNOLOGY, 2022-2032 (KILOTON)
- TABLE 113. CHINA GREEN HYDROGEN MARKET, BY APPLICATION, 2022-2032 ($MILLION)
- TABLE 114. CHINA GREEN HYDROGEN MARKET, BY APPLICATION, 2022-2032 (KILOTON)
- TABLE 115. CHINA GREEN HYDROGEN MARKET, BY END-USE INDUSTRY, 2022-2032 ($MILLION)
- TABLE 116. CHINA GREEN HYDROGEN MARKET, BY END-USE INDUSTRY, 2022-2032 (KILOTON)
- TABLE 117. INDIA GREEN HYDROGEN MARKET, BY TECHNOLOGY, 2022-2032 ($MILLION)
- TABLE 118. INDIA GREEN HYDROGEN MARKET, BY TECHNOLOGY, 2022-2032 (KILOTON)
- TABLE 119. INDIA GREEN HYDROGEN MARKET, BY APPLICATION, 2022-2032 ($MILLION)
- TABLE 120. INDIA GREEN HYDROGEN MARKET, BY APPLICATION, 2022-2032 (KILOTON)
- TABLE 121. INDIA GREEN HYDROGEN MARKET, BY END-USE INDUSTRY, 2022-2032 ($MILLION)
- TABLE 122. INDIA GREEN HYDROGEN MARKET, BY END-USE INDUSTRY, 2022-2032 (KILOTON)
- TABLE 123. JAPAN GREEN HYDROGEN MARKET, BY TECHNOLOGY, 2022-2032 ($MILLION)
- TABLE 124. JAPAN GREEN HYDROGEN MARKET, BY TECHNOLOGY, 2022-2032 (KILOTON)
- TABLE 125. JAPAN GREEN HYDROGEN MARKET, BY APPLICATION, 2022-2032 ($MILLION)
- TABLE 126. JAPAN GREEN HYDROGEN MARKET, BY APPLICATION, 2022-2032 (KILOTON)
- TABLE 127. JAPAN GREEN HYDROGEN MARKET, BY END-USE INDUSTRY, 2022-2032 ($MILLION)
- TABLE 128. JAPAN GREEN HYDROGEN MARKET, BY END-USE INDUSTRY, 2022-2032 (KILOTON)
- TABLE 129. SOUTH KOREA GREEN HYDROGEN MARKET, BY TECHNOLOGY, 2022-2032 ($MILLION)
- TABLE 130. SOUTH KOREA GREEN HYDROGEN MARKET, BY TECHNOLOGY, 2022-2032 (KILOTON)
- TABLE 131. SOUTH KOREA GREEN HYDROGEN MARKET, BY APPLICATION, 2022-2032 ($MILLION)
- TABLE 132. SOUTH KOREA GREEN HYDROGEN MARKET, BY APPLICATION, 2022-2032 (KILOTON)
- TABLE 133. SOUTH KOREA GREEN HYDROGEN MARKET, BY END-USE INDUSTRY, 2022-2032 ($MILLION)
- TABLE 134. SOUTH KOREA GREEN HYDROGEN MARKET, BY END-USE INDUSTRY, 2022-2032 (KILOTON)
- TABLE 135. AUSTRALIA GREEN HYDROGEN MARKET, BY TECHNOLOGY, 2022-2032 ($MILLION)
- TABLE 136. AUSTRALIA GREEN HYDROGEN MARKET, BY TECHNOLOGY, 2022-2032 (KILOTON)
- TABLE 137. AUSTRALIA GREEN HYDROGEN MARKET, BY APPLICATION, 2022-2032 ($MILLION)
- TABLE 138. AUSTRALIA GREEN HYDROGEN MARKET, BY APPLICATION, 2022-2032 (KILOTON)
- TABLE 139. AUSTRALIA GREEN HYDROGEN MARKET, BY END-USE INDUSTRY, 2022-2032 ($MILLION)
- TABLE 140. AUSTRALIA GREEN HYDROGEN MARKET, BY END-USE INDUSTRY, 2022-2032 (KILOTON)
- TABLE 141. REST OF ASIA-PACIFIC GREEN HYDROGEN MARKET, BY TECHNOLOGY, 2022-2032 ($MILLION)
- TABLE 142. REST OF ASIA-PACIFIC GREEN HYDROGEN MARKET, BY TECHNOLOGY, 2022-2032 (KILOTON)
- TABLE 143. REST OF ASIA-PACIFIC GREEN HYDROGEN MARKET, BY APPLICATION, 2022-2032 ($MILLION)
- TABLE 144. REST OF ASIA-PACIFIC GREEN HYDROGEN MARKET, BY APPLICATION, 2022-2032 (KILOTON)
- TABLE 145. REST OF ASIA-PACIFIC GREEN HYDROGEN MARKET, BY END-USE INDUSTRY, 2022-2032 ($MILLION)
- TABLE 146. REST OF ASIA-PACIFIC GREEN HYDROGEN MARKET, BY END-USE INDUSTRY, 2022-2032 (KILOTON)
- TABLE 147. LAMEA GREEN HYDROGEN MARKET, BY TECHNOLOGY, 2022-2032 ($MILLION)
- TABLE 148. LAMEA GREEN HYDROGEN MARKET, BY TECHNOLOGY, 2022-2032 (KILOTON)
- TABLE 149. LAMEA GREEN HYDROGEN MARKET, BY APPLICATION, 2022-2032 ($MILLION)
- TABLE 150. LAMEA GREEN HYDROGEN MARKET, BY APPLICATION, 2022-2032 (KILOTON)
- TABLE 151. LAMEA GREEN HYDROGEN MARKET, BY END-USE INDUSTRY, 2022-2032 ($MILLION)
- TABLE 152. LAMEA GREEN HYDROGEN MARKET, BY END-USE INDUSTRY, 2022-2032 (KILOTON)
- TABLE 153. LAMEA GREEN HYDROGEN MARKET, BY COUNTRY, 2022-2032 ($MILLION)
- TABLE 154. LAMEA GREEN HYDROGEN MARKET, BY COUNTRY, 2022-2032 (KILOTON)
- TABLE 155. BRAZIL GREEN HYDROGEN MARKET, BY TECHNOLOGY, 2022-2032 ($MILLION)
- TABLE 156. BRAZIL GREEN HYDROGEN MARKET, BY TECHNOLOGY, 2022-2032 (KILOTON)
- TABLE 157. BRAZIL GREEN HYDROGEN MARKET, BY APPLICATION, 2022-2032 ($MILLION)
- TABLE 158. BRAZIL GREEN HYDROGEN MARKET, BY APPLICATION, 2022-2032 (KILOTON)
- TABLE 159. BRAZIL GREEN HYDROGEN MARKET, BY END-USE INDUSTRY, 2022-2032 ($MILLION)
- TABLE 160. BRAZIL GREEN HYDROGEN MARKET, BY END-USE INDUSTRY, 2022-2032 (KILOTON)
- TABLE 161. SOUTH ARABIA GREEN HYDROGEN MARKET, BY TECHNOLOGY, 2022-2032 ($MILLION)
- TABLE 162. SOUTH ARABIA GREEN HYDROGEN MARKET, BY TECHNOLOGY, 2022-2032 (KILOTON)
- TABLE 163. SOUTH ARABIA GREEN HYDROGEN MARKET, BY APPLICATION, 2022-2032 ($MILLION)
- TABLE 164. SOUTH ARABIA GREEN HYDROGEN MARKET, BY APPLICATION, 2022-2032 (KILOTON)
- TABLE 165. SOUTH ARABIA GREEN HYDROGEN MARKET, BY END-USE INDUSTRY, 2022-2032 ($MILLION)
- TABLE 166. SOUTH ARABIA GREEN HYDROGEN MARKET, BY END-USE INDUSTRY, 2022-2032 (KILOTON)
- TABLE 167. SOUTH AFRICA GREEN HYDROGEN MARKET, BY TECHNOLOGY, 2022-2032 ($MILLION)
- TABLE 168. SOUTH AFRICA GREEN HYDROGEN MARKET, BY TECHNOLOGY, 2022-2032 (KILOTON)
- TABLE 169. SOUTH AFRICA GREEN HYDROGEN MARKET, BY APPLICATION, 2022-2032 ($MILLION)
- TABLE 170. SOUTH AFRICA GREEN HYDROGEN MARKET, BY APPLICATION, 2022-2032 (KILOTON)
- TABLE 171. SOUTH AFRICA GREEN HYDROGEN MARKET, BY END-USE INDUSTRY, 2022-2032 ($MILLION)
- TABLE 172. SOUTH AFRICA GREEN HYDROGEN MARKET, BY END-USE INDUSTRY, 2022-2032 (KILOTON)
- TABLE 173. REST OF LAMEA GREEN HYDROGEN MARKET, BY TECHNOLOGY, 2022-2032 ($MILLION)
- TABLE 174. REST OF LAMEA GREEN HYDROGEN MARKET, BY TECHNOLOGY, 2022-2032 (KILOTON)
- TABLE 175. REST OF LAMEA GREEN HYDROGEN MARKET, BY APPLICATION, 2022-2032 ($MILLION)
- TABLE 176. REST OF LAMEA GREEN HYDROGEN MARKET, BY APPLICATION, 2022-2032 (KILOTON)
- TABLE 177. REST OF LAMEA GREEN HYDROGEN MARKET, BY END-USE INDUSTRY, 2022-2032 ($MILLION)
- TABLE 178. REST OF LAMEA GREEN HYDROGEN MARKET, BY END-USE INDUSTRY, 2022-2032 (KILOTON)
- TABLE 179. GREEN HYDROGEN SYSTEMS: KEY EXECUTIVES
- TABLE 180. GREEN HYDROGEN SYSTEMS: COMPANY SNAPSHOT
- TABLE 181. GREEN HYDROGEN SYSTEMS: PRODUCT SEGMENTS
- TABLE 182. GREEN HYDROGEN SYSTEMS: PRODUCT PORTFOLIO
- TABLE 183. GREEN HYDROGEN SYSTEMS: KEY STRATERGIES
- TABLE 184. ROYAL DUTCH SHELL: KEY EXECUTIVES
- TABLE 185. ROYAL DUTCH SHELL: COMPANY SNAPSHOT
- TABLE 186. ROYAL DUTCH SHELL: PRODUCT SEGMENTS
- TABLE 187. ROYAL DUTCH SHELL: PRODUCT PORTFOLIO
- TABLE 188. ROYAL DUTCH SHELL: KEY STRATERGIES
- TABLE 189. AIR LIQUIDE: KEY EXECUTIVES
- TABLE 190. AIR LIQUIDE: COMPANY SNAPSHOT
- TABLE 191. AIR LIQUIDE: PRODUCT SEGMENTS
- TABLE 192. AIR LIQUIDE: PRODUCT PORTFOLIO
- TABLE 193. AIR LIQUIDE: KEY STRATERGIES
- TABLE 194. ENAPTER: KEY EXECUTIVES
- TABLE 195. ENAPTER: COMPANY SNAPSHOT
- TABLE 196. ENAPTER: PRODUCT SEGMENTS
- TABLE 197. ENAPTER: PRODUCT PORTFOLIO
- TABLE 198. ENAPTER: KEY STRATERGIES
- TABLE 199. PLUG POWER INC.: KEY EXECUTIVES
- TABLE 200. PLUG POWER INC.: COMPANY SNAPSHOT
- TABLE 201. PLUG POWER INC.: PRODUCT SEGMENTS
- TABLE 202. PLUG POWER INC.: PRODUCT PORTFOLIO
- TABLE 203. PLUG POWER INC.: KEY STRATERGIES
- TABLE 204. BALLARD POWER SYSTEMS: KEY EXECUTIVES
- TABLE 205. BALLARD POWER SYSTEMS: COMPANY SNAPSHOT
- TABLE 206. BALLARD POWER SYSTEMS: PRODUCT SEGMENTS
- TABLE 207. BALLARD POWER SYSTEMS: PRODUCT PORTFOLIO
- TABLE 208. LINDE PLC: KEY EXECUTIVES
- TABLE 209. LINDE PLC: COMPANY SNAPSHOT
- TABLE 210. LINDE PLC: PRODUCT SEGMENTS
- TABLE 211. LINDE PLC: PRODUCT PORTFOLIO
- TABLE 212. LINDE PLC: KEY STRATERGIES
- TABLE 213. RELIANCE INDUSTRIES: KEY EXECUTIVES
- TABLE 214. RELIANCE INDUSTRIES: COMPANY SNAPSHOT
- TABLE 215. RELIANCE INDUSTRIES: PRODUCT SEGMENTS
- TABLE 216. RELIANCE INDUSTRIES: PRODUCT PORTFOLIO
- TABLE 217. GAIL (INDIA) LIMITED: KEY EXECUTIVES
- TABLE 218. GAIL (INDIA) LIMITED: COMPANY SNAPSHOT
- TABLE 219. GAIL (INDIA) LIMITED: PRODUCT SEGMENTS
- TABLE 220. GAIL (INDIA) LIMITED: PRODUCT PORTFOLIO
- TABLE 221. ADANI GREEN ENERGY LTD: KEY EXECUTIVES
- TABLE 222. ADANI GREEN ENERGY LTD: COMPANY SNAPSHOT
- TABLE 223. ADANI GREEN ENERGY LTD: PRODUCT SEGMENTS
- TABLE 224. ADANI GREEN ENERGY LTD: PRODUCT PORTFOLIO
LIST OF FIGURES
- FIGURE 01. GREEN HYDROGEN MARKET, 2022-2032
- FIGURE 02. SEGMENTATION OF GREEN HYDROGEN MARKET,2022-2032
- FIGURE 03. TOP IMPACTING FACTORS IN GREEN HYDROGEN MARKET (2022 TO 2032)
- FIGURE 04. TOP INVESTMENT POCKETS IN GREEN HYDROGEN MARKET (2023-2032)
- FIGURE 05. LOW BARGAINING POWER OF SUPPLIERS
- FIGURE 06. LOW THREAT OF NEW ENTRANTS
- FIGURE 07. LOW THREAT OF SUBSTITUTES
- FIGURE 08. LOW INTENSITY OF RIVALRY
- FIGURE 09. LOW BARGAINING POWER OF BUYERS
- FIGURE 10. GLOBAL GREEN HYDROGEN MARKET:DRIVERS, RESTRAINTS AND OPPORTUNITIES
- FIGURE 11. IMPACT OF KEY REGULATION: GREEN HYDROGEN MARKET
- FIGURE 12. PATENT ANALYSIS BY COMPANY
- FIGURE 13. PATENT ANALYSIS BY COUNTRY
- FIGURE 14. GREEN HYDROGEN MARKET, BY TECHNOLOGY, 2022 AND 2032(%)
- FIGURE 15. COMPARATIVE SHARE ANALYSIS OF GREEN HYDROGEN MARKET FOR PROTON EXCHANGE MEMBRANE ELECTROLYZER, BY COUNTRY 2022 AND 2032(%)
- FIGURE 16. COMPARATIVE SHARE ANALYSIS OF GREEN HYDROGEN MARKET FOR ALKALINE ELECTROLYZER, BY COUNTRY 2022 AND 2032(%)
- FIGURE 17. COMPARATIVE SHARE ANALYSIS OF GREEN HYDROGEN MARKET FOR SOLID OXIDE ELECTROLYZER, BY COUNTRY 2022 AND 2032(%)
- FIGURE 18. GREEN HYDROGEN MARKET, BY APPLICATION, 2022 AND 2032(%)
- FIGURE 19. COMPARATIVE SHARE ANALYSIS OF GREEN HYDROGEN MARKET FOR POWER GENERATION, BY COUNTRY 2022 AND 2032(%)
- FIGURE 20. COMPARATIVE SHARE ANALYSIS OF GREEN HYDROGEN MARKET FOR TRANSPORT, BY COUNTRY 2022 AND 2032(%)
- FIGURE 21. COMPARATIVE SHARE ANALYSIS OF GREEN HYDROGEN MARKET FOR OTHERS, BY COUNTRY 2022 AND 2032(%)
- FIGURE 22. GREEN HYDROGEN MARKET, BY END-USE INDUSTRY, 2022 AND 2032(%)
- FIGURE 23. COMPARATIVE SHARE ANALYSIS OF GREEN HYDROGEN MARKET FOR FOOD AND BEVERAGES, BY COUNTRY 2022 AND 2032(%)
- FIGURE 24. COMPARATIVE SHARE ANALYSIS OF GREEN HYDROGEN MARKET FOR MEDICAL, BY COUNTRY 2022 AND 2032(%)
- FIGURE 25. COMPARATIVE SHARE ANALYSIS OF GREEN HYDROGEN MARKET FOR CHEMICAL, BY COUNTRY 2022 AND 2032(%)
- FIGURE 26. COMPARATIVE SHARE ANALYSIS OF GREEN HYDROGEN MARKET FOR PETROCHEMICALS, BY COUNTRY 2022 AND 2032(%)
- FIGURE 27. COMPARATIVE SHARE ANALYSIS OF GREEN HYDROGEN MARKET FOR GLASS, BY COUNTRY 2022 AND 2032(%)
- FIGURE 28. COMPARATIVE SHARE ANALYSIS OF GREEN HYDROGEN MARKET FOR OTHERS, BY COUNTRY 2022 AND 2032(%)
- FIGURE 29. GREEN HYDROGEN MARKET BY REGION, 2022 AND 2032(%)
- FIGURE 30. U.S. GREEN HYDROGEN MARKET, 2022-2032 ($MILLION)
- FIGURE 31. CANADA GREEN HYDROGEN MARKET, 2022-2032 ($MILLION)
- FIGURE 32. MEXICO GREEN HYDROGEN MARKET, 2022-2032 ($MILLION)
- FIGURE 33. GERMANY GREEN HYDROGEN MARKET, 2022-2032 ($MILLION)
- FIGURE 34. FRANCE GREEN HYDROGEN MARKET, 2022-2032 ($MILLION)
- FIGURE 35. ITALY GREEN HYDROGEN MARKET, 2022-2032 ($MILLION)
- FIGURE 36. UK GREEN HYDROGEN MARKET, 2022-2032 ($MILLION)
- FIGURE 37. SPAIN GREEN HYDROGEN MARKET, 2022-2032 ($MILLION)
- FIGURE 38. REST OF EUROPE GREEN HYDROGEN MARKET, 2022-2032 ($MILLION)
- FIGURE 39. CHINA GREEN HYDROGEN MARKET, 2022-2032 ($MILLION)
- FIGURE 40. INDIA GREEN HYDROGEN MARKET, 2022-2032 ($MILLION)
- FIGURE 41. JAPAN GREEN HYDROGEN MARKET, 2022-2032 ($MILLION)
- FIGURE 42. SOUTH KOREA GREEN HYDROGEN MARKET, 2022-2032 ($MILLION)
- FIGURE 43. AUSTRALIA GREEN HYDROGEN MARKET, 2022-2032 ($MILLION)
- FIGURE 44. REST OF ASIA-PACIFIC GREEN HYDROGEN MARKET, 2022-2032 ($MILLION)
- FIGURE 45. BRAZIL GREEN HYDROGEN MARKET, 2022-2032 ($MILLION)
- FIGURE 46. SOUTH ARABIA GREEN HYDROGEN MARKET, 2022-2032 ($MILLION)
- FIGURE 47. SOUTH AFRICA GREEN HYDROGEN MARKET, 2022-2032 ($MILLION)
- FIGURE 48. REST OF LAMEA GREEN HYDROGEN MARKET, 2022-2032 ($MILLION)
- FIGURE 49. TOP WINNING STRATEGIES, BY YEAR (2021-2023)
- FIGURE 50. TOP WINNING STRATEGIES, BY DEVELOPMENT (2021-2023)
- FIGURE 51. TOP WINNING STRATEGIES, BY COMPANY (2021-2023)
- FIGURE 52. PRODUCT MAPPING OF TOP 10 PLAYERS
- FIGURE 53. COMPETITIVE DASHBOARD
- FIGURE 54. COMPETITIVE HEATMAP: GREEN HYDROGEN MARKET
- FIGURE 55. TOP PLAYER POSITIONING, 2022
- FIGURE 56. ROYAL DUTCH SHELL: NET REVENUE, 2020-2022 ($MILLION)
- FIGURE 57. ROYAL DUTCH SHELL: REVENUE SHARE BY SEGMENT, 2022 (%)
- FIGURE 58. ROYAL DUTCH SHELL: REVENUE SHARE BY REGION, 2022 (%)
- FIGURE 59. AIR LIQUIDE: NET REVENUE, 2020-2022 ($MILLION)
- FIGURE 60. AIR LIQUIDE: REVENUE SHARE BY SEGMENT, 2022 (%)
- FIGURE 61. AIR LIQUIDE: REVENUE SHARE BY REGION, 2022 (%)
- FIGURE 62. ENAPTER: NET REVENUE, 2020-2022 ($MILLION)
- FIGURE 63. ENAPTER: REVENUE SHARE BY SEGMENT, 2022 (%)
- FIGURE 64. ENAPTER: REVENUE SHARE BY REGION, 2022 (%)
- FIGURE 65. PLUG POWER INC.: NET REVENUE, 2020-2022 ($MILLION)
- FIGURE 66. PLUG POWER INC.: REVENUE SHARE BY SEGMENT, 2022 (%)
- FIGURE 67. PLUG POWER INC.: REVENUE SHARE BY REGION, 2022 (%)
- FIGURE 68. BALLARD POWER SYSTEMS: NET SALES, 2020-2022 ($MILLION)
- FIGURE 69. BALLARD POWER SYSTEMS: RESEARCH & DEVELOPMENT EXPENDITURE, 2020-2022 ($MILLION)
- FIGURE 70. BALLARD POWER SYSTEMS: REVENUE SHARE BY SEGMENT, 2022 (%)
- FIGURE 71. BALLARD POWER SYSTEMS: REVENUE SHARE BY REGION, 2022 (%)
- FIGURE 72. LINDE PLC: NET SALES, 2020-2022 ($MILLION)
- FIGURE 73. LINDE PLC: RESEARCH & DEVELOPMENT EXPENDITURE, 2020-2022 ($MILLION)
- FIGURE 74. LINDE PLC: REVENUE SHARE BY SEGMENT, 2022 (%)
- FIGURE 75. LINDE PLC: REVENUE SHARE BY REGION, 2022 (%)
- FIGURE 76. RELIANCE INDUSTRIES LIMITED: NET REVENUE, 2020-2022 ($MILLION)
- FIGURE 77. RELIANCE INDUSTRIES LIMITED: REVENUE SHARE BY SEGMENT, 2022 (%)
- FIGURE 78. RELIANCE INDUSTRIES LIMITED: REVENUE SHARE BY REGION, 2022 (%)
- FIGURE 79. GAIL (INDIA) LIMITED: NET REVENUE, 2021-2023 ($MILLION)
- FIGURE 80. ADANI GREEN ENERGY LTD: NET REVENUE, 2021-2023 ($MILLION)
 绿氢市场:按技术、再生能源来源、分销管道、应用划分 - 2024-2030 年全球预测
 全球绿氢市场:按技术、再生能源来源、最终用途产业和地区划分 - 预测(截至 2030 年)
 2024 年绿氢全球市场报告
 绿氢市场 - 全球和区域分析:按应用、按技术、按再生能源来源、按地区 - 分析和预测(2023-2033)
 绿氢市场:2024-2034
 绿氢能市场-全球展望与预测(2024-2029)
 到 2030 年北美绿氢市场预测 - 区域分析 - 按技术、再生能源和最终用途行业
 南美洲和中美洲绿氢市场预测至 2030 年 - 区域分析 - 按技术、再生能源和最终用途行业
 2030 年欧洲绿氢市场预测 - 区域分析 - 按技术、再生能源和最终用途产业
 2030 年亚太地区绿氢市场预测 - 区域分析 - 按技术、再生能源和最终用途产业