


 |
市场调查报告书
商品编码
1415010
大型挖土机市场:按营运重量、按业务类型、按最终用户:2023-2032 年全球机会分析与产业预测Large Excavators Market By Operating Weight, By Business Type, By End User : Global Opportunity Analysis and Industry Forecast, 2023-2032 |
||||||
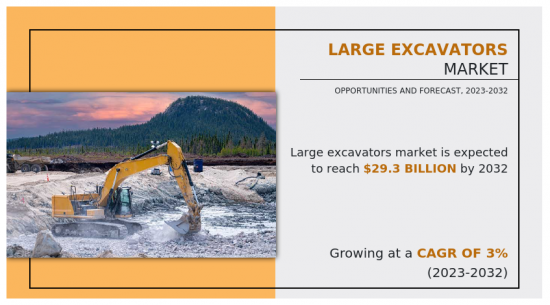
到2022年,大型挖土机市场价值将达到220亿美元,预计2023年至2032年期间复合年增长率为3%,到2032年将达到293亿美元。
工作重量为 45 吨或以上的挖土机因其尺寸和功能而被视为大型挖土机。这些挖土机坚固耐用,主要用于大型建筑和采矿工地。
大型挖土机主要用于建筑业和采矿业,这些行业的快速成长正在推动市场成长。例如,印度雄心勃勃的国家基础设施管道计划预计五年内(2020-2025年)耗资7,597.6亿美元,对大型挖土机需求的成长做出了巨大贡献。此外,工业部门对金属和矿物的需求不断增长正在推动采矿业的发展。采矿和采石业是大型挖土机的主要使用者。然而,特定地区的环境法规限制了市场的成长。相反,有一些技术进步,例如:
- 自动化、人工智慧和其他技术的整合预计将为市场成长提供有利的成长机会。
此外,由于乌克兰-俄罗斯战争导致通货膨胀加剧,全球石油和天然气价格以及原物料价格变得更加波动。这导致大型挖土机市场成长放缓。
大型挖土机市场根据大型挖土机作业重量、业务类型、最终用户和地区进行细分。依作业重量划分,市场分为45-65吨、65-100吨及100吨以上。依业务类型,市场分为新品销售和售后。依最终用户分为建筑/基础设施、采矿/采石等。依地区划分,我们有北美(美国、加拿大、墨西哥)、欧洲(德国、法国、英国、英国其他欧洲国家地区)、亚太地区(中国、印度、日本、韩国等亚洲地区)太平洋地区)和其他亚太地区(拉丁美洲、中东/非洲)。
目录
第一章简介
第 2 章执行摘要
第三章市场概况
- 市场定义和范围
- 主要发现
- 影响因素
- 主要投资机会
- 波特五力分析
- 市场动态
- 促进因素
- 矿业成长
- 官民合作关係(PPP) 日益受到关注
- 建筑业的成长
- 抑制因素
- 世界各地的碳排放法规各不相同
- 机会
- 新技术的出现
- 促进因素
第四章大型挖土机市场:依工作重量
- 概述
- 45-65吨
- 65-100吨
- 100吨以上
第五章大型挖土机市场:依业务类型
- 概述
- 新销售
- 售后服务
第六章大型碎石机市场:依最终用户分类
- 概述
- 建筑和基础设施
- 采矿和采石业
- 其他的
第七章大型挖土机市场:依地区
- 概述
- 北美洲
- 美国
- 加拿大
- 马克西科
- 欧洲
- 德国
- 法国
- 英国
- 义大利
- 其他的
- 亚太地区
- 中国
- 日本
- 印度
- 韩国
- 其他的
- 拉丁美洲/中东/非洲
- 拉丁美洲
- 中东
- 非洲
第八章 竞争形势
- 介绍
- 关键成功策略
- 10家主要企业产品图谱
- 竞争对手仪表板
- 竞争热图
- 主要企业定位(2022年)
第九章 公司简介
- CNH Industrial NV
- AB Volvo
- LIEBHERR-INTERNATIONAL AG
- KOMATSU Ltd
- Hitachi, Ltd
- Sanny Global
- XCMG Construction Machinery Co., Ltd.
- Deere & Company
- HD Hyundai Infracore Co., Ltd.
- Caterpillar Inc.
According to a new report published by Allied Market Research, titled, "Large Excavators Market," The large excavators market was valued at $22 billion in 2022, and is estimated to reach $29.3 billion by 2032, growing at a CAGR of 3% from 2023 to 2032. Excavators with operating weight 45 tons and above are considered large excavators due to their sheer size and capabilities. These excavators are heavy duty and are primarily used in large construction sites and mining sites.
Large excavators are primarily used in the construction and mining industry and rapid growth in these industries is driving the growth of the market. For example, India's ambitious National Infrastructure Pipeline project, with an anticipated expenditure of $759.76 billion spread over five years (2020-2025), significantly contributes to the increasing demand for large excavators. Furthermore, the rising demand for metals and minerals from the industrial sector is driving the mining sector. The mining and quarrying sector is a major user of large excavators. However, the region-specific environmental regulations are limiting market growth. Contrarily, technological advancements such as the integration of automation, Artificial Intelligence, and other such technologies are anticipated to present lucrative growth opportunities for the market growth.
Furthermore, the price of oil & gas and the price of raw materials have experienced increased volatility globally, due to a rise in inflation driven by Ukraine-Russia war. This has led to slow-paced growth of the large excavators market.
The large excavators market is segmented on the basis of large excavators operating weight, business type, end user, and region. On the basis of operating weight, the market is divided into 45 to 65 Tons, 65 to 100 tons, and Above 100 tons. On the basis of business type, the market is categorized into new sales and aftersales. On the basis of end user, the market is divided into construction and infrastructure, mining and quarrying, and others. On the basis of region the market is analyzed across North America (the U.S., Canada, and Mexico), Europe (Germany, France, Italy, the UK, and rest of Europe), Asia-Pacific (China, India, Japan, South Korea, and the rest of Asia-Pacific), and LAMEA (Latin America, Middle East, and Africa).
Competition Analysis
Competitive analysis and profiles of the major players in the large excavators market are provided in the report. Major companies in the report include AB Volvo, LIEBHERR-INTERNATIONAL AG, KOMATSU Ltd, Hitachi Ltd., XCMG Construction Machinery Co., Ltd., Deere & Company, CNH Industrial N.V., Sanny Global, HD Hyundai Infracore Co., Ltd., and Caterpillar Inc. Major players to remain competitive adopt development strategies such as product launches, business expansion, acquisitions, expansion, partnerships, and mergers.
Key benefits for stakeholders
- The report provides an extensive analysis of the current and emerging large excavators market trends and dynamics.
- In-depth market analysis is conducted by constructing market estimations for the key market segments between 2022 and 2032.
- Extensive analysis of the large excavators market is conducted by following key product positioning and monitoring of the top competitors within the market framework.
- A comprehensive analysis of all regions is provided to determine the prevailing opportunities.
- The global large excavators market forecast analysis from 2023 to 2032 is included in the report.
- Key market players within the large excavators market are profiled in this report and their strategies are analyzed thoroughly, which helps understand the competitive outlook of the large excavators industry.
Additional benefits you will get with this purchase are:
- Quarterly Update and* (only available with a corporate license, on listed price)
- 5 additional Company Profile of client Choice pre- or Post-purchase, as a free update.
- Free Upcoming Version on the Purchase of Five and Enterprise User License.
- 16 analyst hours of support* (post-purchase, if you find additional data requirements upon review of the report, you may receive support amounting to 16 analyst hours to solve questions, and post-sale queries)
- 15% Free Customization* (in case the scope or segment of the report does not match your requirements, 15% is equivalent to 3 working days of free work, applicable once)
- Free data Pack on the Five and Enterprise User License. (Excel version of the report)
- Free Updated report if the report is 6-12 months old or older.
- 24-hour priority response*
- Free Industry updates and white papers.
Possible Customization with this report (with additional cost and timeline, please talk to the sales executive to know more)
- Consumer Buying Behavior Analysis
- Average Consumer Expenditure
- Market share analysis of players by products/segments
- Additional company profiles with specific to client's interest
- Additional country or region analysis- market size and forecast
- Average Selling Price Analysis / Price Point Analysis
- Brands Share Analysis
- Criss-cross segment analysis- market size and forecast
- Expanded list for Company Profiles
- Historic market data
- Import Export Analysis/Data
- Key player details (including location, contact details, supplier/vendor network etc. in excel format)
- Market share analysis of players at global/region/country level
- SWOT Analysis
- Volume Market Size and Forecast
Key Market Segments
By Operating Weight
- 65 to 100 Ton
- Above 100 Ton
- 45 to 65 Ton
By Business Type
- New Sales
- Aftersales
By End User
- Construction and Infrastructure
- Mining and Quarrying
- Others
By Region
- North America
- U.S.
- Canada
- Maxico
- Europe
- Germany
- France
- UK
- Italy
- Rest of Europe
- Asia-Pacific
- China
- Japan
- India
- South Korea
- Rest of Asia-Pacific
- LAMEA
- Latin America
- Middle East
- Africa
Key Market Players:
- AB Volvo
- LIEBHERR-INTERNATIONAL AG
- KOMATSU Ltd
- XCMG Construction Machinery Co., Ltd.
- Deere & Company
- Sanny Global
- HD Hyundai Infracore Co., Ltd.
- Caterpillar Inc.
- Hitachi, Ltd
- CNH Industrial N.V.
TABLE OF CONTENTS
CHAPTER 1: INTRODUCTION
- 1.1. Report description
- 1.2. Key market segments
- 1.3. Key benefits to the stakeholders
- 1.4. Research methodology
- 1.4.1. Primary research
- 1.4.2. Secondary research
- 1.4.3. Analyst tools and models
CHAPTER 2: EXECUTIVE SUMMARY
- 2.1. CXO Perspective
CHAPTER 3: MARKET OVERVIEW
- 3.1. Market definition and scope
- 3.2. Key findings
- 3.2.1. Top impacting factors
- 3.2.2. Top investment pockets
- 3.3. Porter's five forces analysis
- 3.3.1. Low bargaining power of suppliers
- 3.3.2. Low threat of new entrants
- 3.3.3. Low threat of substitutes
- 3.3.4. Low intensity of rivalry
- 3.3.5. Low bargaining power of buyers
- 3.4. Market dynamics
- 3.4.1. Drivers
- 3.4.1.1. Rise in mining industry
- 3.4.1.2. Increase in focus on Public-private partnerships (PPP)
- 3.4.1.3. Growth in construction sector
- 3.4.2. Restraints
- 3.4.2.1. Varying carbon emission regulations across the world
- 3.4.3. Opportunities
- 3.4.3.1. Advent of new technologies.
- 3.4.1. Drivers
CHAPTER 4: LARGE EXCAVATORS MARKET, BY OPERATING WEIGHT
- 4.1. Overview
- 4.1.1. Market size and forecast
- 4.2. 45 to 65 Ton
- 4.2.1. Key market trends, growth factors and opportunities
- 4.2.2. Market size and forecast, by region
- 4.2.3. Market share analysis by country
- 4.3. 65 to 100 Ton
- 4.3.1. Key market trends, growth factors and opportunities
- 4.3.2. Market size and forecast, by region
- 4.3.3. Market share analysis by country
- 4.4. Above 100 Ton
- 4.4.1. Key market trends, growth factors and opportunities
- 4.4.2. Market size and forecast, by region
- 4.4.3. Market share analysis by country
CHAPTER 5: LARGE EXCAVATORS MARKET, BY BUSINESS TYPE
- 5.1. Overview
- 5.1.1. Market size and forecast
- 5.2. New Sales
- 5.2.1. Key market trends, growth factors and opportunities
- 5.2.2. Market size and forecast, by region
- 5.2.3. Market share analysis by country
- 5.3. Aftersales
- 5.3.1. Key market trends, growth factors and opportunities
- 5.3.2. Market size and forecast, by region
- 5.3.3. Market share analysis by country
CHAPTER 6: LARGE EXCAVATORS MARKET, BY END USER
- 6.1. Overview
- 6.1.1. Market size and forecast
- 6.2. Construction and Infrastructure
- 6.2.1. Key market trends, growth factors and opportunities
- 6.2.2. Market size and forecast, by region
- 6.2.3. Market share analysis by country
- 6.3. Mining and Quarrying
- 6.3.1. Key market trends, growth factors and opportunities
- 6.3.2. Market size and forecast, by region
- 6.3.3. Market share analysis by country
- 6.4. Others
- 6.4.1. Key market trends, growth factors and opportunities
- 6.4.2. Market size and forecast, by region
- 6.4.3. Market share analysis by country
CHAPTER 7: LARGE EXCAVATORS MARKET, BY REGION
- 7.1. Overview
- 7.1.1. Market size and forecast By Region
- 7.2. North America
- 7.2.1. Key market trends, growth factors and opportunities
- 7.2.2. Market size and forecast, by Operating Weight
- 7.2.3. Market size and forecast, by Business Type
- 7.2.4. Market size and forecast, by End User
- 7.2.5. Market size and forecast, by country
- 7.2.5.1. U.S.
- 7.2.5.1.1. Market size and forecast, by Operating Weight
- 7.2.5.1.2. Market size and forecast, by Business Type
- 7.2.5.1.3. Market size and forecast, by End User
- 7.2.5.2. Canada
- 7.2.5.2.1. Market size and forecast, by Operating Weight
- 7.2.5.2.2. Market size and forecast, by Business Type
- 7.2.5.2.3. Market size and forecast, by End User
- 7.2.5.3. Maxico
- 7.2.5.3.1. Market size and forecast, by Operating Weight
- 7.2.5.3.2. Market size and forecast, by Business Type
- 7.2.5.3.3. Market size and forecast, by End User
- 7.3. Europe
- 7.3.1. Key market trends, growth factors and opportunities
- 7.3.2. Market size and forecast, by Operating Weight
- 7.3.3. Market size and forecast, by Business Type
- 7.3.4. Market size and forecast, by End User
- 7.3.5. Market size and forecast, by country
- 7.3.5.1. Germany
- 7.3.5.1.1. Market size and forecast, by Operating Weight
- 7.3.5.1.2. Market size and forecast, by Business Type
- 7.3.5.1.3. Market size and forecast, by End User
- 7.3.5.2. France
- 7.3.5.2.1. Market size and forecast, by Operating Weight
- 7.3.5.2.2. Market size and forecast, by Business Type
- 7.3.5.2.3. Market size and forecast, by End User
- 7.3.5.3. UK
- 7.3.5.3.1. Market size and forecast, by Operating Weight
- 7.3.5.3.2. Market size and forecast, by Business Type
- 7.3.5.3.3. Market size and forecast, by End User
- 7.3.5.4. Italy
- 7.3.5.4.1. Market size and forecast, by Operating Weight
- 7.3.5.4.2. Market size and forecast, by Business Type
- 7.3.5.4.3. Market size and forecast, by End User
- 7.3.5.5. Rest of Europe
- 7.3.5.5.1. Market size and forecast, by Operating Weight
- 7.3.5.5.2. Market size and forecast, by Business Type
- 7.3.5.5.3. Market size and forecast, by End User
- 7.4. Asia-Pacific
- 7.4.1. Key market trends, growth factors and opportunities
- 7.4.2. Market size and forecast, by Operating Weight
- 7.4.3. Market size and forecast, by Business Type
- 7.4.4. Market size and forecast, by End User
- 7.4.5. Market size and forecast, by country
- 7.4.5.1. China
- 7.4.5.1.1. Market size and forecast, by Operating Weight
- 7.4.5.1.2. Market size and forecast, by Business Type
- 7.4.5.1.3. Market size and forecast, by End User
- 7.4.5.2. Japan
- 7.4.5.2.1. Market size and forecast, by Operating Weight
- 7.4.5.2.2. Market size and forecast, by Business Type
- 7.4.5.2.3. Market size and forecast, by End User
- 7.4.5.3. India
- 7.4.5.3.1. Market size and forecast, by Operating Weight
- 7.4.5.3.2. Market size and forecast, by Business Type
- 7.4.5.3.3. Market size and forecast, by End User
- 7.4.5.4. South Korea
- 7.4.5.4.1. Market size and forecast, by Operating Weight
- 7.4.5.4.2. Market size and forecast, by Business Type
- 7.4.5.4.3. Market size and forecast, by End User
- 7.4.5.5. Rest of Asia-Pacific
- 7.4.5.5.1. Market size and forecast, by Operating Weight
- 7.4.5.5.2. Market size and forecast, by Business Type
- 7.4.5.5.3. Market size and forecast, by End User
- 7.5. LAMEA
- 7.5.1. Key market trends, growth factors and opportunities
- 7.5.2. Market size and forecast, by Operating Weight
- 7.5.3. Market size and forecast, by Business Type
- 7.5.4. Market size and forecast, by End User
- 7.5.5. Market size and forecast, by country
- 7.5.5.1. Latin America
- 7.5.5.1.1. Market size and forecast, by Operating Weight
- 7.5.5.1.2. Market size and forecast, by Business Type
- 7.5.5.1.3. Market size and forecast, by End User
- 7.5.5.2. Middle East
- 7.5.5.2.1. Market size and forecast, by Operating Weight
- 7.5.5.2.2. Market size and forecast, by Business Type
- 7.5.5.2.3. Market size and forecast, by End User
- 7.5.5.3. Africa
- 7.5.5.3.1. Market size and forecast, by Operating Weight
- 7.5.5.3.2. Market size and forecast, by Business Type
- 7.5.5.3.3. Market size and forecast, by End User
CHAPTER 8: COMPETITIVE LANDSCAPE
- 8.1. Introduction
- 8.2. Top winning strategies
- 8.3. Product mapping of top 10 player
- 8.4. Competitive dashboard
- 8.5. Competitive heatmap
- 8.6. Top player positioning, 2022
CHAPTER 9: COMPANY PROFILES
- 9.1. CNH Industrial N.V.
- 9.1.1. Company overview
- 9.1.2. Key executives
- 9.1.3. Company snapshot
- 9.1.4. Operating business segments
- 9.1.5. Product portfolio
- 9.1.6. Business performance
- 9.2. AB Volvo
- 9.2.1. Company overview
- 9.2.2. Key executives
- 9.2.3. Company snapshot
- 9.2.4. Operating business segments
- 9.2.5. Product portfolio
- 9.2.6. Business performance
- 9.2.7. Key strategic moves and developments
- 9.3. LIEBHERR-INTERNATIONAL AG
- 9.3.1. Company overview
- 9.3.2. Key executives
- 9.3.3. Company snapshot
- 9.3.4. Operating business segments
- 9.3.5. Product portfolio
- 9.3.6. Business performance
- 9.3.7. Key strategic moves and developments
- 9.4. KOMATSU Ltd
- 9.4.1. Company overview
- 9.4.2. Key executives
- 9.4.3. Company snapshot
- 9.4.4. Operating business segments
- 9.4.5. Product portfolio
- 9.4.6. Business performance
- 9.4.7. Key strategic moves and developments
- 9.5. Hitachi, Ltd
- 9.5.1. Company overview
- 9.5.2. Key executives
- 9.5.3. Company snapshot
- 9.5.4. Operating business segments
- 9.5.5. Product portfolio
- 9.5.6. Business performance
- 9.5.7. Key strategic moves and developments
- 9.6. Sanny Global
- 9.6.1. Company overview
- 9.6.2. Key executives
- 9.6.3. Company snapshot
- 9.6.4. Operating business segments
- 9.6.5. Product portfolio
- 9.6.6. Business performance
- 9.7. XCMG Construction Machinery Co., Ltd.
- 9.7.1. Company overview
- 9.7.2. Key executives
- 9.7.3. Company snapshot
- 9.7.4. Operating business segments
- 9.7.5. Product portfolio
- 9.7.6. Business performance
- 9.8. Deere & Company
- 9.8.1. Company overview
- 9.8.2. Key executives
- 9.8.3. Company snapshot
- 9.8.4. Operating business segments
- 9.8.5. Product portfolio
- 9.8.6. Business performance
- 9.9. HD Hyundai Infracore Co., Ltd.
- 9.9.1. Company overview
- 9.9.2. Key executives
- 9.9.3. Company snapshot
- 9.9.4. Operating business segments
- 9.9.5. Product portfolio
- 9.9.6. Business performance
- 9.9.7. Key strategic moves and developments
- 9.10. Caterpillar Inc.
- 9.10.1. Company overview
- 9.10.2. Key executives
- 9.10.3. Company snapshot
- 9.10.4. Operating business segments
- 9.10.5. Product portfolio
- 9.10.6. Business performance
LIST OF TABLES
- TABLE 01. GLOBAL LARGE EXCAVATORS MARKET, BY OPERATING WEIGHT, 2022-2032 ($MILLION)
- TABLE 02. LARGE EXCAVATORS MARKET FOR 45 TO 65 TON, BY REGION, 2022-2032 ($MILLION)
- TABLE 03. LARGE EXCAVATORS MARKET FOR 65 TO 100 TON, BY REGION, 2022-2032 ($MILLION)
- TABLE 04. LARGE EXCAVATORS MARKET FOR ABOVE 100 TON, BY REGION, 2022-2032 ($MILLION)
- TABLE 05. GLOBAL LARGE EXCAVATORS MARKET, BY BUSINESS TYPE, 2022-2032 ($MILLION)
- TABLE 06. LARGE EXCAVATORS MARKET FOR NEW SALES, BY REGION, 2022-2032 ($MILLION)
- TABLE 07. LARGE EXCAVATORS MARKET FOR AFTERSALES, BY REGION, 2022-2032 ($MILLION)
- TABLE 08. GLOBAL LARGE EXCAVATORS MARKET, BY END USER, 2022-2032 ($MILLION)
- TABLE 09. LARGE EXCAVATORS MARKET FOR CONSTRUCTION AND INFRASTRUCTURE, BY REGION, 2022-2032 ($MILLION)
- TABLE 10. LARGE EXCAVATORS MARKET FOR MINING AND QUARRYING, BY REGION, 2022-2032 ($MILLION)
- TABLE 11. LARGE EXCAVATORS MARKET FOR OTHERS, BY REGION, 2022-2032 ($MILLION)
- TABLE 12. LARGE EXCAVATORS MARKET, BY REGION, 2022-2032 ($MILLION)
- TABLE 13. NORTH AMERICA LARGE EXCAVATORS MARKET, BY OPERATING WEIGHT, 2022-2032 ($MILLION)
- TABLE 14. NORTH AMERICA LARGE EXCAVATORS MARKET, BY BUSINESS TYPE, 2022-2032 ($MILLION)
- TABLE 15. NORTH AMERICA LARGE EXCAVATORS MARKET, BY END USER, 2022-2032 ($MILLION)
- TABLE 16. NORTH AMERICA LARGE EXCAVATORS MARKET, BY COUNTRY, 2022-2032 ($MILLION)
- TABLE 17. U.S. LARGE EXCAVATORS MARKET, BY OPERATING WEIGHT, 2022-2032 ($MILLION)
- TABLE 18. U.S. LARGE EXCAVATORS MARKET, BY BUSINESS TYPE, 2022-2032 ($MILLION)
- TABLE 19. U.S. LARGE EXCAVATORS MARKET, BY END USER, 2022-2032 ($MILLION)
- TABLE 20. CANADA LARGE EXCAVATORS MARKET, BY OPERATING WEIGHT, 2022-2032 ($MILLION)
- TABLE 21. CANADA LARGE EXCAVATORS MARKET, BY BUSINESS TYPE, 2022-2032 ($MILLION)
- TABLE 22. CANADA LARGE EXCAVATORS MARKET, BY END USER, 2022-2032 ($MILLION)
- TABLE 23. MAXICO LARGE EXCAVATORS MARKET, BY OPERATING WEIGHT, 2022-2032 ($MILLION)
- TABLE 24. MAXICO LARGE EXCAVATORS MARKET, BY BUSINESS TYPE, 2022-2032 ($MILLION)
- TABLE 25. MAXICO LARGE EXCAVATORS MARKET, BY END USER, 2022-2032 ($MILLION)
- TABLE 26. EUROPE LARGE EXCAVATORS MARKET, BY OPERATING WEIGHT, 2022-2032 ($MILLION)
- TABLE 27. EUROPE LARGE EXCAVATORS MARKET, BY BUSINESS TYPE, 2022-2032 ($MILLION)
- TABLE 28. EUROPE LARGE EXCAVATORS MARKET, BY END USER, 2022-2032 ($MILLION)
- TABLE 29. EUROPE LARGE EXCAVATORS MARKET, BY COUNTRY, 2022-2032 ($MILLION)
- TABLE 30. GERMANY LARGE EXCAVATORS MARKET, BY OPERATING WEIGHT, 2022-2032 ($MILLION)
- TABLE 31. GERMANY LARGE EXCAVATORS MARKET, BY BUSINESS TYPE, 2022-2032 ($MILLION)
- TABLE 32. GERMANY LARGE EXCAVATORS MARKET, BY END USER, 2022-2032 ($MILLION)
- TABLE 33. FRANCE LARGE EXCAVATORS MARKET, BY OPERATING WEIGHT, 2022-2032 ($MILLION)
- TABLE 34. FRANCE LARGE EXCAVATORS MARKET, BY BUSINESS TYPE, 2022-2032 ($MILLION)
- TABLE 35. FRANCE LARGE EXCAVATORS MARKET, BY END USER, 2022-2032 ($MILLION)
- TABLE 36. UK LARGE EXCAVATORS MARKET, BY OPERATING WEIGHT, 2022-2032 ($MILLION)
- TABLE 37. UK LARGE EXCAVATORS MARKET, BY BUSINESS TYPE, 2022-2032 ($MILLION)
- TABLE 38. UK LARGE EXCAVATORS MARKET, BY END USER, 2022-2032 ($MILLION)
- TABLE 39. ITALY LARGE EXCAVATORS MARKET, BY OPERATING WEIGHT, 2022-2032 ($MILLION)
- TABLE 40. ITALY LARGE EXCAVATORS MARKET, BY BUSINESS TYPE, 2022-2032 ($MILLION)
- TABLE 41. ITALY LARGE EXCAVATORS MARKET, BY END USER, 2022-2032 ($MILLION)
- TABLE 42. REST OF EUROPE LARGE EXCAVATORS MARKET, BY OPERATING WEIGHT, 2022-2032 ($MILLION)
- TABLE 43. REST OF EUROPE LARGE EXCAVATORS MARKET, BY BUSINESS TYPE, 2022-2032 ($MILLION)
- TABLE 44. REST OF EUROPE LARGE EXCAVATORS MARKET, BY END USER, 2022-2032 ($MILLION)
- TABLE 45. ASIA-PACIFIC LARGE EXCAVATORS MARKET, BY OPERATING WEIGHT, 2022-2032 ($MILLION)
- TABLE 46. ASIA-PACIFIC LARGE EXCAVATORS MARKET, BY BUSINESS TYPE, 2022-2032 ($MILLION)
- TABLE 47. ASIA-PACIFIC LARGE EXCAVATORS MARKET, BY END USER, 2022-2032 ($MILLION)
- TABLE 48. ASIA-PACIFIC LARGE EXCAVATORS MARKET, BY COUNTRY, 2022-2032 ($MILLION)
- TABLE 49. CHINA LARGE EXCAVATORS MARKET, BY OPERATING WEIGHT, 2022-2032 ($MILLION)
- TABLE 50. CHINA LARGE EXCAVATORS MARKET, BY BUSINESS TYPE, 2022-2032 ($MILLION)
- TABLE 51. CHINA LARGE EXCAVATORS MARKET, BY END USER, 2022-2032 ($MILLION)
- TABLE 52. JAPAN LARGE EXCAVATORS MARKET, BY OPERATING WEIGHT, 2022-2032 ($MILLION)
- TABLE 53. JAPAN LARGE EXCAVATORS MARKET, BY BUSINESS TYPE, 2022-2032 ($MILLION)
- TABLE 54. JAPAN LARGE EXCAVATORS MARKET, BY END USER, 2022-2032 ($MILLION)
- TABLE 55. INDIA LARGE EXCAVATORS MARKET, BY OPERATING WEIGHT, 2022-2032 ($MILLION)
- TABLE 56. INDIA LARGE EXCAVATORS MARKET, BY BUSINESS TYPE, 2022-2032 ($MILLION)
- TABLE 57. INDIA LARGE EXCAVATORS MARKET, BY END USER, 2022-2032 ($MILLION)
- TABLE 58. SOUTH KOREA LARGE EXCAVATORS MARKET, BY OPERATING WEIGHT, 2022-2032 ($MILLION)
- TABLE 59. SOUTH KOREA LARGE EXCAVATORS MARKET, BY BUSINESS TYPE, 2022-2032 ($MILLION)
- TABLE 60. SOUTH KOREA LARGE EXCAVATORS MARKET, BY END USER, 2022-2032 ($MILLION)
- TABLE 61. REST OF ASIA-PACIFIC LARGE EXCAVATORS MARKET, BY OPERATING WEIGHT, 2022-2032 ($MILLION)
- TABLE 62. REST OF ASIA-PACIFIC LARGE EXCAVATORS MARKET, BY BUSINESS TYPE, 2022-2032 ($MILLION)
- TABLE 63. REST OF ASIA-PACIFIC LARGE EXCAVATORS MARKET, BY END USER, 2022-2032 ($MILLION)
- TABLE 64. LAMEA LARGE EXCAVATORS MARKET, BY OPERATING WEIGHT, 2022-2032 ($MILLION)
- TABLE 65. LAMEA LARGE EXCAVATORS MARKET, BY BUSINESS TYPE, 2022-2032 ($MILLION)
- TABLE 66. LAMEA LARGE EXCAVATORS MARKET, BY END USER, 2022-2032 ($MILLION)
- TABLE 67. LAMEA LARGE EXCAVATORS MARKET, BY COUNTRY, 2022-2032 ($MILLION)
- TABLE 68. LATIN AMERICA LARGE EXCAVATORS MARKET, BY OPERATING WEIGHT, 2022-2032 ($MILLION)
- TABLE 69. LATIN AMERICA LARGE EXCAVATORS MARKET, BY BUSINESS TYPE, 2022-2032 ($MILLION)
- TABLE 70. LATIN AMERICA LARGE EXCAVATORS MARKET, BY END USER, 2022-2032 ($MILLION)
- TABLE 71. MIDDLE EAST LARGE EXCAVATORS MARKET, BY OPERATING WEIGHT, 2022-2032 ($MILLION)
- TABLE 72. MIDDLE EAST LARGE EXCAVATORS MARKET, BY BUSINESS TYPE, 2022-2032 ($MILLION)
- TABLE 73. MIDDLE EAST LARGE EXCAVATORS MARKET, BY END USER, 2022-2032 ($MILLION)
- TABLE 74. AFRICA LARGE EXCAVATORS MARKET, BY OPERATING WEIGHT, 2022-2032 ($MILLION)
- TABLE 75. AFRICA LARGE EXCAVATORS MARKET, BY BUSINESS TYPE, 2022-2032 ($MILLION)
- TABLE 76. AFRICA LARGE EXCAVATORS MARKET, BY END USER, 2022-2032 ($MILLION)
- TABLE 77. CNH INDUSTRIAL N.V.: KEY EXECUTIVES
- TABLE 78. CNH INDUSTRIAL N.V.: COMPANY SNAPSHOT
- TABLE 79. CNH INDUSTRIAL N.V.: PRODUCT SEGMENTS
- TABLE 80. CNH INDUSTRIAL N.V.: PRODUCT PORTFOLIO
- TABLE 81. AB VOLVO: KEY EXECUTIVES
- TABLE 82. AB VOLVO: COMPANY SNAPSHOT
- TABLE 83. AB VOLVO: PRODUCT SEGMENTS
- TABLE 84. AB VOLVO: PRODUCT PORTFOLIO
- TABLE 85. AB VOLVO: KEY STRATERGIES
- TABLE 86. LIEBHERR-INTERNATIONAL AG: KEY EXECUTIVES
- TABLE 87. LIEBHERR-INTERNATIONAL AG: COMPANY SNAPSHOT
- TABLE 88. LIEBHERR-INTERNATIONAL AG: PRODUCT SEGMENTS
- TABLE 89. LIEBHERR-INTERNATIONAL AG: PRODUCT PORTFOLIO
- TABLE 90. LIEBHERR-INTERNATIONAL AG: KEY STRATERGIES
- TABLE 91. KOMATSU LTD: KEY EXECUTIVES
- TABLE 92. KOMATSU LTD: COMPANY SNAPSHOT
- TABLE 93. KOMATSU LTD: PRODUCT SEGMENTS
- TABLE 94. KOMATSU LTD: PRODUCT PORTFOLIO
- TABLE 95. KOMATSU LTD: KEY STRATERGIES
- TABLE 96. HITACHI, LTD: KEY EXECUTIVES
- TABLE 97. HITACHI, LTD: COMPANY SNAPSHOT
- TABLE 98. HITACHI, LTD: PRODUCT SEGMENTS
- TABLE 99. HITACHI, LTD: PRODUCT PORTFOLIO
- TABLE 100. HITACHI, LTD: KEY STRATERGIES
- TABLE 101. SANNY GLOBAL: KEY EXECUTIVES
- TABLE 102. SANNY GLOBAL: COMPANY SNAPSHOT
- TABLE 103. SANNY GLOBAL: PRODUCT SEGMENTS
- TABLE 104. SANNY GLOBAL: PRODUCT PORTFOLIO
- TABLE 105. XCMG CONSTRUCTION MACHINERY CO., LTD.: KEY EXECUTIVES
- TABLE 106. XCMG CONSTRUCTION MACHINERY CO., LTD.: COMPANY SNAPSHOT
- TABLE 107. XCMG CONSTRUCTION MACHINERY CO., LTD.: PRODUCT SEGMENTS
- TABLE 108. XCMG CONSTRUCTION MACHINERY CO., LTD.: SERVICE SEGMENTS
- TABLE 109. XCMG CONSTRUCTION MACHINERY CO., LTD.: PRODUCT PORTFOLIO
- TABLE 110. DEERE & COMPANY: KEY EXECUTIVES
- TABLE 111. DEERE & COMPANY: COMPANY SNAPSHOT
- TABLE 112. DEERE & COMPANY: PRODUCT SEGMENTS
- TABLE 113. DEERE & COMPANY: PRODUCT PORTFOLIO
- TABLE 114. HD HYUNDAI INFRACORE CO., LTD.: KEY EXECUTIVES
- TABLE 115. HD HYUNDAI INFRACORE CO., LTD.: COMPANY SNAPSHOT
- TABLE 116. HD HYUNDAI INFRACORE CO., LTD.: PRODUCT SEGMENTS
- TABLE 117. HD HYUNDAI INFRACORE CO., LTD.: PRODUCT PORTFOLIO
- TABLE 118. HD HYUNDAI INFRACORE CO., LTD.: KEY STRATERGIES
- TABLE 119. CATERPILLAR INC.: KEY EXECUTIVES
- TABLE 120. CATERPILLAR INC.: COMPANY SNAPSHOT
- TABLE 121. CATERPILLAR INC.: PRODUCT SEGMENTS
- TABLE 122. CATERPILLAR INC.: PRODUCT PORTFOLIO
LIST OF FIGURES
- FIGURE 01. LARGE EXCAVATORS MARKET, 2022-2032
- FIGURE 02. SEGMENTATION OF LARGE EXCAVATORS MARKET,2022-2032
- FIGURE 03. TOP IMPACTING FACTORS IN LARGE EXCAVATORS MARKET (2022 TO 2032)
- FIGURE 04. TOP INVESTMENT POCKETS IN LARGE EXCAVATORS MARKET (2023-2032)
- FIGURE 05. LOW BARGAINING POWER OF SUPPLIERS
- FIGURE 06. LOW THREAT OF NEW ENTRANTS
- FIGURE 07. LOW THREAT OF SUBSTITUTES
- FIGURE 08. LOW INTENSITY OF RIVALRY
- FIGURE 09. LOW BARGAINING POWER OF BUYERS
- FIGURE 10. GLOBAL LARGE EXCAVATORS MARKET:DRIVERS, RESTRAINTS AND OPPORTUNITIES
- FIGURE 11. LARGE EXCAVATORS MARKET, BY OPERATING WEIGHT, 2022 AND 2032(%)
- FIGURE 12. COMPARATIVE SHARE ANALYSIS OF LARGE EXCAVATORS MARKET FOR 45 TO 65 TON, BY COUNTRY 2022 AND 2032(%)
- FIGURE 13. COMPARATIVE SHARE ANALYSIS OF LARGE EXCAVATORS MARKET FOR 65 TO 100 TON, BY COUNTRY 2022 AND 2032(%)
- FIGURE 14. COMPARATIVE SHARE ANALYSIS OF LARGE EXCAVATORS MARKET FOR ABOVE 100 TON, BY COUNTRY 2022 AND 2032(%)
- FIGURE 15. LARGE EXCAVATORS MARKET, BY BUSINESS TYPE, 2022 AND 2032(%)
- FIGURE 16. COMPARATIVE SHARE ANALYSIS OF LARGE EXCAVATORS MARKET FOR NEW SALES, BY COUNTRY 2022 AND 2032(%)
- FIGURE 17. COMPARATIVE SHARE ANALYSIS OF LARGE EXCAVATORS MARKET FOR AFTERSALES, BY COUNTRY 2022 AND 2032(%)
- FIGURE 18. LARGE EXCAVATORS MARKET, BY END USER, 2022 AND 2032(%)
- FIGURE 19. COMPARATIVE SHARE ANALYSIS OF LARGE EXCAVATORS MARKET FOR CONSTRUCTION AND INFRASTRUCTURE, BY COUNTRY 2022 AND 2032(%)
- FIGURE 20. COMPARATIVE SHARE ANALYSIS OF LARGE EXCAVATORS MARKET FOR MINING AND QUARRYING, BY COUNTRY 2022 AND 2032(%)
- FIGURE 21. COMPARATIVE SHARE ANALYSIS OF LARGE EXCAVATORS MARKET FOR OTHERS, BY COUNTRY 2022 AND 2032(%)
- FIGURE 22. LARGE EXCAVATORS MARKET BY REGION, 2022 AND 2032(%)
- FIGURE 23. U.S. LARGE EXCAVATORS MARKET, 2022-2032 ($MILLION)
- FIGURE 24. CANADA LARGE EXCAVATORS MARKET, 2022-2032 ($MILLION)
- FIGURE 25. MAXICO LARGE EXCAVATORS MARKET, 2022-2032 ($MILLION)
- FIGURE 26. GERMANY LARGE EXCAVATORS MARKET, 2022-2032 ($MILLION)
- FIGURE 27. FRANCE LARGE EXCAVATORS MARKET, 2022-2032 ($MILLION)
- FIGURE 28. UK LARGE EXCAVATORS MARKET, 2022-2032 ($MILLION)
- FIGURE 29. ITALY LARGE EXCAVATORS MARKET, 2022-2032 ($MILLION)
- FIGURE 30. REST OF EUROPE LARGE EXCAVATORS MARKET, 2022-2032 ($MILLION)
- FIGURE 31. CHINA LARGE EXCAVATORS MARKET, 2022-2032 ($MILLION)
- FIGURE 32. JAPAN LARGE EXCAVATORS MARKET, 2022-2032 ($MILLION)
- FIGURE 33. INDIA LARGE EXCAVATORS MARKET, 2022-2032 ($MILLION)
- FIGURE 34. SOUTH KOREA LARGE EXCAVATORS MARKET, 2022-2032 ($MILLION)
- FIGURE 35. REST OF ASIA-PACIFIC LARGE EXCAVATORS MARKET, 2022-2032 ($MILLION)
- FIGURE 36. LATIN AMERICA LARGE EXCAVATORS MARKET, 2022-2032 ($MILLION)
- FIGURE 37. MIDDLE EAST LARGE EXCAVATORS MARKET, 2022-2032 ($MILLION)
- FIGURE 38. AFRICA LARGE EXCAVATORS MARKET, 2022-2032 ($MILLION)
- FIGURE 39. TOP WINNING STRATEGIES, BY YEAR (2022-2023)
- FIGURE 40. TOP WINNING STRATEGIES, BY DEVELOPMENT (2022-2023)
- FIGURE 41. TOP WINNING STRATEGIES, BY COMPANY (2022-2023)
- FIGURE 42. PRODUCT MAPPING OF TOP 10 PLAYERS
- FIGURE 43. COMPETITIVE DASHBOARD
- FIGURE 44. COMPETITIVE HEATMAP: LARGE EXCAVATORS MARKET
- FIGURE 45. TOP PLAYER POSITIONING, 2022
- FIGURE 46. CNH INDUSTRIAL N.V.: NET SALES, 2020-2022 ($MILLION)
- FIGURE 47. CNH INDUSTRIAL N.V.: REVENUE SHARE BY SEGMENT, 2022 (%)
- FIGURE 48. CNH INDUSTRIAL N.V.: REVENUE SHARE BY REGION, 2022 (%)
- FIGURE 49. AB VOLVO: RESEARCH & DEVELOPMENT EXPENDITURE, 2020-2022 ($MILLION)
- FIGURE 50. AB VOLVO: NET SALES, 2020-2022 ($MILLION)
- FIGURE 51. AB VOLVO: REVENUE SHARE BY REGION, 2022 (%)
- FIGURE 52. AB VOLVO: REVENUE SHARE BY REGION, 2022 (%)
- FIGURE 53. LIEBHERR-INTERNATIONAL AG: NET REVENUE, 2020-2022 ($MILLION)
- FIGURE 54. LIEBHERR-INTERNATIONAL AG: REVENUE SHARE BY SEGMENT, 2022 (%)
- FIGURE 55. LIEBHERR-INTERNATIONAL AG: REVENUE SHARE BY REGION, 2022 (%)
- FIGURE 56. KOMATSU LTD: NET SALES, 2021-2023 ($MILLION)
- FIGURE 57. KOMATSU LTD: REVENUE SHARE BY SEGMENT, 2023 (%)
- FIGURE 58. KOMATSU LTD: REVENUE SHARE BY REGION, 2021 (%)
- FIGURE 59. HITACHI, LTD: NET REVENUE, 2020-2022 ($MILLION)
- FIGURE 60. HITACHI, LTD: REVENUE SHARE BY SEGMENT, 2022 (%)
- FIGURE 61. HITACHI, LTD: REVENUE SHARE BY REGION, 2022 (%)
- FIGURE 62. DEERE & COMPANY: NET SALES, 2020-2022 ($MILLION)
- FIGURE 63. DEERE & COMPANY: RESEARCH & DEVELOPMENT EXPENDITURE, 2020-2022 ($MILLION)
- FIGURE 64. DEERE & COMPANY: REVENUE SHARE BY SEGMENT, 2022 (%)
- FIGURE 65. DEERE & COMPANY: REVENUE SHARE BY REGION, 2022 (%)
- FIGURE 66. CATERPILLAR INC.: NET REVENUE, 2020-2022 ($MILLION)
- FIGURE 67. CATERPILLAR INC.: RESEARCH & DEVELOPMENT EXPENDITURE, 2020-2022 ($MILLION)
- FIGURE 68. CATERPILLAR INC.: REVENUE SHARE BY SEGMENT, 2022 (%)
- FIGURE 69. CATERPILLAR INC.: REVENUE SHARE BY REGION, 2022 (%)
 履带挖土机市场:按类型、驱动类型、应用划分 - 2024-2030 年全球预测
 挖土机市场:按车辆重量、引擎容量、类型、驱动类型、最终用户划分 - 全球预测 2024-2030
 到 2030 年液压挖土机市场预测:按类型、马力、应用和地区进行全球分析
 拉铲挖土机市场规模- 按挖掘机(标准起重起重机、现场挖掘机)、按动力源(柴油机械、柴油电动混合)、按应用(砂厂、露天采矿)、区域展望与预测,2024 - 2032 年
 2024 年挖土机世界市场报告
 挖掘机市场、份额、规模、趋势、按产品类型、应用、地区、细分市场划分的分析报告,2020-2026
 2024 年小型挖土机世界市场报告
 小型挖土机全球市场规模、份额和趋势分析报告:按类型、按操作重量、按最终用户以及区域展望和预测,2023-2030 年
 液压挖土机市场:按类型、额定功率功率、最终用户划分 - 2024-2030 年全球预测
 挖土机市场规模、份额、趋势分析报告:2024-2030 年按车辆重量、引擎容量、类型、驱动类型、地区和细分市场进行的预测