


 |
市场调查报告书
商品编码
1446418
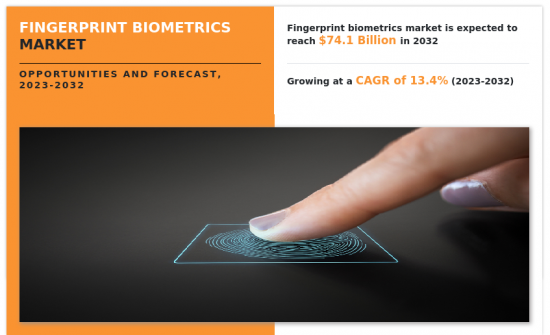
指纹生物辨识市场:按产品、类型和最终用户划分:2023-2032 年全球机会分析和产业预测Fingerprint Biometrics Market By Offering, By Type, By End User : Global Opportunity Analysis and Industry Forecast, 2023-2032 |
||||||
COVID-19 大流行加速了世界向非接触式解决方案的转变,进一步刺激了非接触式指纹身份验证方法的采用,以确保卫生和用户友好的体验。
多模态生物辨识技术将指纹资料与其他生物辨识标识符(例如脸部认证或虹膜辨识)相结合,透过要求多种形式的身份验证来增强整体安全性,已变得普及。另一个值得注意的趋势是实施活体检测技术来应对可能的欺骗,解决重大的安全问题。此外,指纹生物辨识技术与付款卡的整合正在兴起,提高了金融交易的安全性。总的来说,这些趋势反映了人们不断努力提高指纹生物识别系统在各种应用中的准确性、安全性和多功能性。
指纹认证提供了一种强大且独特的身份验证方法,提供高精度并降低未授权存取的风险。将指纹生物识别整合到行动装置、门禁系统和金融交易中,为简化和安全的用户身份验证打开了大门。物联网 (IoT) 和智慧家庭的普及也为指纹生物识别用于控制设备存取并确保用户资料的隐私和安全提供了机会。此外,透过提供快速且方便的身份验证方法来改善使用者体验的潜力也是一个巨大的机会,特别是随着非接触式技术的兴起。指纹生物辨识技术也应用于医疗保健等领域,以保护患者身分和敏感医疗记录的存取。随着技术的不断进步,指纹生物辨识技术在各个领域增强安全性和效率的机会将不断扩大。
指纹生物辨识市场根据产品、类型、最终用户和地区进行细分。在提供的基础上,市场分为硬体、软体和服务。按类型可分为AFIC技术和非AFIC技术。依最终用户划分,可分为 BFSI、医疗保健、旅游/旅游、IT/通讯、政府/国防、汽车等。从区域来看,我们对北美、欧洲、亚太地区、拉丁美洲和中东和非洲地区进行了分析。
相关人员的主要利益
- 本报告定量分析了 2022 年至 2032 年指纹生物辨识市场的细分市场、当前趋势、估计趋势和动态,并总体确定了指纹生物辨识市场的机会。
- 我们提供市场研究以及与市场驱动因素、市场限制和市场机会相关的资讯。
- 波特的五力分析强调买家和供应商帮助相关人员做出利润驱动的商业决策并加强供应商-买家网路的潜力。
- 对指纹生物识别市场区隔的详细分析有助于识别市场机会。
- 每个地区的主要国家都根据其对全球市场的收益贡献绘製了地图。
- 市场参与者定位有助于基准化分析,并提供对市场参与者当前位置的清晰了解。
- 该报告包括对区域和全球指纹生物识别市场趋势、主要企业、细分市场、应用领域和市场成长策略的分析。
可以使用此报告进行定制
- 按地区分類的新参与企业
- 监管指引
- 根据客户兴趣加入公司简介
- 公司简介的扩充列表
- 主要参与者的详细资料(Excel格式,包括位置、联络资讯、供应商/供应商网路等)
- 全球/区域/国家层级参与者的市场占有率分析
目录
第一章简介
第 2 章执行摘要
第三章市场概况
- 市场定义和范围
- 主要发现
- 影响因素
- 主要投资机会
- 波特五力分析
- 市场动态
- 促进因素
- 抑制因素
- 机会
第四章指纹生物辨识市场:依产品分类
- 概述
- 硬体
- 软体
- 服务
第五章指纹生物辨识市场:依类型
- 概述
- 自动指纹辨识技术
- 非 AFIS 技术
第六章指纹生物辨识市场:依最终用户划分
- 概述
- BFSI
- 卫生保健
- 旅游/旅游
- 资讯科技和电讯
- 政府/国防
- 车
- 其他的
第七章指纹生物辨识市场:按地区
- 概述
- 北美洲
- 美国
- 加拿大
- 欧洲
- 英国
- 德国
- 法国
- 义大利
- 西班牙
- 其他的
- 亚太地区
- 中国
- 日本
- 印度
- 澳洲
- 韩国
- 其他的
- 拉丁美洲
- 巴西
- 墨西哥
- 阿根廷
- 其他拉丁美洲
- 中东/非洲
- 沙乌地阿拉伯
- 阿拉伯聯合大公国
- 南非
- 其他中东和非洲
第八章 竞争格局
- 介绍
- 关键成功策略
- 10家主要企业产品图谱
- 竞争对手仪表板
- 竞争热图
- 2022年主要企业定位
第九章 公司简介
- Thales
- Bio-Key International
- HID Global Corporation
- M2SYS Technology
- NEC Corporation
- IDEMIA
- Anviz Global Inc.
- DERMALOG Identification Systems GmbH
- Fingerprint Cards AB
- FingerCheck
The global shift toward contactless solutions, accelerated by the COVID-19 pandemic, has further fueled the adoption of touchless fingerprint recognition methods, ensuring a hygienic and user-friendly experience. Multimodal biometrics, combining fingerprint data with other biometrics identifiers such as facial or iris recognition, gained traction to enhance overall security by requiring multiple forms of authentication. Another notable trend involves the implementation of liveness detection technologies to counter potential spoofing attempts, addressing a critical security concern. Furthermore, the integration of fingerprint biometrics into payment cards has emerged, bolstering the security of financial transactions. These trends collectively reflect the ongoing efforts to improve the accuracy, security, and versatility of fingerprint biometrics systems across various applications.
Fingerprint recognition provides a robust and unique method of identity verification, offering a high level of accuracy and reducing the risk of unauthorized access. The integration of fingerprint biometrics into mobile devices, access control systems, and financial transactions opens doors for streamlined and secure user authentication. The proliferation of the Internet of Things (IoT) and smart homes also offers opportunities, as fingerprint biometrics be employed to control access to devices and ensure the privacy and security of user data. Moreover, the potential for improving user experience by providing quick and convenient authentication methods, especially with the rise of contactless technologies, is a significant opportunity. Fingerprint biometrics also find applications in sectors such as healthcare, where patient identification and access to sensitive medical records be safeguarded. As technology continues to advance, the opportunities for fingerprint biometrics to contribute to enhanced security and efficiency across various domains are likely to expand further.
The fingerprint biometrics market is segmented on the basis of Offering, type, end user, and region. On the basis of Offering, the market is categorized into hardware, software, and services. By type, it is divided into AFIC technology and Non-AFIC technology. On the basis of end user, the market is segregated into BFSI, healthcare, travel & tourism, IT & telecom, government & defense, automotive, and others. By region, the market is analyzed across North America, Europe, Asia-Pacific, Latin America, and MEA.
The global fingerprint biometrics market is dominated by key players such as Thales, Bio-Key International, HID Global Corporation, M2SYS Technology, NEC Corporation, IDEMIA, Anviz Global Inc., DERMALOG Identification Systems GmbH, Fingerprint Cards AB, and FingerCheck.
Key Benefits For Stakeholders
- This report provides a quantitative analysis of the market segments, current trends, estimations, and dynamics of the fingerprint biometrics market analysis from 2022 to 2032 to identify the prevailing fingerprint biometrics market opportunities.
- The market research is offered along with information related to key drivers, restraints, and opportunities.
- Porter's five forces analysis highlights the potency of buyers and suppliers to enable stakeholders make profit-oriented business decisions and strengthen their supplier-buyer network.
- In-depth analysis of the fingerprint biometrics market segmentation assists to determine the prevailing market opportunities.
- Major countries in each region are mapped according to their revenue contribution to the global market.
- Market player positioning facilitates benchmarking and provides a clear understanding of the present position of the market players.
- The report includes the analysis of the regional as well as global fingerprint biometrics market trends, key players, market segments, application areas, and market growth strategies.
Additional benefits you will get with this purchase are:
- Quarterly Update and* (only available with a corporate license, on listed price)
- 5 additional Company Profile of client Choice pre- or Post-purchase, as a free update.
- Free Upcoming Version on the Purchase of Five and Enterprise User License.
- 16 analyst hours of support* (post-purchase, if you find additional data requirements upon review of the report, you may receive support amounting to 16 analyst hours to solve questions, and post-sale queries)
- 15% Free Customization* (in case the scope or segment of the report does not match your requirements, 15% is equivalent to 3 working days of free work, applicable once)
- Free data Pack on the Five and Enterprise User License. (Excel version of the report)
- Free Updated report if the report is 6-12 months old or older.
- 24-hour priority response*
- Free Industry updates and white papers.
Possible Customization with this report (with additional cost and timeline, please talk to the sales executive to know more)
- Upcoming/New Entrant by Regions
- Regulatory Guidelines
- Additional company profiles with specific to client's interest
- Expanded list for Company Profiles
- Key player details (including location, contact details, supplier/vendor network etc. in excel format)
- Market share analysis of players at global/region/country level
Key Market Segments
By Type
- AFIS Technology
- Non-AFIS Technology
By Offering
- Hardware
- Software
- Services
By End User
- IT and Telecom
- Government and Defense
- Automotive
- Others
- BFSI
- Healthcare
- Travel and Tourism
By Region
- North America
- U.S.
- Canada
- Europe
- UK
- Germany
- France
- Italy
- Spain
- Rest of Europe
- Asia-Pacific
- China
- Japan
- India
- Australia
- South Korea
- Rest of Asia-Pacific
- Latin America
- Brazil
- Mexico
- Argentina
- Rest of Latin America
- Middle East and Africa
- Saudi Arabia
- UAE
- South Africa
- Rest of Middle East And Africa
Key Market Players:
- Thales
- Bio-Key International
- HID Global Corporation
- M2SYS Technology
- NEC Corporation
- IDEMIA
- Anviz Global Inc.
- DERMALOG Identification Systems GmbH
- Fingerprint Cards AB
- FingerCheck
TABLE OF CONTENTS
CHAPTER 1: INTRODUCTION
- 1.1. Report description
- 1.2. Key market segments
- 1.3. Key benefits to the stakeholders
- 1.4. Research methodology
- 1.4.1. Primary research
- 1.4.2. Secondary research
- 1.4.3. Analyst tools and models
CHAPTER 2: EXECUTIVE SUMMARY
- 2.1. CXO Perspective
CHAPTER 3: MARKET OVERVIEW
- 3.1. Market definition and scope
- 3.2. Key findings
- 3.2.1. Top impacting factors
- 3.2.2. Top investment pockets
- 3.3. Porter's five forces analysis
- 3.4. Market dynamics
- 3.4.1. Drivers
- 3.4.2. Restraints
- 3.4.3. Opportunities
CHAPTER 4: FINGERPRINT BIOMETRICS MARKET, BY OFFERING
- 4.1. Overview
- 4.1.1. Market size and forecast
- 4.2. Hardware
- 4.2.1. Key market trends, growth factors and opportunities
- 4.2.2. Market size and forecast, by region
- 4.2.3. Market share analysis by country
- 4.3. Software
- 4.3.1. Key market trends, growth factors and opportunities
- 4.3.2. Market size and forecast, by region
- 4.3.3. Market share analysis by country
- 4.4. Services
- 4.4.1. Key market trends, growth factors and opportunities
- 4.4.2. Market size and forecast, by region
- 4.4.3. Market share analysis by country
CHAPTER 5: FINGERPRINT BIOMETRICS MARKET, BY TYPE
- 5.1. Overview
- 5.1.1. Market size and forecast
- 5.2. AFIS Technology
- 5.2.1. Key market trends, growth factors and opportunities
- 5.2.2. Market size and forecast, by region
- 5.2.3. Market share analysis by country
- 5.3. Non-AFIS Technology
- 5.3.1. Key market trends, growth factors and opportunities
- 5.3.2. Market size and forecast, by region
- 5.3.3. Market share analysis by country
CHAPTER 6: FINGERPRINT BIOMETRICS MARKET, BY END USER
- 6.1. Overview
- 6.1.1. Market size and forecast
- 6.2. BFSI
- 6.2.1. Key market trends, growth factors and opportunities
- 6.2.2. Market size and forecast, by region
- 6.2.3. Market share analysis by country
- 6.3. Healthcare
- 6.3.1. Key market trends, growth factors and opportunities
- 6.3.2. Market size and forecast, by region
- 6.3.3. Market share analysis by country
- 6.4. Travel and Tourism
- 6.4.1. Key market trends, growth factors and opportunities
- 6.4.2. Market size and forecast, by region
- 6.4.3. Market share analysis by country
- 6.5. IT and Telecom
- 6.5.1. Key market trends, growth factors and opportunities
- 6.5.2. Market size and forecast, by region
- 6.5.3. Market share analysis by country
- 6.6. Government and Defense
- 6.6.1. Key market trends, growth factors and opportunities
- 6.6.2. Market size and forecast, by region
- 6.6.3. Market share analysis by country
- 6.7. Automotive
- 6.7.1. Key market trends, growth factors and opportunities
- 6.7.2. Market size and forecast, by region
- 6.7.3. Market share analysis by country
- 6.8. Others
- 6.8.1. Key market trends, growth factors and opportunities
- 6.8.2. Market size and forecast, by region
- 6.8.3. Market share analysis by country
CHAPTER 7: FINGERPRINT BIOMETRICS MARKET, BY REGION
- 7.1. Overview
- 7.1.1. Market size and forecast By Region
- 7.2. North America
- 7.2.1. Key market trends, growth factors and opportunities
- 7.2.2. Market size and forecast, by Offering
- 7.2.3. Market size and forecast, by Type
- 7.2.4. Market size and forecast, by End User
- 7.2.5. Market size and forecast, by country
- 7.2.5.1. U.S.
- 7.2.5.1.1. Market size and forecast, by Offering
- 7.2.5.1.2. Market size and forecast, by Type
- 7.2.5.1.3. Market size and forecast, by End User
- 7.2.5.2. Canada
- 7.2.5.2.1. Market size and forecast, by Offering
- 7.2.5.2.2. Market size and forecast, by Type
- 7.2.5.2.3. Market size and forecast, by End User
- 7.3. Europe
- 7.3.1. Key market trends, growth factors and opportunities
- 7.3.2. Market size and forecast, by Offering
- 7.3.3. Market size and forecast, by Type
- 7.3.4. Market size and forecast, by End User
- 7.3.5. Market size and forecast, by country
- 7.3.5.1. UK
- 7.3.5.1.1. Market size and forecast, by Offering
- 7.3.5.1.2. Market size and forecast, by Type
- 7.3.5.1.3. Market size and forecast, by End User
- 7.3.5.2. Germany
- 7.3.5.2.1. Market size and forecast, by Offering
- 7.3.5.2.2. Market size and forecast, by Type
- 7.3.5.2.3. Market size and forecast, by End User
- 7.3.5.3. France
- 7.3.5.3.1. Market size and forecast, by Offering
- 7.3.5.3.2. Market size and forecast, by Type
- 7.3.5.3.3. Market size and forecast, by End User
- 7.3.5.4. Italy
- 7.3.5.4.1. Market size and forecast, by Offering
- 7.3.5.4.2. Market size and forecast, by Type
- 7.3.5.4.3. Market size and forecast, by End User
- 7.3.5.5. Spain
- 7.3.5.5.1. Market size and forecast, by Offering
- 7.3.5.5.2. Market size and forecast, by Type
- 7.3.5.5.3. Market size and forecast, by End User
- 7.3.5.6. Rest of Europe
- 7.3.5.6.1. Market size and forecast, by Offering
- 7.3.5.6.2. Market size and forecast, by Type
- 7.3.5.6.3. Market size and forecast, by End User
- 7.4. Asia-Pacific
- 7.4.1. Key market trends, growth factors and opportunities
- 7.4.2. Market size and forecast, by Offering
- 7.4.3. Market size and forecast, by Type
- 7.4.4. Market size and forecast, by End User
- 7.4.5. Market size and forecast, by country
- 7.4.5.1. China
- 7.4.5.1.1. Market size and forecast, by Offering
- 7.4.5.1.2. Market size and forecast, by Type
- 7.4.5.1.3. Market size and forecast, by End User
- 7.4.5.2. Japan
- 7.4.5.2.1. Market size and forecast, by Offering
- 7.4.5.2.2. Market size and forecast, by Type
- 7.4.5.2.3. Market size and forecast, by End User
- 7.4.5.3. India
- 7.4.5.3.1. Market size and forecast, by Offering
- 7.4.5.3.2. Market size and forecast, by Type
- 7.4.5.3.3. Market size and forecast, by End User
- 7.4.5.4. Australia
- 7.4.5.4.1. Market size and forecast, by Offering
- 7.4.5.4.2. Market size and forecast, by Type
- 7.4.5.4.3. Market size and forecast, by End User
- 7.4.5.5. South Korea
- 7.4.5.5.1. Market size and forecast, by Offering
- 7.4.5.5.2. Market size and forecast, by Type
- 7.4.5.5.3. Market size and forecast, by End User
- 7.4.5.6. Rest of Asia-Pacific
- 7.4.5.6.1. Market size and forecast, by Offering
- 7.4.5.6.2. Market size and forecast, by Type
- 7.4.5.6.3. Market size and forecast, by End User
- 7.5. Latin America
- 7.5.1. Key market trends, growth factors and opportunities
- 7.5.2. Market size and forecast, by Offering
- 7.5.3. Market size and forecast, by Type
- 7.5.4. Market size and forecast, by End User
- 7.5.5. Market size and forecast, by country
- 7.5.5.1. Brazil
- 7.5.5.1.1. Market size and forecast, by Offering
- 7.5.5.1.2. Market size and forecast, by Type
- 7.5.5.1.3. Market size and forecast, by End User
- 7.5.5.2. Mexico
- 7.5.5.2.1. Market size and forecast, by Offering
- 7.5.5.2.2. Market size and forecast, by Type
- 7.5.5.2.3. Market size and forecast, by End User
- 7.5.5.3. Argentina
- 7.5.5.3.1. Market size and forecast, by Offering
- 7.5.5.3.2. Market size and forecast, by Type
- 7.5.5.3.3. Market size and forecast, by End User
- 7.5.5.4. Rest of Latin America
- 7.5.5.4.1. Market size and forecast, by Offering
- 7.5.5.4.2. Market size and forecast, by Type
- 7.5.5.4.3. Market size and forecast, by End User
- 7.6. Middle East and Africa
- 7.6.1. Key market trends, growth factors and opportunities
- 7.6.2. Market size and forecast, by Offering
- 7.6.3. Market size and forecast, by Type
- 7.6.4. Market size and forecast, by End User
- 7.6.5. Market size and forecast, by country
- 7.6.5.1. Saudi Arabia
- 7.6.5.1.1. Market size and forecast, by Offering
- 7.6.5.1.2. Market size and forecast, by Type
- 7.6.5.1.3. Market size and forecast, by End User
- 7.6.5.2. UAE
- 7.6.5.2.1. Market size and forecast, by Offering
- 7.6.5.2.2. Market size and forecast, by Type
- 7.6.5.2.3. Market size and forecast, by End User
- 7.6.5.3. South Africa
- 7.6.5.3.1. Market size and forecast, by Offering
- 7.6.5.3.2. Market size and forecast, by Type
- 7.6.5.3.3. Market size and forecast, by End User
- 7.6.5.4. Rest of Middle East And Africa
- 7.6.5.4.1. Market size and forecast, by Offering
- 7.6.5.4.2. Market size and forecast, by Type
- 7.6.5.4.3. Market size and forecast, by End User
CHAPTER 8: COMPETITIVE LANDSCAPE
- 8.1. Introduction
- 8.2. Top winning strategies
- 8.3. Product mapping of top 10 player
- 8.4. Competitive dashboard
- 8.5. Competitive heatmap
- 8.6. Top player positioning, 2022
CHAPTER 9: COMPANY PROFILES
- 9.1. Thales
- 9.1.1. Company overview
- 9.1.2. Key executives
- 9.1.3. Company snapshot
- 9.1.4. Operating business segments
- 9.1.5. Product portfolio
- 9.1.6. Business performance
- 9.1.7. Key strategic moves and developments
- 9.2. Bio-Key International
- 9.2.1. Company overview
- 9.2.2. Key executives
- 9.2.3. Company snapshot
- 9.2.4. Operating business segments
- 9.2.5. Product portfolio
- 9.2.6. Business performance
- 9.2.7. Key strategic moves and developments
- 9.3. HID Global Corporation
- 9.3.1. Company overview
- 9.3.2. Key executives
- 9.3.3. Company snapshot
- 9.3.4. Operating business segments
- 9.3.5. Product portfolio
- 9.3.6. Business performance
- 9.3.7. Key strategic moves and developments
- 9.4. M2SYS Technology
- 9.4.1. Company overview
- 9.4.2. Key executives
- 9.4.3. Company snapshot
- 9.4.4. Operating business segments
- 9.4.5. Product portfolio
- 9.4.6. Business performance
- 9.4.7. Key strategic moves and developments
- 9.5. NEC Corporation
- 9.5.1. Company overview
- 9.5.2. Key executives
- 9.5.3. Company snapshot
- 9.5.4. Operating business segments
- 9.5.5. Product portfolio
- 9.5.6. Business performance
- 9.5.7. Key strategic moves and developments
- 9.6. IDEMIA
- 9.6.1. Company overview
- 9.6.2. Key executives
- 9.6.3. Company snapshot
- 9.6.4. Operating business segments
- 9.6.5. Product portfolio
- 9.6.6. Business performance
- 9.6.7. Key strategic moves and developments
- 9.7. Anviz Global Inc.
- 9.7.1. Company overview
- 9.7.2. Key executives
- 9.7.3. Company snapshot
- 9.7.4. Operating business segments
- 9.7.5. Product portfolio
- 9.7.6. Business performance
- 9.7.7. Key strategic moves and developments
- 9.8. DERMALOG Identification Systems GmbH
- 9.8.1. Company overview
- 9.8.2. Key executives
- 9.8.3. Company snapshot
- 9.8.4. Operating business segments
- 9.8.5. Product portfolio
- 9.8.6. Business performance
- 9.8.7. Key strategic moves and developments
- 9.9. Fingerprint Cards AB
- 9.9.1. Company overview
- 9.9.2. Key executives
- 9.9.3. Company snapshot
- 9.9.4. Operating business segments
- 9.9.5. Product portfolio
- 9.9.6. Business performance
- 9.9.7. Key strategic moves and developments
- 9.10. FingerCheck
- 9.10.1. Company overview
- 9.10.2. Key executives
- 9.10.3. Company snapshot
- 9.10.4. Operating business segments
- 9.10.5. Product portfolio
- 9.10.6. Business performance
- 9.10.7. Key strategic moves and developments
LIST OF TABLES
- TABLE 01. GLOBAL FINGERPRINT BIOMETRICS MARKET, BY OFFERING, 2022-2032 ($MILLION)
- TABLE 02. FINGERPRINT BIOMETRICS MARKET FOR HARDWARE, BY REGION, 2022-2032 ($MILLION)
- TABLE 03. FINGERPRINT BIOMETRICS MARKET FOR SOFTWARE, BY REGION, 2022-2032 ($MILLION)
- TABLE 04. FINGERPRINT BIOMETRICS MARKET FOR SERVICES, BY REGION, 2022-2032 ($MILLION)
- TABLE 05. GLOBAL FINGERPRINT BIOMETRICS MARKET, BY TYPE, 2022-2032 ($MILLION)
- TABLE 06. FINGERPRINT BIOMETRICS MARKET FOR AFIS TECHNOLOGY, BY REGION, 2022-2032 ($MILLION)
- TABLE 07. FINGERPRINT BIOMETRICS MARKET FOR NON-AFIS TECHNOLOGY, BY REGION, 2022-2032 ($MILLION)
- TABLE 08. GLOBAL FINGERPRINT BIOMETRICS MARKET, BY END USER, 2022-2032 ($MILLION)
- TABLE 09. FINGERPRINT BIOMETRICS MARKET FOR BFSI, BY REGION, 2022-2032 ($MILLION)
- TABLE 10. FINGERPRINT BIOMETRICS MARKET FOR HEALTHCARE, BY REGION, 2022-2032 ($MILLION)
- TABLE 11. FINGERPRINT BIOMETRICS MARKET FOR TRAVEL AND TOURISM, BY REGION, 2022-2032 ($MILLION)
- TABLE 12. FINGERPRINT BIOMETRICS MARKET FOR IT AND TELECOM, BY REGION, 2022-2032 ($MILLION)
- TABLE 13. FINGERPRINT BIOMETRICS MARKET FOR GOVERNMENT AND DEFENSE, BY REGION, 2022-2032 ($MILLION)
- TABLE 14. FINGERPRINT BIOMETRICS MARKET FOR AUTOMOTIVE, BY REGION, 2022-2032 ($MILLION)
- TABLE 15. FINGERPRINT BIOMETRICS MARKET FOR OTHERS, BY REGION, 2022-2032 ($MILLION)
- TABLE 16. FINGERPRINT BIOMETRICS MARKET, BY REGION, 2022-2032 ($MILLION)
- TABLE 17. NORTH AMERICA FINGERPRINT BIOMETRICS MARKET, BY OFFERING, 2022-2032 ($MILLION)
- TABLE 18. NORTH AMERICA FINGERPRINT BIOMETRICS MARKET, BY TYPE, 2022-2032 ($MILLION)
- TABLE 19. NORTH AMERICA FINGERPRINT BIOMETRICS MARKET, BY END USER, 2022-2032 ($MILLION)
- TABLE 20. NORTH AMERICA FINGERPRINT BIOMETRICS MARKET, BY COUNTRY, 2022-2032 ($MILLION)
- TABLE 21. U.S. FINGERPRINT BIOMETRICS MARKET, BY OFFERING, 2022-2032 ($MILLION)
- TABLE 22. U.S. FINGERPRINT BIOMETRICS MARKET, BY TYPE, 2022-2032 ($MILLION)
- TABLE 23. U.S. FINGERPRINT BIOMETRICS MARKET, BY END USER, 2022-2032 ($MILLION)
- TABLE 24. CANADA FINGERPRINT BIOMETRICS MARKET, BY OFFERING, 2022-2032 ($MILLION)
- TABLE 25. CANADA FINGERPRINT BIOMETRICS MARKET, BY TYPE, 2022-2032 ($MILLION)
- TABLE 26. CANADA FINGERPRINT BIOMETRICS MARKET, BY END USER, 2022-2032 ($MILLION)
- TABLE 27. EUROPE FINGERPRINT BIOMETRICS MARKET, BY OFFERING, 2022-2032 ($MILLION)
- TABLE 28. EUROPE FINGERPRINT BIOMETRICS MARKET, BY TYPE, 2022-2032 ($MILLION)
- TABLE 29. EUROPE FINGERPRINT BIOMETRICS MARKET, BY END USER, 2022-2032 ($MILLION)
- TABLE 30. EUROPE FINGERPRINT BIOMETRICS MARKET, BY COUNTRY, 2022-2032 ($MILLION)
- TABLE 31. UK FINGERPRINT BIOMETRICS MARKET, BY OFFERING, 2022-2032 ($MILLION)
- TABLE 32. UK FINGERPRINT BIOMETRICS MARKET, BY TYPE, 2022-2032 ($MILLION)
- TABLE 33. UK FINGERPRINT BIOMETRICS MARKET, BY END USER, 2022-2032 ($MILLION)
- TABLE 34. GERMANY FINGERPRINT BIOMETRICS MARKET, BY OFFERING, 2022-2032 ($MILLION)
- TABLE 35. GERMANY FINGERPRINT BIOMETRICS MARKET, BY TYPE, 2022-2032 ($MILLION)
- TABLE 36. GERMANY FINGERPRINT BIOMETRICS MARKET, BY END USER, 2022-2032 ($MILLION)
- TABLE 37. FRANCE FINGERPRINT BIOMETRICS MARKET, BY OFFERING, 2022-2032 ($MILLION)
- TABLE 38. FRANCE FINGERPRINT BIOMETRICS MARKET, BY TYPE, 2022-2032 ($MILLION)
- TABLE 39. FRANCE FINGERPRINT BIOMETRICS MARKET, BY END USER, 2022-2032 ($MILLION)
- TABLE 40. ITALY FINGERPRINT BIOMETRICS MARKET, BY OFFERING, 2022-2032 ($MILLION)
- TABLE 41. ITALY FINGERPRINT BIOMETRICS MARKET, BY TYPE, 2022-2032 ($MILLION)
- TABLE 42. ITALY FINGERPRINT BIOMETRICS MARKET, BY END USER, 2022-2032 ($MILLION)
- TABLE 43. SPAIN FINGERPRINT BIOMETRICS MARKET, BY OFFERING, 2022-2032 ($MILLION)
- TABLE 44. SPAIN FINGERPRINT BIOMETRICS MARKET, BY TYPE, 2022-2032 ($MILLION)
- TABLE 45. SPAIN FINGERPRINT BIOMETRICS MARKET, BY END USER, 2022-2032 ($MILLION)
- TABLE 46. REST OF EUROPE FINGERPRINT BIOMETRICS MARKET, BY OFFERING, 2022-2032 ($MILLION)
- TABLE 47. REST OF EUROPE FINGERPRINT BIOMETRICS MARKET, BY TYPE, 2022-2032 ($MILLION)
- TABLE 48. REST OF EUROPE FINGERPRINT BIOMETRICS MARKET, BY END USER, 2022-2032 ($MILLION)
- TABLE 49. ASIA-PACIFIC FINGERPRINT BIOMETRICS MARKET, BY OFFERING, 2022-2032 ($MILLION)
- TABLE 50. ASIA-PACIFIC FINGERPRINT BIOMETRICS MARKET, BY TYPE, 2022-2032 ($MILLION)
- TABLE 51. ASIA-PACIFIC FINGERPRINT BIOMETRICS MARKET, BY END USER, 2022-2032 ($MILLION)
- TABLE 52. ASIA-PACIFIC FINGERPRINT BIOMETRICS MARKET, BY COUNTRY, 2022-2032 ($MILLION)
- TABLE 53. CHINA FINGERPRINT BIOMETRICS MARKET, BY OFFERING, 2022-2032 ($MILLION)
- TABLE 54. CHINA FINGERPRINT BIOMETRICS MARKET, BY TYPE, 2022-2032 ($MILLION)
- TABLE 55. CHINA FINGERPRINT BIOMETRICS MARKET, BY END USER, 2022-2032 ($MILLION)
- TABLE 56. JAPAN FINGERPRINT BIOMETRICS MARKET, BY OFFERING, 2022-2032 ($MILLION)
- TABLE 57. JAPAN FINGERPRINT BIOMETRICS MARKET, BY TYPE, 2022-2032 ($MILLION)
- TABLE 58. JAPAN FINGERPRINT BIOMETRICS MARKET, BY END USER, 2022-2032 ($MILLION)
- TABLE 59. INDIA FINGERPRINT BIOMETRICS MARKET, BY OFFERING, 2022-2032 ($MILLION)
- TABLE 60. INDIA FINGERPRINT BIOMETRICS MARKET, BY TYPE, 2022-2032 ($MILLION)
- TABLE 61. INDIA FINGERPRINT BIOMETRICS MARKET, BY END USER, 2022-2032 ($MILLION)
- TABLE 62. AUSTRALIA FINGERPRINT BIOMETRICS MARKET, BY OFFERING, 2022-2032 ($MILLION)
- TABLE 63. AUSTRALIA FINGERPRINT BIOMETRICS MARKET, BY TYPE, 2022-2032 ($MILLION)
- TABLE 64. AUSTRALIA FINGERPRINT BIOMETRICS MARKET, BY END USER, 2022-2032 ($MILLION)
- TABLE 65. SOUTH KOREA FINGERPRINT BIOMETRICS MARKET, BY OFFERING, 2022-2032 ($MILLION)
- TABLE 66. SOUTH KOREA FINGERPRINT BIOMETRICS MARKET, BY TYPE, 2022-2032 ($MILLION)
- TABLE 67. SOUTH KOREA FINGERPRINT BIOMETRICS MARKET, BY END USER, 2022-2032 ($MILLION)
- TABLE 68. REST OF ASIA-PACIFIC FINGERPRINT BIOMETRICS MARKET, BY OFFERING, 2022-2032 ($MILLION)
- TABLE 69. REST OF ASIA-PACIFIC FINGERPRINT BIOMETRICS MARKET, BY TYPE, 2022-2032 ($MILLION)
- TABLE 70. REST OF ASIA-PACIFIC FINGERPRINT BIOMETRICS MARKET, BY END USER, 2022-2032 ($MILLION)
- TABLE 71. LATIN AMERICA FINGERPRINT BIOMETRICS MARKET, BY OFFERING, 2022-2032 ($MILLION)
- TABLE 72. LATIN AMERICA FINGERPRINT BIOMETRICS MARKET, BY TYPE, 2022-2032 ($MILLION)
- TABLE 73. LATIN AMERICA FINGERPRINT BIOMETRICS MARKET, BY END USER, 2022-2032 ($MILLION)
- TABLE 74. LATIN AMERICA FINGERPRINT BIOMETRICS MARKET, BY COUNTRY, 2022-2032 ($MILLION)
- TABLE 75. BRAZIL FINGERPRINT BIOMETRICS MARKET, BY OFFERING, 2022-2032 ($MILLION)
- TABLE 76. BRAZIL FINGERPRINT BIOMETRICS MARKET, BY TYPE, 2022-2032 ($MILLION)
- TABLE 77. BRAZIL FINGERPRINT BIOMETRICS MARKET, BY END USER, 2022-2032 ($MILLION)
- TABLE 78. MEXICO FINGERPRINT BIOMETRICS MARKET, BY OFFERING, 2022-2032 ($MILLION)
- TABLE 79. MEXICO FINGERPRINT BIOMETRICS MARKET, BY TYPE, 2022-2032 ($MILLION)
- TABLE 80. MEXICO FINGERPRINT BIOMETRICS MARKET, BY END USER, 2022-2032 ($MILLION)
- TABLE 81. ARGENTINA FINGERPRINT BIOMETRICS MARKET, BY OFFERING, 2022-2032 ($MILLION)
- TABLE 82. ARGENTINA FINGERPRINT BIOMETRICS MARKET, BY TYPE, 2022-2032 ($MILLION)
- TABLE 83. ARGENTINA FINGERPRINT BIOMETRICS MARKET, BY END USER, 2022-2032 ($MILLION)
- TABLE 84. REST OF LATIN AMERICA FINGERPRINT BIOMETRICS MARKET, BY OFFERING, 2022-2032 ($MILLION)
- TABLE 85. REST OF LATIN AMERICA FINGERPRINT BIOMETRICS MARKET, BY TYPE, 2022-2032 ($MILLION)
- TABLE 86. REST OF LATIN AMERICA FINGERPRINT BIOMETRICS MARKET, BY END USER, 2022-2032 ($MILLION)
- TABLE 87. MIDDLE EAST AND AFRICA FINGERPRINT BIOMETRICS MARKET, BY OFFERING, 2022-2032 ($MILLION)
- TABLE 88. MIDDLE EAST AND AFRICA FINGERPRINT BIOMETRICS MARKET, BY TYPE, 2022-2032 ($MILLION)
- TABLE 89. MIDDLE EAST AND AFRICA FINGERPRINT BIOMETRICS MARKET, BY END USER, 2022-2032 ($MILLION)
- TABLE 90. MIDDLE EAST AND AFRICA FINGERPRINT BIOMETRICS MARKET, BY COUNTRY, 2022-2032 ($MILLION)
- TABLE 91. SAUDI ARABIA FINGERPRINT BIOMETRICS MARKET, BY OFFERING, 2022-2032 ($MILLION)
- TABLE 92. SAUDI ARABIA FINGERPRINT BIOMETRICS MARKET, BY TYPE, 2022-2032 ($MILLION)
- TABLE 93. SAUDI ARABIA FINGERPRINT BIOMETRICS MARKET, BY END USER, 2022-2032 ($MILLION)
- TABLE 94. UAE FINGERPRINT BIOMETRICS MARKET, BY OFFERING, 2022-2032 ($MILLION)
- TABLE 95. UAE FINGERPRINT BIOMETRICS MARKET, BY TYPE, 2022-2032 ($MILLION)
- TABLE 96. UAE FINGERPRINT BIOMETRICS MARKET, BY END USER, 2022-2032 ($MILLION)
- TABLE 97. SOUTH AFRICA FINGERPRINT BIOMETRICS MARKET, BY OFFERING, 2022-2032 ($MILLION)
- TABLE 98. SOUTH AFRICA FINGERPRINT BIOMETRICS MARKET, BY TYPE, 2022-2032 ($MILLION)
- TABLE 99. SOUTH AFRICA FINGERPRINT BIOMETRICS MARKET, BY END USER, 2022-2032 ($MILLION)
- TABLE 100. REST OF MIDDLE EAST AND AFRICA FINGERPRINT BIOMETRICS MARKET, BY OFFERING, 2022-2032 ($MILLION)
- TABLE 101. REST OF MIDDLE EAST AND AFRICA FINGERPRINT BIOMETRICS MARKET, BY TYPE, 2022-2032 ($MILLION)
- TABLE 102. REST OF MIDDLE EAST AND AFRICA FINGERPRINT BIOMETRICS MARKET, BY END USER, 2022-2032 ($MILLION)
- TABLE 103. THALES: KEY EXECUTIVES
- TABLE 104. THALES: COMPANY SNAPSHOT
- TABLE 105. THALES: PRODUCT SEGMENTS
- TABLE 106. THALES: SERVICE SEGMENTS
- TABLE 107. THALES: PRODUCT PORTFOLIO
- TABLE 108. THALES: KEY STRATERGIES
- TABLE 109. BIO-KEY INTERNATIONAL: KEY EXECUTIVES
- TABLE 110. BIO-KEY INTERNATIONAL: COMPANY SNAPSHOT
- TABLE 111. BIO-KEY INTERNATIONAL: PRODUCT SEGMENTS
- TABLE 112. BIO-KEY INTERNATIONAL: SERVICE SEGMENTS
- TABLE 113. BIO-KEY INTERNATIONAL: PRODUCT PORTFOLIO
- TABLE 114. BIO-KEY INTERNATIONAL: KEY STRATERGIES
- TABLE 115. HID GLOBAL CORPORATION: KEY EXECUTIVES
- TABLE 116. HID GLOBAL CORPORATION: COMPANY SNAPSHOT
- TABLE 117. HID GLOBAL CORPORATION: PRODUCT SEGMENTS
- TABLE 118. HID GLOBAL CORPORATION: SERVICE SEGMENTS
- TABLE 119. HID GLOBAL CORPORATION: PRODUCT PORTFOLIO
- TABLE 120. HID GLOBAL CORPORATION: KEY STRATERGIES
- TABLE 121. M2SYS TECHNOLOGY: KEY EXECUTIVES
- TABLE 122. M2SYS TECHNOLOGY: COMPANY SNAPSHOT
- TABLE 123. M2SYS TECHNOLOGY: PRODUCT SEGMENTS
- TABLE 124. M2SYS TECHNOLOGY: SERVICE SEGMENTS
- TABLE 125. M2SYS TECHNOLOGY: PRODUCT PORTFOLIO
- TABLE 126. M2SYS TECHNOLOGY: KEY STRATERGIES
- TABLE 127. NEC CORPORATION: KEY EXECUTIVES
- TABLE 128. NEC CORPORATION: COMPANY SNAPSHOT
- TABLE 129. NEC CORPORATION: PRODUCT SEGMENTS
- TABLE 130. NEC CORPORATION: SERVICE SEGMENTS
- TABLE 131. NEC CORPORATION: PRODUCT PORTFOLIO
- TABLE 132. NEC CORPORATION: KEY STRATERGIES
- TABLE 133. IDEMIA: KEY EXECUTIVES
- TABLE 134. IDEMIA: COMPANY SNAPSHOT
- TABLE 135. IDEMIA: PRODUCT SEGMENTS
- TABLE 136. IDEMIA: SERVICE SEGMENTS
- TABLE 137. IDEMIA: PRODUCT PORTFOLIO
- TABLE 138. IDEMIA: KEY STRATERGIES
- TABLE 139. ANVIZ GLOBAL INC.: KEY EXECUTIVES
- TABLE 140. ANVIZ GLOBAL INC.: COMPANY SNAPSHOT
- TABLE 141. ANVIZ GLOBAL INC.: PRODUCT SEGMENTS
- TABLE 142. ANVIZ GLOBAL INC.: SERVICE SEGMENTS
- TABLE 143. ANVIZ GLOBAL INC.: PRODUCT PORTFOLIO
- TABLE 144. ANVIZ GLOBAL INC.: KEY STRATERGIES
- TABLE 145. DERMALOG IDENTIFICATION SYSTEMS GMBH: KEY EXECUTIVES
- TABLE 146. DERMALOG IDENTIFICATION SYSTEMS GMBH: COMPANY SNAPSHOT
- TABLE 147. DERMALOG IDENTIFICATION SYSTEMS GMBH: PRODUCT SEGMENTS
- TABLE 148. DERMALOG IDENTIFICATION SYSTEMS GMBH: SERVICE SEGMENTS
- TABLE 149. DERMALOG IDENTIFICATION SYSTEMS GMBH: PRODUCT PORTFOLIO
- TABLE 150. DERMALOG IDENTIFICATION SYSTEMS GMBH: KEY STRATERGIES
- TABLE 151. FINGERPRINT CARDS AB: KEY EXECUTIVES
- TABLE 152. FINGERPRINT CARDS AB: COMPANY SNAPSHOT
- TABLE 153. FINGERPRINT CARDS AB: PRODUCT SEGMENTS
- TABLE 154. FINGERPRINT CARDS AB: SERVICE SEGMENTS
- TABLE 155. FINGERPRINT CARDS AB: PRODUCT PORTFOLIO
- TABLE 156. FINGERPRINT CARDS AB: KEY STRATERGIES
- TABLE 157. FINGERCHECK: KEY EXECUTIVES
- TABLE 158. FINGERCHECK: COMPANY SNAPSHOT
- TABLE 159. FINGERCHECK: PRODUCT SEGMENTS
- TABLE 160. FINGERCHECK: SERVICE SEGMENTS
- TABLE 161. FINGERCHECK: PRODUCT PORTFOLIO
- TABLE 162. FINGERCHECK: KEY STRATERGIES
LIST OF FIGURES
- FIGURE 01. FINGERPRINT BIOMETRICS MARKET, 2022-2032
- FIGURE 02. SEGMENTATION OF FINGERPRINT BIOMETRICS MARKET,2022-2032
- FIGURE 03. TOP IMPACTING FACTORS IN FINGERPRINT BIOMETRICS MARKET
- FIGURE 04. TOP INVESTMENT POCKETS IN FINGERPRINT BIOMETRICS MARKET (2023-2032)
- FIGURE 05. BARGAINING POWER OF SUPPLIERS
- FIGURE 06. BARGAINING POWER OF BUYERS
- FIGURE 07. THREAT OF SUBSTITUTION
- FIGURE 08. THREAT OF SUBSTITUTION
- FIGURE 09. COMPETITIVE RIVALRY
- FIGURE 10. GLOBAL FINGERPRINT BIOMETRICS MARKET:DRIVERS, RESTRAINTS AND OPPORTUNITIES
- FIGURE 11. FINGERPRINT BIOMETRICS MARKET, BY OFFERING, 2022 AND 2032(%)
- FIGURE 12. COMPARATIVE SHARE ANALYSIS OF FINGERPRINT BIOMETRICS MARKET FOR HARDWARE, BY COUNTRY 2022 AND 2032(%)
- FIGURE 13. COMPARATIVE SHARE ANALYSIS OF FINGERPRINT BIOMETRICS MARKET FOR SOFTWARE, BY COUNTRY 2022 AND 2032(%)
- FIGURE 14. COMPARATIVE SHARE ANALYSIS OF FINGERPRINT BIOMETRICS MARKET FOR SERVICES, BY COUNTRY 2022 AND 2032(%)
- FIGURE 15. FINGERPRINT BIOMETRICS MARKET, BY TYPE, 2022 AND 2032(%)
- FIGURE 16. COMPARATIVE SHARE ANALYSIS OF FINGERPRINT BIOMETRICS MARKET FOR AFIS TECHNOLOGY, BY COUNTRY 2022 AND 2032(%)
- FIGURE 17. COMPARATIVE SHARE ANALYSIS OF FINGERPRINT BIOMETRICS MARKET FOR NON-AFIS TECHNOLOGY, BY COUNTRY 2022 AND 2032(%)
- FIGURE 18. FINGERPRINT BIOMETRICS MARKET, BY END USER, 2022 AND 2032(%)
- FIGURE 19. COMPARATIVE SHARE ANALYSIS OF FINGERPRINT BIOMETRICS MARKET FOR BFSI, BY COUNTRY 2022 AND 2032(%)
- FIGURE 20. COMPARATIVE SHARE ANALYSIS OF FINGERPRINT BIOMETRICS MARKET FOR HEALTHCARE, BY COUNTRY 2022 AND 2032(%)
- FIGURE 21. COMPARATIVE SHARE ANALYSIS OF FINGERPRINT BIOMETRICS MARKET FOR TRAVEL AND TOURISM, BY COUNTRY 2022 AND 2032(%)
- FIGURE 22. COMPARATIVE SHARE ANALYSIS OF FINGERPRINT BIOMETRICS MARKET FOR IT AND TELECOM, BY COUNTRY 2022 AND 2032(%)
- FIGURE 23. COMPARATIVE SHARE ANALYSIS OF FINGERPRINT BIOMETRICS MARKET FOR GOVERNMENT AND DEFENSE, BY COUNTRY 2022 AND 2032(%)
- FIGURE 24. COMPARATIVE SHARE ANALYSIS OF FINGERPRINT BIOMETRICS MARKET FOR AUTOMOTIVE, BY COUNTRY 2022 AND 2032(%)
- FIGURE 25. COMPARATIVE SHARE ANALYSIS OF FINGERPRINT BIOMETRICS MARKET FOR OTHERS, BY COUNTRY 2022 AND 2032(%)
- FIGURE 26. FINGERPRINT BIOMETRICS MARKET BY REGION, 2022 AND 2032(%)
- FIGURE 27. U.S. FINGERPRINT BIOMETRICS MARKET, 2022-2032 ($MILLION)
- FIGURE 28. CANADA FINGERPRINT BIOMETRICS MARKET, 2022-2032 ($MILLION)
- FIGURE 29. UK FINGERPRINT BIOMETRICS MARKET, 2022-2032 ($MILLION)
- FIGURE 30. GERMANY FINGERPRINT BIOMETRICS MARKET, 2022-2032 ($MILLION)
- FIGURE 31. FRANCE FINGERPRINT BIOMETRICS MARKET, 2022-2032 ($MILLION)
- FIGURE 32. ITALY FINGERPRINT BIOMETRICS MARKET, 2022-2032 ($MILLION)
- FIGURE 33. SPAIN FINGERPRINT BIOMETRICS MARKET, 2022-2032 ($MILLION)
- FIGURE 34. REST OF EUROPE FINGERPRINT BIOMETRICS MARKET, 2022-2032 ($MILLION)
- FIGURE 35. CHINA FINGERPRINT BIOMETRICS MARKET, 2022-2032 ($MILLION)
- FIGURE 36. JAPAN FINGERPRINT BIOMETRICS MARKET, 2022-2032 ($MILLION)
- FIGURE 37. INDIA FINGERPRINT BIOMETRICS MARKET, 2022-2032 ($MILLION)
- FIGURE 38. AUSTRALIA FINGERPRINT BIOMETRICS MARKET, 2022-2032 ($MILLION)
- FIGURE 39. SOUTH KOREA FINGERPRINT BIOMETRICS MARKET, 2022-2032 ($MILLION)
- FIGURE 40. REST OF ASIA-PACIFIC FINGERPRINT BIOMETRICS MARKET, 2022-2032 ($MILLION)
- FIGURE 41. BRAZIL FINGERPRINT BIOMETRICS MARKET, 2022-2032 ($MILLION)
- FIGURE 42. MEXICO FINGERPRINT BIOMETRICS MARKET, 2022-2032 ($MILLION)
- FIGURE 43. ARGENTINA FINGERPRINT BIOMETRICS MARKET, 2022-2032 ($MILLION)
- FIGURE 44. REST OF LATIN AMERICA FINGERPRINT BIOMETRICS MARKET, 2022-2032 ($MILLION)
- FIGURE 45. SAUDI ARABIA FINGERPRINT BIOMETRICS MARKET, 2022-2032 ($MILLION)
- FIGURE 46. UAE FINGERPRINT BIOMETRICS MARKET, 2022-2032 ($MILLION)
- FIGURE 47. SOUTH AFRICA FINGERPRINT BIOMETRICS MARKET, 2022-2032 ($MILLION)
- FIGURE 48. REST OF MIDDLE EAST AND AFRICA FINGERPRINT BIOMETRICS MARKET, 2022-2032 ($MILLION)
- FIGURE 49. TOP WINNING STRATEGIES, BY YEAR
- FIGURE 50. TOP WINNING STRATEGIES, BY DEVELOPMENT
- FIGURE 51. TOP WINNING STRATEGIES, BY COMPANY
- FIGURE 52. PRODUCT MAPPING OF TOP 10 PLAYERS
- FIGURE 53. COMPETITIVE DASHBOARD
- FIGURE 54. COMPETITIVE HEATMAP: FINGERPRINT BIOMETRICS MARKET
- FIGURE 55. TOP PLAYER POSITIONING, 2022


