


 |
市场调查报告书
商品编码
1447156
冷痛治疗市场:按产品、应用、通路:2023-2032 年全球机会分析与产业预测Cold Pain Therapy Market By Product, By Application, By Distribution Channel : Global Opportunity Analysis and Industry Forecast, 2023-2032 |
||||||
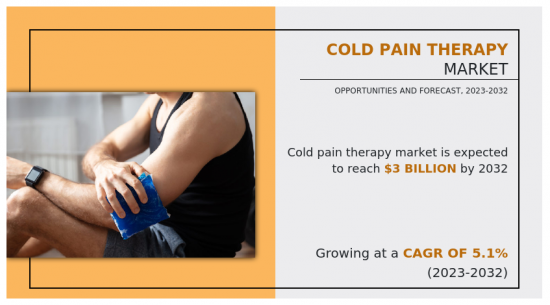
2022年冷痛疗法市场价值为19亿美元,预计到2032年将达到30.4亿美元,2023年至2032年的复合年增长率为5.1%。
冷冻疗法是指冷疗法。冷冻疗法有许多不同的方法,包括冰袋、冷却喷雾、冰按摩、热水浴缸和冰浴。当用于在家治疗受伤时,冷冻疗法通常是指使用冰块或凝胶袋进行冷疗,将其保存在冷冻库中直至需要。这些是一些最简单且经过时间考验的疼痛和肿胀治疗方法。
冷疗可以帮助减轻发炎。当用于急性损伤和疼痛时最有效。它有助于减缓关节和肌腱周围组织的损伤速度。冷冻疗法可以麻痹酸痛的肌肉组织,其作用几乎就像麻醉剂一样。它还具有减缓疼痛讯号传输到大脑的作用。冷敷是 RICE(休息、冰敷、压迫、抬高)的一部分,是治疗标准伤害的常见家庭治疗方法。
推动全球冷痛治疗市场成长的主要因素包括肌肉骨骼疾病、关节炎、骨关节炎、关节疾病等的增加,从而导致更先进和易于使用的冷痛治疗产品的开发。技术进步的扩散。此外,人口老化的加剧以及对长期使用止痛药相关潜在副作用和风险的认识不断提高,是推动非药物疼痛管理需求和市场成长的关键因素。此外,主要市场参与者的增加及其开发技术先进的冷痛治疗产品所采取的策略是推动冷痛治疗市场成长的主要因素。
例如,2023 年 3 月,行动和疼痛管理解决方案行业领导者 Aspen Medical Products (Aspen) 与运动和损伤恢復系统领先提供商 NICE Recovery Systems (NICE) 宣布结成战略联盟,旨在为患者提供医疗保健专业人员提供更好的恢復和疼痛管理解决方案。该合作伙伴关係利用 NICE 先进的冷压缩技术和 Aspen 有效的矫正器具解决方案,为从手术或受伤中恢復的患者提供疼痛管理和术后护理。
然而,越来越多地使用低成本止痛药来立即缓解疼痛,缺乏有利的报销限制了冷痛疗法市场的成长。相反,越来越多地采用止痛贴片预计将为预测期内冷痛治疗市场的成长提供利润丰厚的机会。
冷痛疗法市场分为产品、应用、通路和地区。从产品角度来看,市场分为非处方药产品和处方药产品。 OTC产品进一步细分为乳膏剂、凝胶剂、贴片等,处方笺产品进一步细分为电动和非电动装置。根据应用,它们分为肌肉骨骼疾病、术后治疗、运动伤害和创伤后治疗。依销售管道分为医院药局、零售药局、网路药局。
按地区划分,北美(美国、加拿大、墨西哥)、欧洲(德国、英国、英国、义大利、西班牙、其他欧洲国家地区)、亚太地区(中国、日本、澳洲、印度、韩国、其他亚太地区) )、拉丁美洲分析美洲(巴西、哥伦比亚、阿根廷和其他亚太地区)、中东美洲(海湾合作委员会、哥伦比亚、阿根廷和其他南美地区)。
相关人员的主要利益
- 本报告定量分析了 2022 年至 2032 年冷痛疗法市场分析的细分市场、当前趋势、估计/趋势和动态,以确定一般冷痛疗法市场机会。
- 我们提供市场研究以及与市场驱动因素、市场限制和市场机会相关的资讯。
- 波特的五力分析强调买家和供应商帮助相关人员做出利润驱动的商业决策并加强供应商-买家网路的力量。
- 冷痛疗法市场区隔的详细分析有助于识别市场机会。
- 每个地区的主要国家都根据其对全球市场的收益贡献绘製了地图。
- 市场参与者定位有助于基准化分析,并提供对市场参与者当前地位的清晰了解。
- 该报告包括对区域和全球冷痛疗法市场趋势、主要企业、细分市场、应用领域和市场成长策略的分析。
其他购买优惠包括:
- 季度更新和*(仅限公司许可证,按标价提供)
- 在购买之前或之后免费更新您选择的 5 个额外公司简介。
- 如果您购买 5 使用者许可证或企业使用者许可证,将免费提供下一个版本。
- 16 小时分析师支援*(购买后,如果您的报表审查显示有额外的资料需求,您将获得 16 小时分析师支持,以解决任何问题或售后查询。)
- 15% 免费自订*(如果报告的范围或部分不符合您的要求,15% 相当于 3 个工作日的免费工作。)
- 5 个用户许可证和企业用户许可证的免费资料包。 (Excel版报告)
- 如果您的报告超过 6-12 个月,我们将免费提供更新的报告。
- 24 小时优先回应*。
- 免费业界更新和白皮书
- 该报告可以定制(需要单独的成本和时间表)。
- 监管指引
- 根据客户兴趣新增其他公司简介
- 按国家或地区进行的附加分析 – 市场规模和预测
- 公司简介的扩充列表
- 历史市场资料
- 主要参与者的详细资料(Excel格式,包括位置、联络资讯、供应商/供应商网路等)
目录
第一章简介
第 2 章执行摘要
第三章市场概况
- 市场定义和范围
- 主要发现
- 影响因素
- 主要投资机会
- 波特五力分析
- 市场动态
- 促进因素
- 与运动相关的伤害增加。
- 手术次数增加。
- 外伤案件增加。
- 抑制因素
- 提供低成本止痛药来缓解疼痛。
- 机会
- 肌肉骨骼疾病的盛行率上升。
- 促进因素
第四章冷痛治疗市场:副产品
- 概述
- 非处方药产品
- 按非处方药产品类型分類的冷痛治疗市场
- 处方产品
- 按处方产品类型分類的冷痛治疗市场
第五章冷痛治疗市场:依应用分类
- 概述
- 肌肉骨骼疾病
- 术后治疗
- 运动伤害
- 创伤后治疗
第六章冷痛治疗市场:依通路划分
- 概述
- 医院药房
- 零售药房
- 网路药房
第七章冷痛治疗市场:依地区
- 概述
- 北美洲
- 美国
- 加拿大
- 墨西哥
- 欧洲
- 德国
- 法国
- 英国
- 义大利
- 西班牙
- 其他的
- 亚太地区
- 日本
- 中国
- 印度
- 澳洲
- 韩国
- 其他的
- 拉丁美洲
- 巴西
- 哥伦比亚
- 阿根廷
- 其他拉丁美洲
- 中东/非洲
- Gcc
- 南非
- 北非
- 其他的
第八章 竞争形势
- 介绍
- 关键成功策略
- 10家主要企业产品图谱
- 竞争对手仪表板
- 竞争热图
- 2022年主要企业定位
第九章 公司简介
- Cardinal Health Inc.
- Sanofi
- Medline Industries, LP
- Beiersdorf AG
- ThermoTek Inc
- 3M Company
- Hisamitsu Pharmaceutical Co.,Inc.
- Bruder Healthcare Company LLC
- Ossur
- Romsons Group of Industries Pvt. Ltd.
The cold pain therapy market was valued at $1.9 billion in 2022 and is estimated to reach $3.04 billion by 2032, exhibiting a CAGR of 5.1%from 2023 to 2032.
Cryotherapy means cold therapy. Cryotherapy can be applied in various ways, including icepacks, coolant sprays, ice massage, and whirlpools, or ice baths. When used to treat injuries at home, cryotherapy refers to cold therapy with ice or gel packs that are usually kept in the freezer until needed. These remain one of the simplest, time-tested remedies for managing pain and swelling.
Cold therapy helps reduce inflammation. It's most helpful when used for acute injuries and pain. It aids in slowing the rate of reducing tissue damage around a joint or tendon. Cold therapy can numb sore muscle tissue, almost acting as an anesthetic. It has the ability to slow down the pain signals that are transmitted to the brain. Cold compresses are part of a common at-home treatment for standard injuries - RICE - Rest, ice, compression, elevation.
Major factors that drive the growth of the global cold pain therapy market include a rise in the number of musculoskeletal disorders, arthritis, osteoarthritis, joint disorders and others, upsurge in technological advancement that have led to the development of more sophisticated and user-friendly cold pain therapy products. Furthermore, the growing aging population and growing awareness of the potential side effects and risks associated with long-term use of pain medications are the major factors that increase the demand for non-pharmacological pain management and hence propel the growth of the market. In addition, the increase in the number of key market players and the strategies they adopt for the development of technologically advanced cold pain therapy products are the major factors that boost the growth of the cold pain therapy market.
For instance, in March 2023, Aspen Medical Products (Aspen), the industry leader in solutions for mobility and pain management, and NICE Recovery Systems (NICE), a leading provider in the sports and injury recovery space, announced a strategic partnership that aims to bring more precise recovery and pain management solutions to patients and medical professionals. The partnership leverages NICE's advanced cold compression technology with Aspen's effective bracing solutions to deliver pain management and post-operative care to patients recovering from surgery or injury.
However, the growing use of low-priced analgesic pills for immediate pain relief and lack of favorable reimbursement restrain the growth of the cold pain therapy market. On the contrary, the increase in the adoption of analgesic patches is expected to provide lucrative opportunities for the cold pain therapy market to grow during the forecast period.
The cold pain therapy market is segmented into product, application, distribution channel, and region. On the basis of product, the market is bifurcated into OTC products and prescription products. The OTC products are further bifurcated into creams, gels, patches and others and the prescription products are sub-segmented into motorized devices and non-motorized devices. On the basis of application, it is segregated into musculoskeletal disorders, post-operative therapies, sport injuries and post-trauma therapy. On the basis of distribution channel, it is segmented into hospital pharmacies, retail pharmacies and online pharmacies.
On the basis of region, it is analyzed across North America (the U.S., Canada, and Mexico), Europe (Germany, France, the UK, Italy, Spain, and rest of Europe), Asia-Pacific (China, Japan, Australia, India, South Korea, and rest of Asia-Pacific), and Latin America (Brazil, Colombia, Argentina, Rest of LA) and Middle East and Africa (GCC, South Africa, North Africa, Rest of MEA)
The major players profiled in the report are Romsons Group of Industries, Cardinal Health Inc, Sanofi, Breg Inc., Medline Industries LP, Ossur, Hisamitsu Pharmaceutical Inc, Beiersdorf AG, 3M and ThermoTek Inc. The key players such as ThermoTek Inc and Hisamitsu Pharmaceutical Inc have adopted expansion as major developmental strategies to improve the product portfolio
Key Benefits For Stakeholders
- This report provides a quantitative analysis of the market segments, current trends, estimations, and dynamics of the cold pain therapy market analysis from 2022 to 2032 to identify the prevailing cold pain therapy market opportunities.
- The market research is offered along with information related to key drivers, restraints, and opportunities.
- Porter's five forces analysis highlights the potency of buyers and suppliers to enable stakeholders make profit-oriented business decisions and strengthen their supplier-buyer network.
- In-depth analysis of the cold pain therapy market segmentation assists to determine the prevailing market opportunities.
- Major countries in each region are mapped according to their revenue contribution to the global market.
- Market player positioning facilitates benchmarking and provides a clear understanding of the present position of the market players.
- The report includes the analysis of the regional as well as global cold pain therapy market trends, key players, market segments, application areas, and market growth strategies.
Additional benefits you will get with this purchase are:
- Quarterly Update and* (only available with a corporate license, on listed price)
- 5 additional Company Profile of client Choice pre- or Post-purchase, as a free update.
- Free Upcoming Version on the Purchase of Five and Enterprise User License.
- 16 analyst hours of support* (post-purchase, if you find additional data requirements upon review of the report, you may receive support amounting to 16 analyst hours to solve questions, and post-sale queries)
- 15% Free Customization* (in case the scope or segment of the report does not match your requirements, 15% is equivalent to 3 working days of free work, applicable once)
- Free data Pack on the Five and Enterprise User License. (Excel version of the report)
- Free Updated report if the report is 6-12 months old or older.
- 24-hour priority response*
- Free Industry updates and white papers.
- Possible Customization with this report (with additional cost and timeline, please talk to the sales executive to know more)
- Regulatory Guidelines
- Additional company profiles with specific to client's interest
- Additional country or region analysis- market size and forecast
- Expanded list for Company Profiles
- Historic market data
- Key player details (including location, contact details, supplier/vendor network etc. in excel format)
Key Market Segments
By Product
- OTC Products
- Type
- Creams
- Gels
- Patches
- Others
- Prescription Products
- Type
- Motorized Devices
- Non Motorized Devices
By Application
- Musculoskeletal Disorders
- Post-Operative Therapy
- Sports Injuries
- Post-Trauma Therapy
By Distribution Channel
- Hospitals Pharmacies
- Retail Pharmacies
- Online Pharmacies
By Region
- North America
- U.S.
- Canada
- Mexico
- Europe
- Germany
- France
- UK
- Italy
- Spain
- Rest of Europe
- Asia-Pacific
- Japan
- China
- India
- Australia
- South Korea
- Rest of Asia-Pacific
- Latin America
- Brazil
- Colombia
- Argentina
- Rest of Latin America
- Middle East and Africa
- Gcc
- South Africa
- North Africa
- Rest Of Mea
Key Market Players:
- Sanofi
- Beiersdorf AG
- 3M Company
- Medline Industries, LP
- Ossur
- Romsons Group of Industries Pvt. Ltd.
- Cardinal Health Inc.
- ThermoTek Inc
- Hisamitsu Pharmaceutical Co.,Inc.
- Bruder Healthcare Company LLC
TABLE OF CONTENTS
CHAPTER 1: INTRODUCTION
- 1.1. Report description
- 1.2. Key market segments
- 1.3. Key benefits to the stakeholders
- 1.4. Research methodology
- 1.4.1. Primary research
- 1.4.2. Secondary research
- 1.4.3. Analyst tools and models
CHAPTER 2: EXECUTIVE SUMMARY
- 2.1. CXO Perspective
CHAPTER 3: MARKET OVERVIEW
- 3.1. Market definition and scope
- 3.2. Key findings
- 3.2.1. Top impacting factors
- 3.2.2. Top investment pockets
- 3.3. Porter's five forces analysis
- 3.3.1. Low bargaining power of suppliers
- 3.3.2. Low threat of new entrants
- 3.3.3. Low threat of substitutes
- 3.3.4. Low intensity of rivalry
- 3.3.5. Low bargaining power of buyers
- 3.4. Market dynamics
- 3.4.1. Drivers
- 3.4.1.1. Increase in the number of sports related injuries.
- 3.4.1.2. Increase in the number of surgical procedures.
- 3.4.1.3. Rise in the number of traumatic injury cases.
- 3.4.2. Restraints
- 3.4.2.1. Availability of low-priced analgesic pills for pain relief
- 3.4.3. Opportunities
- 3.4.3.1. Rise in the prevalence of musculoskeletal disorders.
- 3.4.1. Drivers
CHAPTER 4: COLD PAIN THERAPY MARKET, BY PRODUCT
- 4.1. Overview
- 4.1.1. Market size and forecast
- 4.2. OTC Products
- 4.2.1. Key market trends, growth factors and opportunities
- 4.2.2. Market size and forecast, by region
- 4.2.3. Market share analysis by country
- 4.2.4. OTC Products Cold Pain Therapy Market by Type
- 4.3. Prescription Products
- 4.3.1. Key market trends, growth factors and opportunities
- 4.3.2. Market size and forecast, by region
- 4.3.3. Market share analysis by country
- 4.3.4. Prescription Products Cold Pain Therapy Market by Type
CHAPTER 5: COLD PAIN THERAPY MARKET, BY APPLICATION
- 5.1. Overview
- 5.1.1. Market size and forecast
- 5.2. Musculoskeletal Disorders
- 5.2.1. Key market trends, growth factors and opportunities
- 5.2.2. Market size and forecast, by region
- 5.2.3. Market share analysis by country
- 5.3. Post-Operative Therapy
- 5.3.1. Key market trends, growth factors and opportunities
- 5.3.2. Market size and forecast, by region
- 5.3.3. Market share analysis by country
- 5.4. Sports Injuries
- 5.4.1. Key market trends, growth factors and opportunities
- 5.4.2. Market size and forecast, by region
- 5.4.3. Market share analysis by country
- 5.5. Post-Trauma Therapy
- 5.5.1. Key market trends, growth factors and opportunities
- 5.5.2. Market size and forecast, by region
- 5.5.3. Market share analysis by country
CHAPTER 6: COLD PAIN THERAPY MARKET, BY DISTRIBUTION CHANNEL
- 6.1. Overview
- 6.1.1. Market size and forecast
- 6.2. Hospitals Pharmacies
- 6.2.1. Key market trends, growth factors and opportunities
- 6.2.2. Market size and forecast, by region
- 6.2.3. Market share analysis by country
- 6.3. Retail Pharmacies
- 6.3.1. Key market trends, growth factors and opportunities
- 6.3.2. Market size and forecast, by region
- 6.3.3. Market share analysis by country
- 6.4. Online Pharmacies
- 6.4.1. Key market trends, growth factors and opportunities
- 6.4.2. Market size and forecast, by region
- 6.4.3. Market share analysis by country
CHAPTER 7: COLD PAIN THERAPY MARKET, BY REGION
- 7.1. Overview
- 7.1.1. Market size and forecast By Region
- 7.2. North America
- 7.2.1. Key market trends, growth factors and opportunities
- 7.2.2. Market size and forecast, by Product
- 7.2.3. Market size and forecast, by Application
- 7.2.4. Market size and forecast, by Distribution Channel
- 7.2.5. Market size and forecast, by country
- 7.2.5.1. U.S.
- 7.2.5.1.1. Market size and forecast, by Product
- 7.2.5.1.2. Market size and forecast, by Application
- 7.2.5.1.3. Market size and forecast, by Distribution Channel
- 7.2.5.2. Canada
- 7.2.5.2.1. Market size and forecast, by Product
- 7.2.5.2.2. Market size and forecast, by Application
- 7.2.5.2.3. Market size and forecast, by Distribution Channel
- 7.2.5.3. Mexico
- 7.2.5.3.1. Market size and forecast, by Product
- 7.2.5.3.2. Market size and forecast, by Application
- 7.2.5.3.3. Market size and forecast, by Distribution Channel
- 7.3. Europe
- 7.3.1. Key market trends, growth factors and opportunities
- 7.3.2. Market size and forecast, by Product
- 7.3.3. Market size and forecast, by Application
- 7.3.4. Market size and forecast, by Distribution Channel
- 7.3.5. Market size and forecast, by country
- 7.3.5.1. Germany
- 7.3.5.1.1. Market size and forecast, by Product
- 7.3.5.1.2. Market size and forecast, by Application
- 7.3.5.1.3. Market size and forecast, by Distribution Channel
- 7.3.5.2. France
- 7.3.5.2.1. Market size and forecast, by Product
- 7.3.5.2.2. Market size and forecast, by Application
- 7.3.5.2.3. Market size and forecast, by Distribution Channel
- 7.3.5.3. UK
- 7.3.5.3.1. Market size and forecast, by Product
- 7.3.5.3.2. Market size and forecast, by Application
- 7.3.5.3.3. Market size and forecast, by Distribution Channel
- 7.3.5.4. Italy
- 7.3.5.4.1. Market size and forecast, by Product
- 7.3.5.4.2. Market size and forecast, by Application
- 7.3.5.4.3. Market size and forecast, by Distribution Channel
- 7.3.5.5. Spain
- 7.3.5.5.1. Market size and forecast, by Product
- 7.3.5.5.2. Market size and forecast, by Application
- 7.3.5.5.3. Market size and forecast, by Distribution Channel
- 7.3.5.6. Rest of Europe
- 7.3.5.6.1. Market size and forecast, by Product
- 7.3.5.6.2. Market size and forecast, by Application
- 7.3.5.6.3. Market size and forecast, by Distribution Channel
- 7.4. Asia-Pacific
- 7.4.1. Key market trends, growth factors and opportunities
- 7.4.2. Market size and forecast, by Product
- 7.4.3. Market size and forecast, by Application
- 7.4.4. Market size and forecast, by Distribution Channel
- 7.4.5. Market size and forecast, by country
- 7.4.5.1. Japan
- 7.4.5.1.1. Market size and forecast, by Product
- 7.4.5.1.2. Market size and forecast, by Application
- 7.4.5.1.3. Market size and forecast, by Distribution Channel
- 7.4.5.2. China
- 7.4.5.2.1. Market size and forecast, by Product
- 7.4.5.2.2. Market size and forecast, by Application
- 7.4.5.2.3. Market size and forecast, by Distribution Channel
- 7.4.5.3. India
- 7.4.5.3.1. Market size and forecast, by Product
- 7.4.5.3.2. Market size and forecast, by Application
- 7.4.5.3.3. Market size and forecast, by Distribution Channel
- 7.4.5.4. Australia
- 7.4.5.4.1. Market size and forecast, by Product
- 7.4.5.4.2. Market size and forecast, by Application
- 7.4.5.4.3. Market size and forecast, by Distribution Channel
- 7.4.5.5. South Korea
- 7.4.5.5.1. Market size and forecast, by Product
- 7.4.5.5.2. Market size and forecast, by Application
- 7.4.5.5.3. Market size and forecast, by Distribution Channel
- 7.4.5.6. Rest of Asia-Pacific
- 7.4.5.6.1. Market size and forecast, by Product
- 7.4.5.6.2. Market size and forecast, by Application
- 7.4.5.6.3. Market size and forecast, by Distribution Channel
- 7.5. Latin America
- 7.5.1. Key market trends, growth factors and opportunities
- 7.5.2. Market size and forecast, by Product
- 7.5.3. Market size and forecast, by Application
- 7.5.4. Market size and forecast, by Distribution Channel
- 7.5.5. Market size and forecast, by country
- 7.5.5.1. Brazil
- 7.5.5.1.1. Market size and forecast, by Product
- 7.5.5.1.2. Market size and forecast, by Application
- 7.5.5.1.3. Market size and forecast, by Distribution Channel
- 7.5.5.2. Colombia
- 7.5.5.2.1. Market size and forecast, by Product
- 7.5.5.2.2. Market size and forecast, by Application
- 7.5.5.2.3. Market size and forecast, by Distribution Channel
- 7.5.5.3. Argentina
- 7.5.5.3.1. Market size and forecast, by Product
- 7.5.5.3.2. Market size and forecast, by Application
- 7.5.5.3.3. Market size and forecast, by Distribution Channel
- 7.5.5.4. Rest of Latin America
- 7.5.5.4.1. Market size and forecast, by Product
- 7.5.5.4.2. Market size and forecast, by Application
- 7.5.5.4.3. Market size and forecast, by Distribution Channel
- 7.6. Middle East and Africa
- 7.6.1. Key market trends, growth factors and opportunities
- 7.6.2. Market size and forecast, by Product
- 7.6.3. Market size and forecast, by Application
- 7.6.4. Market size and forecast, by Distribution Channel
- 7.6.5. Market size and forecast, by country
- 7.6.5.1. Gcc
- 7.6.5.1.1. Market size and forecast, by Product
- 7.6.5.1.2. Market size and forecast, by Application
- 7.6.5.1.3. Market size and forecast, by Distribution Channel
- 7.6.5.2. South Africa
- 7.6.5.2.1. Market size and forecast, by Product
- 7.6.5.2.2. Market size and forecast, by Application
- 7.6.5.2.3. Market size and forecast, by Distribution Channel
- 7.6.5.3. North Africa
- 7.6.5.3.1. Market size and forecast, by Product
- 7.6.5.3.2. Market size and forecast, by Application
- 7.6.5.3.3. Market size and forecast, by Distribution Channel
- 7.6.5.4. Rest Of Mea
- 7.6.5.4.1. Market size and forecast, by Product
- 7.6.5.4.2. Market size and forecast, by Application
- 7.6.5.4.3. Market size and forecast, by Distribution Channel
CHAPTER 8: COMPETITIVE LANDSCAPE
- 8.1. Introduction
- 8.2. Top winning strategies
- 8.3. Product mapping of top 10 player
- 8.4. Competitive dashboard
- 8.5. Competitive heatmap
- 8.6. Top player positioning, 2022
CHAPTER 9: COMPANY PROFILES
- 9.1. Cardinal Health Inc.
- 9.1.1. Company overview
- 9.1.2. Key executives
- 9.1.3. Company snapshot
- 9.1.4. Operating business segments
- 9.1.5. Product portfolio
- 9.1.6. Business performance
- 9.2. Sanofi
- 9.2.1. Company overview
- 9.2.2. Key executives
- 9.2.3. Company snapshot
- 9.2.4. Operating business segments
- 9.2.5. Product portfolio
- 9.2.6. Business performance
- 9.3. Medline Industries, LP
- 9.3.1. Company overview
- 9.3.2. Key executives
- 9.3.3. Company snapshot
- 9.3.4. Operating business segments
- 9.3.5. Product portfolio
- 9.4. Beiersdorf AG
- 9.4.1. Company overview
- 9.4.2. Key executives
- 9.4.3. Company snapshot
- 9.4.4. Operating business segments
- 9.4.5. Product portfolio
- 9.4.6. Business performance
- 9.5. ThermoTek Inc
- 9.5.1. Company overview
- 9.5.2. Key executives
- 9.5.3. Company snapshot
- 9.5.4. Operating business segments
- 9.5.5. Product portfolio
- 9.6. 3M Company
- 9.6.1. Company overview
- 9.6.2. Key executives
- 9.6.3. Company snapshot
- 9.6.4. Operating business segments
- 9.6.5. Product portfolio
- 9.6.6. Business performance
- 9.7. Hisamitsu Pharmaceutical Co.,Inc.
- 9.7.1. Company overview
- 9.7.2. Key executives
- 9.7.3. Company snapshot
- 9.7.4. Operating business segments
- 9.7.5. Product portfolio
- 9.7.6. Business performance
- 9.7.7. Key strategic moves and developments
- 9.8. Bruder Healthcare Company LLC
- 9.8.1. Company overview
- 9.8.2. Key executives
- 9.8.3. Company snapshot
- 9.8.4. Operating business segments
- 9.8.5. Product portfolio
- 9.9. Ossur
- 9.9.1. Company overview
- 9.9.2. Key executives
- 9.9.3. Company snapshot
- 9.9.4. Operating business segments
- 9.9.5. Product portfolio
- 9.9.6. Business performance
- 9.10. Romsons Group of Industries Pvt. Ltd.
- 9.10.1. Company overview
- 9.10.2. Key executives
- 9.10.3. Company snapshot
- 9.10.4. Operating business segments
- 9.10.5. Product portfolio
LIST OF TABLES
- TABLE 01. GLOBAL COLD PAIN THERAPY MARKET, BY PRODUCT, 2022-2032 ($MILLION)
- TABLE 02. COLD PAIN THERAPY MARKET FOR OTC PRODUCTS, BY REGION, 2022-2032 ($MILLION)
- TABLE 03. GLOBAL OTC PRODUCTS COLD PAIN THERAPY MARKET, BY TYPE, 2022-2032 ($MILLION)
- TABLE 04. COLD PAIN THERAPY MARKET FOR PRESCRIPTION PRODUCTS, BY REGION, 2022-2032 ($MILLION)
- TABLE 05. GLOBAL PRESCRIPTION PRODUCTS COLD PAIN THERAPY MARKET, BY TYPE, 2022-2032 ($MILLION)
- TABLE 06. GLOBAL COLD PAIN THERAPY MARKET, BY APPLICATION, 2022-2032 ($MILLION)
- TABLE 07. COLD PAIN THERAPY MARKET FOR MUSCULOSKELETAL DISORDERS, BY REGION, 2022-2032 ($MILLION)
- TABLE 08. COLD PAIN THERAPY MARKET FOR POST-OPERATIVE THERAPY, BY REGION, 2022-2032 ($MILLION)
- TABLE 09. COLD PAIN THERAPY MARKET FOR SPORTS INJURIES, BY REGION, 2022-2032 ($MILLION)
- TABLE 10. COLD PAIN THERAPY MARKET FOR POST-TRAUMA THERAPY, BY REGION, 2022-2032 ($MILLION)
- TABLE 11. GLOBAL COLD PAIN THERAPY MARKET, BY DISTRIBUTION CHANNEL, 2022-2032 ($MILLION)
- TABLE 12. COLD PAIN THERAPY MARKET FOR HOSPITALS PHARMACIES, BY REGION, 2022-2032 ($MILLION)
- TABLE 13. COLD PAIN THERAPY MARKET FOR RETAIL PHARMACIES, BY REGION, 2022-2032 ($MILLION)
- TABLE 14. COLD PAIN THERAPY MARKET FOR ONLINE PHARMACIES, BY REGION, 2022-2032 ($MILLION)
- TABLE 15. COLD PAIN THERAPY MARKET, BY REGION, 2022-2032 ($MILLION)
- TABLE 16. NORTH AMERICA COLD PAIN THERAPY MARKET, BY PRODUCT, 2022-2032 ($MILLION)
- TABLE 17. NORTH AMERICA COLD PAIN THERAPY MARKET, BY APPLICATION, 2022-2032 ($MILLION)
- TABLE 18. NORTH AMERICA COLD PAIN THERAPY MARKET, BY DISTRIBUTION CHANNEL, 2022-2032 ($MILLION)
- TABLE 19. NORTH AMERICA COLD PAIN THERAPY MARKET, BY COUNTRY, 2022-2032 ($MILLION)
- TABLE 20. U.S. COLD PAIN THERAPY MARKET, BY PRODUCT, 2022-2032 ($MILLION)
- TABLE 21. U.S. COLD PAIN THERAPY MARKET, BY APPLICATION, 2022-2032 ($MILLION)
- TABLE 22. U.S. COLD PAIN THERAPY MARKET, BY DISTRIBUTION CHANNEL, 2022-2032 ($MILLION)
- TABLE 23. CANADA COLD PAIN THERAPY MARKET, BY PRODUCT, 2022-2032 ($MILLION)
- TABLE 24. CANADA COLD PAIN THERAPY MARKET, BY APPLICATION, 2022-2032 ($MILLION)
- TABLE 25. CANADA COLD PAIN THERAPY MARKET, BY DISTRIBUTION CHANNEL, 2022-2032 ($MILLION)
- TABLE 26. MEXICO COLD PAIN THERAPY MARKET, BY PRODUCT, 2022-2032 ($MILLION)
- TABLE 27. MEXICO COLD PAIN THERAPY MARKET, BY APPLICATION, 2022-2032 ($MILLION)
- TABLE 28. MEXICO COLD PAIN THERAPY MARKET, BY DISTRIBUTION CHANNEL, 2022-2032 ($MILLION)
- TABLE 29. EUROPE COLD PAIN THERAPY MARKET, BY PRODUCT, 2022-2032 ($MILLION)
- TABLE 30. EUROPE COLD PAIN THERAPY MARKET, BY APPLICATION, 2022-2032 ($MILLION)
- TABLE 31. EUROPE COLD PAIN THERAPY MARKET, BY DISTRIBUTION CHANNEL, 2022-2032 ($MILLION)
- TABLE 32. EUROPE COLD PAIN THERAPY MARKET, BY COUNTRY, 2022-2032 ($MILLION)
- TABLE 33. GERMANY COLD PAIN THERAPY MARKET, BY PRODUCT, 2022-2032 ($MILLION)
- TABLE 34. GERMANY COLD PAIN THERAPY MARKET, BY APPLICATION, 2022-2032 ($MILLION)
- TABLE 35. GERMANY COLD PAIN THERAPY MARKET, BY DISTRIBUTION CHANNEL, 2022-2032 ($MILLION)
- TABLE 36. FRANCE COLD PAIN THERAPY MARKET, BY PRODUCT, 2022-2032 ($MILLION)
- TABLE 37. FRANCE COLD PAIN THERAPY MARKET, BY APPLICATION, 2022-2032 ($MILLION)
- TABLE 38. FRANCE COLD PAIN THERAPY MARKET, BY DISTRIBUTION CHANNEL, 2022-2032 ($MILLION)
- TABLE 39. UK COLD PAIN THERAPY MARKET, BY PRODUCT, 2022-2032 ($MILLION)
- TABLE 40. UK COLD PAIN THERAPY MARKET, BY APPLICATION, 2022-2032 ($MILLION)
- TABLE 41. UK COLD PAIN THERAPY MARKET, BY DISTRIBUTION CHANNEL, 2022-2032 ($MILLION)
- TABLE 42. ITALY COLD PAIN THERAPY MARKET, BY PRODUCT, 2022-2032 ($MILLION)
- TABLE 43. ITALY COLD PAIN THERAPY MARKET, BY APPLICATION, 2022-2032 ($MILLION)
- TABLE 44. ITALY COLD PAIN THERAPY MARKET, BY DISTRIBUTION CHANNEL, 2022-2032 ($MILLION)
- TABLE 45. SPAIN COLD PAIN THERAPY MARKET, BY PRODUCT, 2022-2032 ($MILLION)
- TABLE 46. SPAIN COLD PAIN THERAPY MARKET, BY APPLICATION, 2022-2032 ($MILLION)
- TABLE 47. SPAIN COLD PAIN THERAPY MARKET, BY DISTRIBUTION CHANNEL, 2022-2032 ($MILLION)
- TABLE 48. REST OF EUROPE COLD PAIN THERAPY MARKET, BY PRODUCT, 2022-2032 ($MILLION)
- TABLE 49. REST OF EUROPE COLD PAIN THERAPY MARKET, BY APPLICATION, 2022-2032 ($MILLION)
- TABLE 50. REST OF EUROPE COLD PAIN THERAPY MARKET, BY DISTRIBUTION CHANNEL, 2022-2032 ($MILLION)
- TABLE 51. ASIA-PACIFIC COLD PAIN THERAPY MARKET, BY PRODUCT, 2022-2032 ($MILLION)
- TABLE 52. ASIA-PACIFIC COLD PAIN THERAPY MARKET, BY APPLICATION, 2022-2032 ($MILLION)
- TABLE 53. ASIA-PACIFIC COLD PAIN THERAPY MARKET, BY DISTRIBUTION CHANNEL, 2022-2032 ($MILLION)
- TABLE 54. ASIA-PACIFIC COLD PAIN THERAPY MARKET, BY COUNTRY, 2022-2032 ($MILLION)
- TABLE 55. JAPAN COLD PAIN THERAPY MARKET, BY PRODUCT, 2022-2032 ($MILLION)
- TABLE 56. JAPAN COLD PAIN THERAPY MARKET, BY APPLICATION, 2022-2032 ($MILLION)
- TABLE 57. JAPAN COLD PAIN THERAPY MARKET, BY DISTRIBUTION CHANNEL, 2022-2032 ($MILLION)
- TABLE 58. CHINA COLD PAIN THERAPY MARKET, BY PRODUCT, 2022-2032 ($MILLION)
- TABLE 59. CHINA COLD PAIN THERAPY MARKET, BY APPLICATION, 2022-2032 ($MILLION)
- TABLE 60. CHINA COLD PAIN THERAPY MARKET, BY DISTRIBUTION CHANNEL, 2022-2032 ($MILLION)
- TABLE 61. INDIA COLD PAIN THERAPY MARKET, BY PRODUCT, 2022-2032 ($MILLION)
- TABLE 62. INDIA COLD PAIN THERAPY MARKET, BY APPLICATION, 2022-2032 ($MILLION)
- TABLE 63. INDIA COLD PAIN THERAPY MARKET, BY DISTRIBUTION CHANNEL, 2022-2032 ($MILLION)
- TABLE 64. AUSTRALIA COLD PAIN THERAPY MARKET, BY PRODUCT, 2022-2032 ($MILLION)
- TABLE 65. AUSTRALIA COLD PAIN THERAPY MARKET, BY APPLICATION, 2022-2032 ($MILLION)
- TABLE 66. AUSTRALIA COLD PAIN THERAPY MARKET, BY DISTRIBUTION CHANNEL, 2022-2032 ($MILLION)
- TABLE 67. SOUTH KOREA COLD PAIN THERAPY MARKET, BY PRODUCT, 2022-2032 ($MILLION)
- TABLE 68. SOUTH KOREA COLD PAIN THERAPY MARKET, BY APPLICATION, 2022-2032 ($MILLION)
- TABLE 69. SOUTH KOREA COLD PAIN THERAPY MARKET, BY DISTRIBUTION CHANNEL, 2022-2032 ($MILLION)
- TABLE 70. REST OF ASIA-PACIFIC COLD PAIN THERAPY MARKET, BY PRODUCT, 2022-2032 ($MILLION)
- TABLE 71. REST OF ASIA-PACIFIC COLD PAIN THERAPY MARKET, BY APPLICATION, 2022-2032 ($MILLION)
- TABLE 72. REST OF ASIA-PACIFIC COLD PAIN THERAPY MARKET, BY DISTRIBUTION CHANNEL, 2022-2032 ($MILLION)
- TABLE 73. LATIN AMERICA COLD PAIN THERAPY MARKET, BY PRODUCT, 2022-2032 ($MILLION)
- TABLE 74. LATIN AMERICA COLD PAIN THERAPY MARKET, BY APPLICATION, 2022-2032 ($MILLION)
- TABLE 75. LATIN AMERICA COLD PAIN THERAPY MARKET, BY DISTRIBUTION CHANNEL, 2022-2032 ($MILLION)
- TABLE 76. LATIN AMERICA COLD PAIN THERAPY MARKET, BY COUNTRY, 2022-2032 ($MILLION)
- TABLE 77. BRAZIL COLD PAIN THERAPY MARKET, BY PRODUCT, 2022-2032 ($MILLION)
- TABLE 78. BRAZIL COLD PAIN THERAPY MARKET, BY APPLICATION, 2022-2032 ($MILLION)
- TABLE 79. BRAZIL COLD PAIN THERAPY MARKET, BY DISTRIBUTION CHANNEL, 2022-2032 ($MILLION)
- TABLE 80. COLOMBIA COLD PAIN THERAPY MARKET, BY PRODUCT, 2022-2032 ($MILLION)
- TABLE 81. COLOMBIA COLD PAIN THERAPY MARKET, BY APPLICATION, 2022-2032 ($MILLION)
- TABLE 82. COLOMBIA COLD PAIN THERAPY MARKET, BY DISTRIBUTION CHANNEL, 2022-2032 ($MILLION)
- TABLE 83. ARGENTINA COLD PAIN THERAPY MARKET, BY PRODUCT, 2022-2032 ($MILLION)
- TABLE 84. ARGENTINA COLD PAIN THERAPY MARKET, BY APPLICATION, 2022-2032 ($MILLION)
- TABLE 85. ARGENTINA COLD PAIN THERAPY MARKET, BY DISTRIBUTION CHANNEL, 2022-2032 ($MILLION)
- TABLE 86. REST OF LATIN AMERICA COLD PAIN THERAPY MARKET, BY PRODUCT, 2022-2032 ($MILLION)
- TABLE 87. REST OF LATIN AMERICA COLD PAIN THERAPY MARKET, BY APPLICATION, 2022-2032 ($MILLION)
- TABLE 88. REST OF LATIN AMERICA COLD PAIN THERAPY MARKET, BY DISTRIBUTION CHANNEL, 2022-2032 ($MILLION)
- TABLE 89. MIDDLE EAST AND AFRICA COLD PAIN THERAPY MARKET, BY PRODUCT, 2022-2032 ($MILLION)
- TABLE 90. MIDDLE EAST AND AFRICA COLD PAIN THERAPY MARKET, BY APPLICATION, 2022-2032 ($MILLION)
- TABLE 91. MIDDLE EAST AND AFRICA COLD PAIN THERAPY MARKET, BY DISTRIBUTION CHANNEL, 2022-2032 ($MILLION)
- TABLE 92. MIDDLE EAST AND AFRICA COLD PAIN THERAPY MARKET, BY COUNTRY, 2022-2032 ($MILLION)
- TABLE 93. GCC COLD PAIN THERAPY MARKET, BY PRODUCT, 2022-2032 ($MILLION)
- TABLE 94. GCC COLD PAIN THERAPY MARKET, BY APPLICATION, 2022-2032 ($MILLION)
- TABLE 95. GCC COLD PAIN THERAPY MARKET, BY DISTRIBUTION CHANNEL, 2022-2032 ($MILLION)
- TABLE 96. SOUTH AFRICA COLD PAIN THERAPY MARKET, BY PRODUCT, 2022-2032 ($MILLION)
- TABLE 97. SOUTH AFRICA COLD PAIN THERAPY MARKET, BY APPLICATION, 2022-2032 ($MILLION)
- TABLE 98. SOUTH AFRICA COLD PAIN THERAPY MARKET, BY DISTRIBUTION CHANNEL, 2022-2032 ($MILLION)
- TABLE 99. NORTH AFRICA COLD PAIN THERAPY MARKET, BY PRODUCT, 2022-2032 ($MILLION)
- TABLE 100. NORTH AFRICA COLD PAIN THERAPY MARKET, BY APPLICATION, 2022-2032 ($MILLION)
- TABLE 101. NORTH AFRICA COLD PAIN THERAPY MARKET, BY DISTRIBUTION CHANNEL, 2022-2032 ($MILLION)
- TABLE 102. REST OF MEA COLD PAIN THERAPY MARKET, BY PRODUCT, 2022-2032 ($MILLION)
- TABLE 103. REST OF MEA COLD PAIN THERAPY MARKET, BY APPLICATION, 2022-2032 ($MILLION)
- TABLE 104. REST OF MEA COLD PAIN THERAPY MARKET, BY DISTRIBUTION CHANNEL, 2022-2032 ($MILLION)
- TABLE 105. CARDINAL HEALTH INC.: KEY EXECUTIVES
- TABLE 106. CARDINAL HEALTH INC.: COMPANY SNAPSHOT
- TABLE 107. CARDINAL HEALTH INC.: PRODUCT SEGMENTS
- TABLE 108. CARDINAL HEALTH INC.: PRODUCT PORTFOLIO
- TABLE 109. SANOFI: KEY EXECUTIVES
- TABLE 110. SANOFI: COMPANY SNAPSHOT
- TABLE 111. SANOFI: PRODUCT SEGMENTS
- TABLE 112. SANOFI: PRODUCT PORTFOLIO
- TABLE 113. MEDLINE INDUSTRIES, LP: KEY EXECUTIVES
- TABLE 114. MEDLINE INDUSTRIES, LP: COMPANY SNAPSHOT
- TABLE 115. MEDLINE INDUSTRIES, LP: PRODUCT SEGMENTS
- TABLE 116. MEDLINE INDUSTRIES, LP: PRODUCT PORTFOLIO
- TABLE 117. BEIERSDORF AG: KEY EXECUTIVES
- TABLE 118. BEIERSDORF AG: COMPANY SNAPSHOT
- TABLE 119. BEIERSDORF AG: PRODUCT SEGMENTS
- TABLE 120. BEIERSDORF AG: PRODUCT PORTFOLIO
- TABLE 121. THERMOTEK INC: KEY EXECUTIVES
- TABLE 122. THERMOTEK INC: COMPANY SNAPSHOT
- TABLE 123. THERMOTEK INC: PRODUCT SEGMENTS
- TABLE 124. THERMOTEK INC: PRODUCT PORTFOLIO
- TABLE 125. 3M COMPANY: KEY EXECUTIVES
- TABLE 126. 3M COMPANY: COMPANY SNAPSHOT
- TABLE 127. 3M COMPANY: PRODUCT SEGMENTS
- TABLE 128. 3M COMPANY: PRODUCT PORTFOLIO
- TABLE 129. HISAMITSU PHARMACEUTICAL CO.,INC.: KEY EXECUTIVES
- TABLE 130. HISAMITSU PHARMACEUTICAL CO.,INC.: COMPANY SNAPSHOT
- TABLE 131. HISAMITSU PHARMACEUTICAL CO.,INC.: PRODUCT SEGMENTS
- TABLE 132. HISAMITSU PHARMACEUTICAL CO.,INC.: PRODUCT PORTFOLIO
- TABLE 133. HISAMITSU PHARMACEUTICAL CO.,INC.: KEY STRATERGIES
- TABLE 134. BRUDER HEALTHCARE COMPANY LLC: KEY EXECUTIVES
- TABLE 135. BRUDER HEALTHCARE COMPANY LLC: COMPANY SNAPSHOT
- TABLE 136. BRUDER HEALTHCARE COMPANY LLC: PRODUCT SEGMENTS
- TABLE 137. BRUDER HEALTHCARE COMPANY LLC: PRODUCT PORTFOLIO
- TABLE 138. OSSUR: KEY EXECUTIVES
- TABLE 139. OSSUR: COMPANY SNAPSHOT
- TABLE 140. OSSUR: PRODUCT SEGMENTS
- TABLE 141. OSSUR: PRODUCT PORTFOLIO
- TABLE 142. ROMSONS GROUP OF INDUSTRIES PVT. LTD.: KEY EXECUTIVES
- TABLE 143. ROMSONS GROUP OF INDUSTRIES PVT. LTD.: COMPANY SNAPSHOT
- TABLE 144. ROMSONS GROUP OF INDUSTRIES PVT. LTD.: PRODUCT SEGMENTS
- TABLE 145. ROMSONS GROUP OF INDUSTRIES PVT. LTD.: PRODUCT PORTFOLIO
LIST OF FIGURES
- FIGURE 01. COLD PAIN THERAPY MARKET, 2022-2032
- FIGURE 02. SEGMENTATION OF COLD PAIN THERAPY MARKET,2022-2032
- FIGURE 03. TOP IMPACTING FACTORS IN COLD PAIN THERAPY MARKET (2022 TO 2032)
- FIGURE 04. TOP INVESTMENT POCKETS IN COLD PAIN THERAPY MARKET (2023-2032)
- FIGURE 05. LOW BARGAINING POWER OF SUPPLIERS
- FIGURE 06. LOW THREAT OF NEW ENTRANTS
- FIGURE 07. LOW THREAT OF SUBSTITUTES
- FIGURE 08. LOW INTENSITY OF RIVALRY
- FIGURE 09. LOW BARGAINING POWER OF BUYERS
- FIGURE 10. GLOBAL COLD PAIN THERAPY MARKET:DRIVERS, RESTRAINTS AND OPPORTUNITIES
- FIGURE 11. COLD PAIN THERAPY MARKET, BY PRODUCT, 2022 AND 2032(%)
- FIGURE 12. COMPARATIVE SHARE ANALYSIS OF COLD PAIN THERAPY MARKET FOR OTC PRODUCTS, BY COUNTRY 2022 AND 2032(%)
- FIGURE 13. COMPARATIVE SHARE ANALYSIS OF COLD PAIN THERAPY MARKET FOR PRESCRIPTION PRODUCTS, BY COUNTRY 2022 AND 2032(%)
- FIGURE 14. COLD PAIN THERAPY MARKET, BY APPLICATION, 2022 AND 2032(%)
- FIGURE 15. COMPARATIVE SHARE ANALYSIS OF COLD PAIN THERAPY MARKET FOR MUSCULOSKELETAL DISORDERS, BY COUNTRY 2022 AND 2032(%)
- FIGURE 16. COMPARATIVE SHARE ANALYSIS OF COLD PAIN THERAPY MARKET FOR POST-OPERATIVE THERAPY, BY COUNTRY 2022 AND 2032(%)
- FIGURE 17. COMPARATIVE SHARE ANALYSIS OF COLD PAIN THERAPY MARKET FOR SPORTS INJURIES, BY COUNTRY 2022 AND 2032(%)
- FIGURE 18. COMPARATIVE SHARE ANALYSIS OF COLD PAIN THERAPY MARKET FOR POST-TRAUMA THERAPY, BY COUNTRY 2022 AND 2032(%)
- FIGURE 19. COLD PAIN THERAPY MARKET, BY DISTRIBUTION CHANNEL, 2022 AND 2032(%)
- FIGURE 20. COMPARATIVE SHARE ANALYSIS OF COLD PAIN THERAPY MARKET FOR HOSPITALS PHARMACIES, BY COUNTRY 2022 AND 2032(%)
- FIGURE 21. COMPARATIVE SHARE ANALYSIS OF COLD PAIN THERAPY MARKET FOR RETAIL PHARMACIES, BY COUNTRY 2022 AND 2032(%)
- FIGURE 22. COMPARATIVE SHARE ANALYSIS OF COLD PAIN THERAPY MARKET FOR ONLINE PHARMACIES, BY COUNTRY 2022 AND 2032(%)
- FIGURE 23. COLD PAIN THERAPY MARKET BY REGION, 2022 AND 2032(%)
- FIGURE 24. U.S. COLD PAIN THERAPY MARKET, 2022-2032 ($MILLION)
- FIGURE 25. CANADA COLD PAIN THERAPY MARKET, 2022-2032 ($MILLION)
- FIGURE 26. MEXICO COLD PAIN THERAPY MARKET, 2022-2032 ($MILLION)
- FIGURE 27. GERMANY COLD PAIN THERAPY MARKET, 2022-2032 ($MILLION)
- FIGURE 28. FRANCE COLD PAIN THERAPY MARKET, 2022-2032 ($MILLION)
- FIGURE 29. UK COLD PAIN THERAPY MARKET, 2022-2032 ($MILLION)
- FIGURE 30. ITALY COLD PAIN THERAPY MARKET, 2022-2032 ($MILLION)
- FIGURE 31. SPAIN COLD PAIN THERAPY MARKET, 2022-2032 ($MILLION)
- FIGURE 32. REST OF EUROPE COLD PAIN THERAPY MARKET, 2022-2032 ($MILLION)
- FIGURE 33. JAPAN COLD PAIN THERAPY MARKET, 2022-2032 ($MILLION)
- FIGURE 34. CHINA COLD PAIN THERAPY MARKET, 2022-2032 ($MILLION)
- FIGURE 35. INDIA COLD PAIN THERAPY MARKET, 2022-2032 ($MILLION)
- FIGURE 36. AUSTRALIA COLD PAIN THERAPY MARKET, 2022-2032 ($MILLION)
- FIGURE 37. SOUTH KOREA COLD PAIN THERAPY MARKET, 2022-2032 ($MILLION)
- FIGURE 38. REST OF ASIA-PACIFIC COLD PAIN THERAPY MARKET, 2022-2032 ($MILLION)
- FIGURE 39. BRAZIL COLD PAIN THERAPY MARKET, 2022-2032 ($MILLION)
- FIGURE 40. COLOMBIA COLD PAIN THERAPY MARKET, 2022-2032 ($MILLION)
- FIGURE 41. ARGENTINA COLD PAIN THERAPY MARKET, 2022-2032 ($MILLION)
- FIGURE 42. REST OF LATIN AMERICA COLD PAIN THERAPY MARKET, 2022-2032 ($MILLION)
- FIGURE 43. GCC COLD PAIN THERAPY MARKET, 2022-2032 ($MILLION)
- FIGURE 44. SOUTH AFRICA COLD PAIN THERAPY MARKET, 2022-2032 ($MILLION)
- FIGURE 45. NORTH AFRICA COLD PAIN THERAPY MARKET, 2022-2032 ($MILLION)
- FIGURE 46. REST OF MEA COLD PAIN THERAPY MARKET, 2022-2032 ($MILLION)
- FIGURE 47. TOP WINNING STRATEGIES, BY YEAR (2021)
- FIGURE 48. TOP WINNING STRATEGIES, BY DEVELOPMENT (2021)
- FIGURE 49. TOP WINNING STRATEGIES, BY COMPANY (2021)
- FIGURE 50. PRODUCT MAPPING OF TOP 10 PLAYERS
- FIGURE 51. COMPETITIVE DASHBOARD
- FIGURE 52. COMPETITIVE HEATMAP: COLD PAIN THERAPY MARKET
- FIGURE 53. TOP PLAYER POSITIONING, 2022
- FIGURE 54. CARDINAL HEALTH INC.: NET REVENUE, 2020-2022 ($MILLION)
- FIGURE 55. CARDINAL HEALTH INC.: REVENUE SHARE BY SEGMENT, 2022 (%)
- FIGURE 56. CARDINAL HEALTH INC.: REVENUE SHARE BY REGION, 2022 (%)
- FIGURE 57. SANOFI: NET REVENUE, 2020-2022 ($MILLION)
- FIGURE 58. SANOFI: REVENUE SHARE BY SEGMENT, 2022 (%)
- FIGURE 59. SANOFI: REVENUE SHARE BY REGION, 2022 (%)
- FIGURE 60. BEIERSDORF AG: NET SALES, 2020-2022 ($MILLION)
- FIGURE 61. BEIERSDORF AG: REVENUE SHARE BY SEGMENT, 2022 (%)
- FIGURE 62. BEIERSDORF AG: REVENUE SHARE BY REGION, 2022 (%)
- FIGURE 63. 3M COMPANY: NET REVENUE, 2020-2022 ($MILLION)
- FIGURE 64. 3M COMPANY: REVENUE SHARE BY SEGMENT, 2022 (%)
- FIGURE 65. 3M COMPANY: REVENUE SHARE BY REGION, 2022 (%)
- FIGURE 66. HISAMITSU PHARMACEUTICAL CO.,INC.: NET SALES, 2020-2022 ($MILLION)
- FIGURE 67. OSSUR: NET SALES, 2020-2022 ($MILLION)
- FIGURE 68. OSSUR: REVENUE SHARE BY SEGMENT, 2022 (%)
- FIGURE 69. OSSUR: REVENUE SHARE BY REGION, 2022 (%)
 全球冷痛治疗市场研究报告-产业分析、规模、份额、成长、趋势和预测 2025 年至 2033 年
 冷痛疗法市场规模、份额、趋势分析报告:按产品、按应用、按分销管道、按地区、细分市场预测,2025-2030
 冷痛治疗市场:按产品、通路、应用 - 全球预测 2025-2030冷冻治疗市场:按产品、应用、治疗类型、分销管道和地区,2024-2031 年
 冷痛治疗市场 - 全球产业规模、份额、趋势、机会和预测,按产品、应用、配销通路、地区和竞争细分,2019-2029F
 全球冷痛治疗市场:依产品、治疗类型、应用、通路、地区、机会、预测,2017-2031
 南美洲和中美洲冷痛治疗市场预测至 2028 年 - 区域分析 - 按应用、产品和最终用户
 欧洲冷痛治疗市场预测至 2028 年 - 区域分析 - 按应用程式、产品和最终用户