


 |
市场调查报告书
商品编码
1447160
线性致动器市场:按执行机构、最终用途产业:2023-2032 年全球机会分析与产业预测Linear Actuator Market By Operation Mechanism (Electric, Pneumatic, Hydraulic, Others), By End Use Industry (Automotive, Construction, Energy and Mining, Healthcare, Others): Global Opportunity Analysis and Industry Forecast, 2023-2032 |
||||||
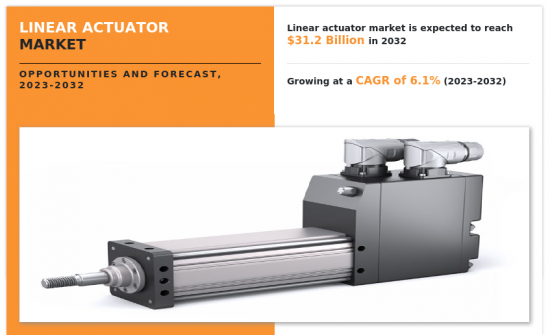
2022年,线性致动器市值为174.392亿美元,预计到2032年将达到311.9972亿美元,2023年至2032年的复合年增长率为6.05%。
线性致动器是一种设计用于产生直线运动的机械装置。将电力、液压、气压等能量转换成直线运动。这种类型的运动对于各种任务至关重要,例如推、拉、举起和精确定位物体。线性致动器因其对运动和定位的精确控製而广泛应用于众多行业,包括工业自动化、车辆製造、机器人和家用电子电器。线性致动器是需要受控线性位移的系统中的关键元件。
医疗保健产业的进步是线性致动器市场的重要驱动因素,这主要是由于线性致动器在医疗设备和装置中的使用不断增加。这些致动器对于在各种医疗应用中提供精确和受控的运动至关重要。例如,在核磁共振造影系统等先进成像设备中,线性致动器用于调整设备和患者的位置以获得最佳成像。这种准确性对于准确诊断至关重要。同样,在手术机器人中,致动器可以在手术过程中实现精确的运动,从而提高手术精度和患者治疗效果。随着医疗技术的进步以及医疗保健领域对精度和自动化的需求不断增加,对可靠、高效的线性致动器的需求不断增加,推动了该领域的市场成长。
然而,在恶劣环境下的可靠性问题对线性致动器市场产生重大影响。这些致动器对于各种行业的精密运动控制至关重要,并且经常面临高温、灰尘、潮湿和腐蚀性元素等极端条件。例如,在采矿业中,致动器暴露在强烈的灰尘和湿气中,导致频繁磨损。这需要定期维护和更换,从而增加营运成本和停机时间。在恶劣条件下保持稳定的性能和长寿命的这些挑战正在限制市场,并随着行业寻求更耐用和低维护的解决方案而推动市场成长,并产生影响。
此外,环保致动器解决方案的开拓为线性致动器市场带来了巨大的机会,特别是在业界越来越重视永续性下。例如,由可回收致动器製成或低功耗设计的致动器可以满足环境目标。在汽车产业中,这些环保线性致动器可用于电动车充电站,以在不影响性能的情况下实现高效、永续的运作。除了遵守更严格的环境法规外,致动器製造商还透过减少产品的环境足迹、开闢创新和市场成长的新途径来吸引以绿色技术为重点的市场。
线性致动器市场按运行机制、最终用途行业和地区进行细分。根据运行机制,市场分为电动线性致动器、气动线性致动器、液压线性致动器等。根据最终用途产业,线性致动器产业分为汽车、建筑、能源和采矿、医疗保健等。依地区划分,市场分为北美(美国、加拿大、墨西哥)、欧洲(英国、德国、法国、其他欧洲国家)、亚太地区(中国、日本、印度、韩国、亚太地区其他地区) 、拉丁美洲(Latin America)。、中东和非洲)。
相关人员的主要利益
- 本报告对 2022 年至 2032 年线性致动器市场分析的细分市场、当前趋势、估计/趋势分析和动态进行了定量分析,以确定线性致动器市场的强大机会。
- 我们提供市场研究以及与市场驱动因素、市场限制和市场机会相关的资讯。
- 波特的五力分析强调买家和供应商帮助相关人员做出利润驱动的商业决策并加强供应商-买家网路的力量。
- 对线性致动器市场细分的详细分析有助于识别市场机会。
- 每个地区的主要国家都根据其对全球市场的收益贡献绘製了地图。
- 市场参与者定位有助于基准化分析,并提供对市场参与者当前地位的清晰了解。
- 它包括对区域和全球线性致动器市场趋势、主要企业、细分市场、应用领域和市场成长策略的分析。
可使用此报告进行客製化(需要额外费用和时间表)
- 产品基准/产品规格及应用
- 产品生命週期
- 供应链分析与供应商利润
- 按地区分類的新参与企业
- 按产品/细分市场区隔
- 新产品开发/主要企业产品矩阵
- 根据客户兴趣新增其他公司简介
- 按国家或地区进行的附加分析 – 市场规模和预测
- 公司简介的扩充列表
- 历史市场资料
- 主要参与者的详细资料(Excel格式,包括位置、联络资讯、供应商/供应商网路等)
- 全球/区域/国家层级参与者的市场占有率分析
目录
第一章简介
第 2 章执行摘要
第三章市场概况
- 市场定义和范围
- 主要发现
- 影响因素
- 主要投资机会
- 波特五力分析
- 市场动态
- 促进因素
- 机器人技术的进步
- 製造自动化的进展
- 装置小型化
- 抑制因素
- 初期投资成本高
- 机会
- 物联网 (IoT) 集成
- 促进因素
第四章线性致动器市场:依执行机构分类
- 概述
- 电动
- 气动
- 油压
- 其他的
第五章线性致动器市场:依最终用途产业
- 概述
- 车
- 建造
- 能源/矿业
- 卫生保健
- 其他的
第六章线性致动器市场:依地区
- 概述
- 北美洲
- 美国
- 加拿大
- 墨西哥
- 欧洲
- 英国
- 德国
- 法国
- 其他的
- 亚太地区
- 中国
- 日本
- 印度
- 韩国
- 其他的
- 拉丁美洲
- 拉丁美洲
- 中东
- 非洲
第七章 竞争形势
- 介绍
- 关键成功策略
- 10家主要企业产品图谱
- 竞争对手仪表板
- 竞争热图
- 2022年主要企业定位
第八章 公司简介
- Bosch Rexroth AG
- Emerson Electric Co.
- HepcoMotion Ltd.
- Kollmorgen Corporation
- LINAK
- Oriental Motor Co., Ltd.
- Parker Hannifin Corporation
- Rockwell Automation Inc.
- Thomson Industries, Inc.
- Tolomatic, Inc.
The linear actuator market was valued at $17,439.2 million in 2022, and is projected to reach $31,199.72 million by 2032, registering a CAGR of 6.05% from 2023 to 2032.
A linear actuator is a mechanical device designed to create motion in a straight line. It converts energy, typically electrical, hydraulic, or pneumatic, into linear motion. This type of movement is essential for a variety of tasks, including pushing, pulling, lifting, and accurately positioning items. Linear actuators are extensively utilized across numerous industries such as industrial automation, vehicle manufacturing, robotics, and consumer electronic devices, owing to their precision in controlling motion and placement. They are key components in systems where controlled linear displacement is necessary.
The advancement of the healthcare industry is a significant driver for the linear actuator market, largely due to the rise in use of linear actuators in medical equipment and devices. These actuators are essential for providing precise and controlled movement in various medical applications. For instance, in advanced imaging equipment such as MRI machines, linear actuators are used to adjust the position of the machine or the patient for optimal imaging. This precision is crucial for accurate diagnostics. Similarly, in surgical robotics, actuators allow for meticulous movements during operations, enhancing surgical precision and patient outcomes. The need for reliable and efficient linear actuators grows with the advancement of medical technology and the increase in demand for precision and automation in healthcare, thereby boosting the market growth in this sector.
However, reliability issues in harsh environments significantly impact the linear actuator market. These actuators, crucial for precise motion control in various industries, often face extreme conditions such as high temperatures, dust, moisture, and corrosive elements. For instance, in the mining industry, actuators are exposed to severe dust and moisture, leading to frequent wear and tear. This necessitates regular maintenance and replacements, increasing operational costs and downtime. Such challenges in maintaining consistent performance and longevity under harsh conditions act as a restraint, affecting market growth as industries seek more durable and less maintenance-intensive solutions.
Moreover, developing eco-friendly actuator solutions presents a significant opportunity in the linear actuator market, particularly as industries increasingly prioritize sustainability. For example, actuators made from recyclable materials or designed for low power consumption align with environmental goals. In the automotive industry, such ecofriendly linear actuators can be used in electric vehicle charging stations, offering efficient, sustainable operation without compromising performance. Actuator manufacturers not only adhere to stricter environmental regulations but also appeal to a market that values green technology, by reducing the environmental footprint of their products, thus opening new avenues for innovation and market growth.
The linear actuator market is segmented on the basis of operation mechanism, end use industry, and region. On the basis of operation mechanism, the market is divided into electric linear actuators, pneumatic linear actuators, hydraulic linear actuators, and others. On the basis of end use industry, the linear actuator industry is fragmented into automotive, construction, energy and mining, healthcare, and others. On the basis of region, the market is analyzed across North America (the U.S., Canada, and Mexico), Europe (the UK, Germany, France, and rest of Europe), Asia-Pacific (China, Japan, India, South Korea, and rest of Asia-Pacific) and LAMEA (Latin America, Middle East, and Africa).
The major companies profiled in the report include Bosch Rexroth AG, Emerson Electric Co., HepcoMotion Ltd., Kollmorgen Corporation, LINAK, Oriental Motor Co., Ltd., Parker Hannifin Corporation, Rockwell Automation, Thomson Industries, Inc., Tolomatic, Inc.
Key Benefits For Stakeholders
- This report provides a quantitative analysis of the market segments, current trends, estimations, and dynamics of the linear actuator market analysis from 2022 to 2032 to identify the prevailing linear actuator market opportunities.
- The market research is offered along with information related to key drivers, restraints, and opportunities.
- Porter's five forces analysis highlights the potency of buyers and suppliers to enable stakeholders make profit-oriented business decisions and strengthen their supplier-buyer network.
- In-depth analysis of the linear actuator market segmentation assists to determine the prevailing market opportunities.
- Major countries in each region are mapped according to their revenue contribution to the global market.
- Market player positioning facilitates benchmarking and provides a clear understanding of the present position of the market players.
- The report includes the analysis of the regional as well as global linear actuator market trends, key players, market segments, application areas, and market growth strategies.
Additional benefits you will get with this purchase are:
- Quarterly Update and* (only available with a corporate license, on listed price)
- 5 additional Company Profile of client Choice pre- or Post-purchase, as a free update.
- Free Upcoming Version on the Purchase of Five and Enterprise User License.
- 16 analyst hours of support* (post-purchase, if you find additional data requirements upon review of the report, you may receive support amounting to 16 analyst hours to solve questions, and post-sale queries)
- 15% Free Customization* (in case the scope or segment of the report does not match your requirements, 15% is equivalent to 3 working days of free work, applicable once)
- Free data Pack on the Five and Enterprise User License. (Excel version of the report)
- Free Updated report if the report is 6-12 months old or older.
- 24-hour priority response*
- Free Industry updates and white papers.
Possible Customization with this report (with additional cost and timeline, please talk to the sales executive to know more)
- Product Benchmarking / Product specification and applications
- Product Life Cycles
- Supply Chain Analysis & Vendor Margins
- Upcoming/New Entrant by Regions
- Market share analysis of players by products/segments
- New Product Development/ Product Matrix of Key Players
- Additional company profiles with specific to client's interest
- Additional country or region analysis- market size and forecast
- Expanded list for Company Profiles
- Historic market data
- Key player details (including location, contact details, supplier/vendor network etc. in excel format)
- Market share analysis of players at global/region/country level
Key Market Segments
By Operation Mechanism
- Pneumatic
- Hydraulic
- Others
- Electric
By End Use Industry
- Automotive
- Construction
- Energy and Mining
- Healthcare
- Others
By Region
- North America
- U.S.
- Canada
- Mexico
- Europe
- UK
- Germany
- France
- Rest of Europe
- Asia-Pacific
- China
- Japan
- India
- South Korea
- Rest of Asia-Pacific
- LAMEA
- Latin America
- Middle East
- Africa
Key Market Players:
- Bosch Rexroth AG
- LINAK
- Parker Hannifin Corporation
- Rockwell Automation Inc.
- Oriental Motor Co., Ltd.
- Thomson Industries, Inc.
- HepcoMotion Ltd.
- Kollmorgen Corporation
- Emerson Electric Co.
- Tolomatic, Inc.
TABLE OF CONTENTS
CHAPTER 1: INTRODUCTION
- 1.1. Report description
- 1.2. Key market segments
- 1.3. Key benefits to the stakeholders
- 1.4. Research methodology
- 1.4.1. Primary research
- 1.4.2. Secondary research
- 1.4.3. Analyst tools and models
CHAPTER 2: EXECUTIVE SUMMARY
- 2.1. CXO Perspective
CHAPTER 3: MARKET OVERVIEW
- 3.1. Market definition and scope
- 3.2. Key findings
- 3.2.1. Top impacting factors
- 3.2.2. Top investment pockets
- 3.3. Porter's five forces analysis
- 3.3.1. Moderate to high bargaining power of suppliers
- 3.3.2. Moderate threat of new entrants
- 3.3.3. Low to moderate threat of substitutes
- 3.3.4. High intensity of rivalry
- 3.3.5. Moderate bargaining power of buyers
- 3.4. Market dynamics
- 3.4.1. Drivers
- 3.4.1.1. Advancements in robotics
- 3.4.1.2. Increased automation in manufacturing
- 3.4.1.3. Miniaturization of devices
- 3.4.2. Restraints
- 3.4.2.1. High initial investment cost
- 3.4.3. Opportunities
- 3.4.3.1. Internet of Things (IoT) integration
- 3.4.1. Drivers
CHAPTER 4: LINEAR ACTUATOR MARKET, BY OPERATION MECHANISM
- 4.1. Overview
- 4.1.1. Market size and forecast
- 4.2. Electric
- 4.2.1. Key market trends, growth factors and opportunities
- 4.2.2. Market size and forecast, by region
- 4.2.3. Market share analysis by country
- 4.3. Pneumatic
- 4.3.1. Key market trends, growth factors and opportunities
- 4.3.2. Market size and forecast, by region
- 4.3.3. Market share analysis by country
- 4.4. Hydraulic
- 4.4.1. Key market trends, growth factors and opportunities
- 4.4.2. Market size and forecast, by region
- 4.4.3. Market share analysis by country
- 4.5. Others
- 4.5.1. Key market trends, growth factors and opportunities
- 4.5.2. Market size and forecast, by region
- 4.5.3. Market share analysis by country
CHAPTER 5: LINEAR ACTUATOR MARKET, BY END USE INDUSTRY
- 5.1. Overview
- 5.1.1. Market size and forecast
- 5.2. Automotive
- 5.2.1. Key market trends, growth factors and opportunities
- 5.2.2. Market size and forecast, by region
- 5.2.3. Market share analysis by country
- 5.3. Construction
- 5.3.1. Key market trends, growth factors and opportunities
- 5.3.2. Market size and forecast, by region
- 5.3.3. Market share analysis by country
- 5.4. Energy and Mining
- 5.4.1. Key market trends, growth factors and opportunities
- 5.4.2. Market size and forecast, by region
- 5.4.3. Market share analysis by country
- 5.5. Healthcare
- 5.5.1. Key market trends, growth factors and opportunities
- 5.5.2. Market size and forecast, by region
- 5.5.3. Market share analysis by country
- 5.6. Others
- 5.6.1. Key market trends, growth factors and opportunities
- 5.6.2. Market size and forecast, by region
- 5.6.3. Market share analysis by country
CHAPTER 6: LINEAR ACTUATOR MARKET, BY REGION
- 6.1. Overview
- 6.1.1. Market size and forecast By Region
- 6.2. North America
- 6.2.1. Key market trends, growth factors and opportunities
- 6.2.2. Market size and forecast, by Operation Mechanism
- 6.2.3. Market size and forecast, by End Use Industry
- 6.2.4. Market size and forecast, by country
- 6.2.4.1. U.S.
- 6.2.4.1.1. Market size and forecast, by Operation Mechanism
- 6.2.4.1.2. Market size and forecast, by End Use Industry
- 6.2.4.2. Canada
- 6.2.4.2.1. Market size and forecast, by Operation Mechanism
- 6.2.4.2.2. Market size and forecast, by End Use Industry
- 6.2.4.3. Mexico
- 6.2.4.3.1. Market size and forecast, by Operation Mechanism
- 6.2.4.3.2. Market size and forecast, by End Use Industry
- 6.3. Europe
- 6.3.1. Key market trends, growth factors and opportunities
- 6.3.2. Market size and forecast, by Operation Mechanism
- 6.3.3. Market size and forecast, by End Use Industry
- 6.3.4. Market size and forecast, by country
- 6.3.4.1. UK
- 6.3.4.1.1. Market size and forecast, by Operation Mechanism
- 6.3.4.1.2. Market size and forecast, by End Use Industry
- 6.3.4.2. Germany
- 6.3.4.2.1. Market size and forecast, by Operation Mechanism
- 6.3.4.2.2. Market size and forecast, by End Use Industry
- 6.3.4.3. France
- 6.3.4.3.1. Market size and forecast, by Operation Mechanism
- 6.3.4.3.2. Market size and forecast, by End Use Industry
- 6.3.4.4. Rest of Europe
- 6.3.4.4.1. Market size and forecast, by Operation Mechanism
- 6.3.4.4.2. Market size and forecast, by End Use Industry
- 6.4. Asia-Pacific
- 6.4.1. Key market trends, growth factors and opportunities
- 6.4.2. Market size and forecast, by Operation Mechanism
- 6.4.3. Market size and forecast, by End Use Industry
- 6.4.4. Market size and forecast, by country
- 6.4.4.1. China
- 6.4.4.1.1. Market size and forecast, by Operation Mechanism
- 6.4.4.1.2. Market size and forecast, by End Use Industry
- 6.4.4.2. Japan
- 6.4.4.2.1. Market size and forecast, by Operation Mechanism
- 6.4.4.2.2. Market size and forecast, by End Use Industry
- 6.4.4.3. India
- 6.4.4.3.1. Market size and forecast, by Operation Mechanism
- 6.4.4.3.2. Market size and forecast, by End Use Industry
- 6.4.4.4. South Korea
- 6.4.4.4.1. Market size and forecast, by Operation Mechanism
- 6.4.4.4.2. Market size and forecast, by End Use Industry
- 6.4.4.5. Rest of Asia-Pacific
- 6.4.4.5.1. Market size and forecast, by Operation Mechanism
- 6.4.4.5.2. Market size and forecast, by End Use Industry
- 6.5. LAMEA
- 6.5.1. Key market trends, growth factors and opportunities
- 6.5.2. Market size and forecast, by Operation Mechanism
- 6.5.3. Market size and forecast, by End Use Industry
- 6.5.4. Market size and forecast, by country
- 6.5.4.1. Latin America
- 6.5.4.1.1. Market size and forecast, by Operation Mechanism
- 6.5.4.1.2. Market size and forecast, by End Use Industry
- 6.5.4.2. Middle East
- 6.5.4.2.1. Market size and forecast, by Operation Mechanism
- 6.5.4.2.2. Market size and forecast, by End Use Industry
- 6.5.4.3. Africa
- 6.5.4.3.1. Market size and forecast, by Operation Mechanism
- 6.5.4.3.2. Market size and forecast, by End Use Industry
CHAPTER 7: COMPETITIVE LANDSCAPE
- 7.1. Introduction
- 7.2. Top winning strategies
- 7.3. Product mapping of top 10 player
- 7.4. Competitive dashboard
- 7.5. Competitive heatmap
- 7.6. Top player positioning, 2022
CHAPTER 8: COMPANY PROFILES
- 8.1. Bosch Rexroth AG
- 8.1.1. Company overview
- 8.1.2. Key executives
- 8.1.3. Company snapshot
- 8.1.4. Operating business segments
- 8.1.5. Product portfolio
- 8.1.6. Key strategic moves and developments
- 8.2. Emerson Electric Co.
- 8.2.1. Company overview
- 8.2.2. Key executives
- 8.2.3. Company snapshot
- 8.2.4. Operating business segments
- 8.2.5. Product portfolio
- 8.2.6. Business performance
- 8.2.7. Key strategic moves and developments
- 8.3. HepcoMotion Ltd.
- 8.3.1. Company overview
- 8.3.2. Key executives
- 8.3.3. Company snapshot
- 8.3.4. Operating business segments
- 8.3.5. Product portfolio
- 8.4. Kollmorgen Corporation
- 8.4.1. Company overview
- 8.4.2. Key executives
- 8.4.3. Company snapshot
- 8.4.4. Operating business segments
- 8.4.5. Product portfolio
- 8.5. LINAK
- 8.5.1. Company overview
- 8.5.2. Key executives
- 8.5.3. Company snapshot
- 8.5.4. Operating business segments
- 8.5.5. Product portfolio
- 8.5.6. Key strategic moves and developments
- 8.6. Oriental Motor Co., Ltd.
- 8.6.1. Company overview
- 8.6.2. Key executives
- 8.6.3. Company snapshot
- 8.6.4. Operating business segments
- 8.6.5. Product portfolio
- 8.6.6. Key strategic moves and developments
- 8.7. Parker Hannifin Corporation
- 8.7.1. Company overview
- 8.7.2. Key executives
- 8.7.3. Company snapshot
- 8.7.4. Operating business segments
- 8.7.5. Product portfolio
- 8.7.6. Business performance
- 8.8. Rockwell Automation Inc.
- 8.8.1. Company overview
- 8.8.2. Key executives
- 8.8.3. Company snapshot
- 8.8.4. Operating business segments
- 8.8.5. Product portfolio
- 8.8.6. Business performance
- 8.9. Thomson Industries, Inc.
- 8.9.1. Company overview
- 8.9.2. Key executives
- 8.9.3. Company snapshot
- 8.9.4. Operating business segments
- 8.9.5. Product portfolio
- 8.9.6. Key strategic moves and developments
- 8.10. Tolomatic, Inc.
- 8.10.1. Company overview
- 8.10.2. Key executives
- 8.10.3. Company snapshot
- 8.10.4. Operating business segments
- 8.10.5. Product portfolio
- 8.10.6. Key strategic moves and developments
LIST OF TABLES
- TABLE 01. GLOBAL LINEAR ACTUATOR MARKET, BY OPERATION MECHANISM, 2022-2032 ($MILLION)
- TABLE 02. LINEAR ACTUATOR MARKET FOR ELECTRIC, BY REGION, 2022-2032 ($MILLION)
- TABLE 03. LINEAR ACTUATOR MARKET FOR PNEUMATIC, BY REGION, 2022-2032 ($MILLION)
- TABLE 04. LINEAR ACTUATOR MARKET FOR HYDRAULIC, BY REGION, 2022-2032 ($MILLION)
- TABLE 05. LINEAR ACTUATOR MARKET FOR OTHERS, BY REGION, 2022-2032 ($MILLION)
- TABLE 06. GLOBAL LINEAR ACTUATOR MARKET, BY END USE INDUSTRY, 2022-2032 ($MILLION)
- TABLE 07. LINEAR ACTUATOR MARKET FOR AUTOMOTIVE, BY REGION, 2022-2032 ($MILLION)
- TABLE 08. LINEAR ACTUATOR MARKET FOR CONSTRUCTION, BY REGION, 2022-2032 ($MILLION)
- TABLE 09. LINEAR ACTUATOR MARKET FOR ENERGY AND MINING, BY REGION, 2022-2032 ($MILLION)
- TABLE 10. LINEAR ACTUATOR MARKET FOR HEALTHCARE, BY REGION, 2022-2032 ($MILLION)
- TABLE 11. LINEAR ACTUATOR MARKET FOR OTHERS, BY REGION, 2022-2032 ($MILLION)
- TABLE 12. LINEAR ACTUATOR MARKET, BY REGION, 2022-2032 ($MILLION)
- TABLE 13. NORTH AMERICA LINEAR ACTUATOR MARKET, BY OPERATION MECHANISM, 2022-2032 ($MILLION)
- TABLE 14. NORTH AMERICA LINEAR ACTUATOR MARKET, BY END USE INDUSTRY, 2022-2032 ($MILLION)
- TABLE 15. NORTH AMERICA LINEAR ACTUATOR MARKET, BY COUNTRY, 2022-2032 ($MILLION)
- TABLE 16. U.S. LINEAR ACTUATOR MARKET, BY OPERATION MECHANISM, 2022-2032 ($MILLION)
- TABLE 17. U.S. LINEAR ACTUATOR MARKET, BY END USE INDUSTRY, 2022-2032 ($MILLION)
- TABLE 18. CANADA LINEAR ACTUATOR MARKET, BY OPERATION MECHANISM, 2022-2032 ($MILLION)
- TABLE 19. CANADA LINEAR ACTUATOR MARKET, BY END USE INDUSTRY, 2022-2032 ($MILLION)
- TABLE 20. MEXICO LINEAR ACTUATOR MARKET, BY OPERATION MECHANISM, 2022-2032 ($MILLION)
- TABLE 21. MEXICO LINEAR ACTUATOR MARKET, BY END USE INDUSTRY, 2022-2032 ($MILLION)
- TABLE 22. EUROPE LINEAR ACTUATOR MARKET, BY OPERATION MECHANISM, 2022-2032 ($MILLION)
- TABLE 23. EUROPE LINEAR ACTUATOR MARKET, BY END USE INDUSTRY, 2022-2032 ($MILLION)
- TABLE 24. EUROPE LINEAR ACTUATOR MARKET, BY COUNTRY, 2022-2032 ($MILLION)
- TABLE 25. UK LINEAR ACTUATOR MARKET, BY OPERATION MECHANISM, 2022-2032 ($MILLION)
- TABLE 26. UK LINEAR ACTUATOR MARKET, BY END USE INDUSTRY, 2022-2032 ($MILLION)
- TABLE 27. GERMANY LINEAR ACTUATOR MARKET, BY OPERATION MECHANISM, 2022-2032 ($MILLION)
- TABLE 28. GERMANY LINEAR ACTUATOR MARKET, BY END USE INDUSTRY, 2022-2032 ($MILLION)
- TABLE 29. FRANCE LINEAR ACTUATOR MARKET, BY OPERATION MECHANISM, 2022-2032 ($MILLION)
- TABLE 30. FRANCE LINEAR ACTUATOR MARKET, BY END USE INDUSTRY, 2022-2032 ($MILLION)
- TABLE 31. REST OF EUROPE LINEAR ACTUATOR MARKET, BY OPERATION MECHANISM, 2022-2032 ($MILLION)
- TABLE 32. REST OF EUROPE LINEAR ACTUATOR MARKET, BY END USE INDUSTRY, 2022-2032 ($MILLION)
- TABLE 33. ASIA-PACIFIC LINEAR ACTUATOR MARKET, BY OPERATION MECHANISM, 2022-2032 ($MILLION)
- TABLE 34. ASIA-PACIFIC LINEAR ACTUATOR MARKET, BY END USE INDUSTRY, 2022-2032 ($MILLION)
- TABLE 35. ASIA-PACIFIC LINEAR ACTUATOR MARKET, BY COUNTRY, 2022-2032 ($MILLION)
- TABLE 36. CHINA LINEAR ACTUATOR MARKET, BY OPERATION MECHANISM, 2022-2032 ($MILLION)
- TABLE 37. CHINA LINEAR ACTUATOR MARKET, BY END USE INDUSTRY, 2022-2032 ($MILLION)
- TABLE 38. JAPAN LINEAR ACTUATOR MARKET, BY OPERATION MECHANISM, 2022-2032 ($MILLION)
- TABLE 39. JAPAN LINEAR ACTUATOR MARKET, BY END USE INDUSTRY, 2022-2032 ($MILLION)
- TABLE 40. INDIA LINEAR ACTUATOR MARKET, BY OPERATION MECHANISM, 2022-2032 ($MILLION)
- TABLE 41. INDIA LINEAR ACTUATOR MARKET, BY END USE INDUSTRY, 2022-2032 ($MILLION)
- TABLE 42. SOUTH KOREA LINEAR ACTUATOR MARKET, BY OPERATION MECHANISM, 2022-2032 ($MILLION)
- TABLE 43. SOUTH KOREA LINEAR ACTUATOR MARKET, BY END USE INDUSTRY, 2022-2032 ($MILLION)
- TABLE 44. REST OF ASIA-PACIFIC LINEAR ACTUATOR MARKET, BY OPERATION MECHANISM, 2022-2032 ($MILLION)
- TABLE 45. REST OF ASIA-PACIFIC LINEAR ACTUATOR MARKET, BY END USE INDUSTRY, 2022-2032 ($MILLION)
- TABLE 46. LAMEA LINEAR ACTUATOR MARKET, BY OPERATION MECHANISM, 2022-2032 ($MILLION)
- TABLE 47. LAMEA LINEAR ACTUATOR MARKET, BY END USE INDUSTRY, 2022-2032 ($MILLION)
- TABLE 48. LAMEA LINEAR ACTUATOR MARKET, BY COUNTRY, 2022-2032 ($MILLION)
- TABLE 49. LATIN AMERICA LINEAR ACTUATOR MARKET, BY OPERATION MECHANISM, 2022-2032 ($MILLION)
- TABLE 50. LATIN AMERICA LINEAR ACTUATOR MARKET, BY END USE INDUSTRY, 2022-2032 ($MILLION)
- TABLE 51. MIDDLE EAST LINEAR ACTUATOR MARKET, BY OPERATION MECHANISM, 2022-2032 ($MILLION)
- TABLE 52. MIDDLE EAST LINEAR ACTUATOR MARKET, BY END USE INDUSTRY, 2022-2032 ($MILLION)
- TABLE 53. AFRICA LINEAR ACTUATOR MARKET, BY OPERATION MECHANISM, 2022-2032 ($MILLION)
- TABLE 54. AFRICA LINEAR ACTUATOR MARKET, BY END USE INDUSTRY, 2022-2032 ($MILLION)
- TABLE 55. BOSCH REXROTH AG: KEY EXECUTIVES
- TABLE 56. BOSCH REXROTH AG: COMPANY SNAPSHOT
- TABLE 57. BOSCH REXROTH AG: PRODUCT SEGMENTS
- TABLE 58. BOSCH REXROTH AG: PRODUCT PORTFOLIO
- TABLE 59. BOSCH REXROTH AG: KEY STRATERGIES
- TABLE 60. EMERSON ELECTRIC CO.: KEY EXECUTIVES
- TABLE 61. EMERSON ELECTRIC CO.: COMPANY SNAPSHOT
- TABLE 62. EMERSON ELECTRIC CO.: PRODUCT SEGMENTS
- TABLE 63. EMERSON ELECTRIC CO.: PRODUCT PORTFOLIO
- TABLE 64. EMERSON ELECTRIC CO.: KEY STRATERGIES
- TABLE 65. HEPCOMOTION LTD.: KEY EXECUTIVES
- TABLE 66. HEPCOMOTION LTD.: COMPANY SNAPSHOT
- TABLE 67. HEPCOMOTION LTD.: PRODUCT SEGMENTS
- TABLE 68. HEPCOMOTION LTD.: PRODUCT PORTFOLIO
- TABLE 69. KOLLMORGEN CORPORATION: KEY EXECUTIVES
- TABLE 70. KOLLMORGEN CORPORATION: COMPANY SNAPSHOT
- TABLE 71. KOLLMORGEN CORPORATION: SERVICE SEGMENTS
- TABLE 72. KOLLMORGEN CORPORATION: PRODUCT PORTFOLIO
- TABLE 73. LINAK: KEY EXECUTIVES
- TABLE 74. LINAK: COMPANY SNAPSHOT
- TABLE 75. LINAK: PRODUCT SEGMENTS
- TABLE 76. LINAK: PRODUCT PORTFOLIO
- TABLE 77. LINAK: KEY STRATERGIES
- TABLE 78. ORIENTAL MOTOR CO., LTD.: KEY EXECUTIVES
- TABLE 79. ORIENTAL MOTOR CO., LTD.: COMPANY SNAPSHOT
- TABLE 80. ORIENTAL MOTOR CO., LTD.: PRODUCT SEGMENTS
- TABLE 81. ORIENTAL MOTOR CO., LTD.: PRODUCT PORTFOLIO
- TABLE 82. ORIENTAL MOTOR CO., LTD.: KEY STRATERGIES
- TABLE 83. PARKER HANNIFIN CORPORATION: KEY EXECUTIVES
- TABLE 84. PARKER HANNIFIN CORPORATION: COMPANY SNAPSHOT
- TABLE 85. PARKER HANNIFIN CORPORATION: PRODUCT SEGMENTS
- TABLE 86. PARKER HANNIFIN CORPORATION: PRODUCT PORTFOLIO
- TABLE 87. ROCKWELL AUTOMATION INC.: KEY EXECUTIVES
- TABLE 88. ROCKWELL AUTOMATION INC.: COMPANY SNAPSHOT
- TABLE 89. ROCKWELL AUTOMATION INC.: SERVICE SEGMENTS
- TABLE 90. ROCKWELL AUTOMATION INC.: PRODUCT PORTFOLIO
- TABLE 91. THOMSON INDUSTRIES, INC.: KEY EXECUTIVES
- TABLE 92. THOMSON INDUSTRIES, INC.: COMPANY SNAPSHOT
- TABLE 93. THOMSON INDUSTRIES, INC.: PRODUCT SEGMENTS
- TABLE 94. THOMSON INDUSTRIES, INC.: PRODUCT PORTFOLIO
- TABLE 95. THOMSON INDUSTRIES, INC.: KEY STRATERGIES
- TABLE 96. TOLOMATIC, INC.: KEY EXECUTIVES
- TABLE 97. TOLOMATIC, INC.: COMPANY SNAPSHOT
- TABLE 98. TOLOMATIC, INC.: PRODUCT SEGMENTS
- TABLE 99. TOLOMATIC, INC.: PRODUCT PORTFOLIO
- TABLE 100. TOLOMATIC, INC.: KEY STRATERGIES
LIST OF FIGURES
- FIGURE 01. LINEAR ACTUATOR MARKET, 2022-2032
- FIGURE 02. SEGMENTATION OF LINEAR ACTUATOR MARKET,2022-2032
- FIGURE 03. TOP IMPACTING FACTORS IN LINEAR ACTUATOR MARKET (2022 TO 2032)
- FIGURE 04. TOP INVESTMENT POCKETS IN LINEAR ACTUATOR MARKET (2023-2032)
- FIGURE 05. MODERATE TO HIGH BARGAINING POWER OF SUPPLIERS
- FIGURE 06. MODERATE THREAT OF NEW ENTRANTS
- FIGURE 07. LOW TO MODERATE THREAT OF SUBSTITUTES
- FIGURE 08. HIGH INTENSITY OF RIVALRY
- FIGURE 09. MODERATE BARGAINING POWER OF BUYERS
- FIGURE 10. GLOBAL LINEAR ACTUATOR MARKET:DRIVERS, RESTRAINTS AND OPPORTUNITIES
- FIGURE 11. LINEAR ACTUATOR MARKET, BY OPERATION MECHANISM, 2022 AND 2032(%)
- FIGURE 12. COMPARATIVE SHARE ANALYSIS OF LINEAR ACTUATOR MARKET FOR ELECTRIC, BY COUNTRY 2022 AND 2032(%)
- FIGURE 13. COMPARATIVE SHARE ANALYSIS OF LINEAR ACTUATOR MARKET FOR PNEUMATIC, BY COUNTRY 2022 AND 2032(%)
- FIGURE 14. COMPARATIVE SHARE ANALYSIS OF LINEAR ACTUATOR MARKET FOR HYDRAULIC, BY COUNTRY 2022 AND 2032(%)
- FIGURE 15. COMPARATIVE SHARE ANALYSIS OF LINEAR ACTUATOR MARKET FOR OTHERS, BY COUNTRY 2022 AND 2032(%)
- FIGURE 16. LINEAR ACTUATOR MARKET, BY END USE INDUSTRY, 2022 AND 2032(%)
- FIGURE 17. COMPARATIVE SHARE ANALYSIS OF LINEAR ACTUATOR MARKET FOR AUTOMOTIVE, BY COUNTRY 2022 AND 2032(%)
- FIGURE 18. COMPARATIVE SHARE ANALYSIS OF LINEAR ACTUATOR MARKET FOR CONSTRUCTION, BY COUNTRY 2022 AND 2032(%)
- FIGURE 19. COMPARATIVE SHARE ANALYSIS OF LINEAR ACTUATOR MARKET FOR ENERGY AND MINING, BY COUNTRY 2022 AND 2032(%)
- FIGURE 20. COMPARATIVE SHARE ANALYSIS OF LINEAR ACTUATOR MARKET FOR HEALTHCARE, BY COUNTRY 2022 AND 2032(%)
- FIGURE 21. COMPARATIVE SHARE ANALYSIS OF LINEAR ACTUATOR MARKET FOR OTHERS, BY COUNTRY 2022 AND 2032(%)
- FIGURE 22. LINEAR ACTUATOR MARKET BY REGION, 2022 AND 2032(%)
- FIGURE 23. U.S. LINEAR ACTUATOR MARKET, 2022-2032 ($MILLION)
- FIGURE 24. CANADA LINEAR ACTUATOR MARKET, 2022-2032 ($MILLION)
- FIGURE 25. MEXICO LINEAR ACTUATOR MARKET, 2022-2032 ($MILLION)
- FIGURE 26. UK LINEAR ACTUATOR MARKET, 2022-2032 ($MILLION)
- FIGURE 27. GERMANY LINEAR ACTUATOR MARKET, 2022-2032 ($MILLION)
- FIGURE 28. FRANCE LINEAR ACTUATOR MARKET, 2022-2032 ($MILLION)
- FIGURE 29. REST OF EUROPE LINEAR ACTUATOR MARKET, 2022-2032 ($MILLION)
- FIGURE 30. CHINA LINEAR ACTUATOR MARKET, 2022-2032 ($MILLION)
- FIGURE 31. JAPAN LINEAR ACTUATOR MARKET, 2022-2032 ($MILLION)
- FIGURE 32. INDIA LINEAR ACTUATOR MARKET, 2022-2032 ($MILLION)
- FIGURE 33. SOUTH KOREA LINEAR ACTUATOR MARKET, 2022-2032 ($MILLION)
- FIGURE 34. REST OF ASIA-PACIFIC LINEAR ACTUATOR MARKET, 2022-2032 ($MILLION)
- FIGURE 35. LATIN AMERICA LINEAR ACTUATOR MARKET, 2022-2032 ($MILLION)
- FIGURE 36. MIDDLE EAST LINEAR ACTUATOR MARKET, 2022-2032 ($MILLION)
- FIGURE 37. AFRICA LINEAR ACTUATOR MARKET, 2022-2032 ($MILLION)
- FIGURE 38. TOP WINNING STRATEGIES, BY YEAR (2020-2023)
- FIGURE 39. TOP WINNING STRATEGIES, BY DEVELOPMENT (2020-2023)
- FIGURE 40. TOP WINNING STRATEGIES, BY COMPANY (2020-2023)
- FIGURE 41. PRODUCT MAPPING OF TOP 10 PLAYERS
- FIGURE 42. COMPETITIVE DASHBOARD
- FIGURE 43. COMPETITIVE HEATMAP: LINEAR ACTUATOR MARKET
- FIGURE 44. TOP PLAYER POSITIONING, 2022
- FIGURE 45. EMERSON ELECTRIC CO.: NET SALES, 2021-2023 ($MILLION)
- FIGURE 46. EMERSON ELECTRIC CO.: REVENUE SHARE BY REGION, 2023 (%)
- FIGURE 47. PARKER-HANNIFIN CORPORATION: NET SALES, 2021-2023 ($MILLION)
- FIGURE 48. PARKER-HANNIFIN CORPORATION: RESEARCH & DEVELOPMENT EXPENDITURE, 2021-2023 ($MILLION)
- FIGURE 49. PARKER-HANNIFIN CORPORATION: REVENUE SHARE BY SEGMENT, 2023 (%)
- FIGURE 50. PARKER-HANNIFIN CORPORATION: REVENUE SHARE BY REGION, 2023 (%)
- FIGURE 51. ROCKWELL AUTOMATION INC.: NET SALES, 2020-2022 ($MILLION)
- FIGURE 52. ROCKWELL AUTOMATION INC.: REVENUE SHARE BY SEGMENT, 2022 (%)
- FIGURE 53. ROCKWELL AUTOMATION INC.: REVENUE SHARE BY REGION, 2022 (%)
 2024 年液压和电动线性致动器全球市场报告
 线性致动器市场:按运行机制、分销管道和最终应用划分 - 2025-2030 年全球预测
 国防用驱动系统的全球市场 (2024~2034年)
 线性致动器的全球市场 2024-2028
 电动直线执行器的全球市场规模:按类型、按应用、按最终用户行业、按地区、范围和预测
 2024 年线性致动器全球市场报告
 小型电动线性致动器的全球市场:市场占有率与排行榜,整体销售额与需求预测(2024年~2030年)
 液压和电动线性致动器市场:按类型、按销售类型、按最终用户行业、按推力:2023-2032 年全球机会分析和行业预测
 全球线性致动器市场规模、份额和趋势分析报告:按运行机制、最终用途和地区划分,2023-2030 年展望和预测
 线性致动器市场规模、份额、趋势分析报告:按运行机制、按地区、细分市场预测,2024-2030 年