


 |
市场调查报告书
商品编码
1447181
凿岩机市场:按产品、製造商、最终用途产业:2023-2032 年全球机会分析与产业预测Rock Drilling Equipment Market By Product (Medium-Sized, Large-Sized, Heavy-Sized), By Manufacturer (OEM, Aftermarket), By End-use Industry (Mining, Construction): Global Opportunity Analysis and Industry Forecast, 2023-2032 |
||||||
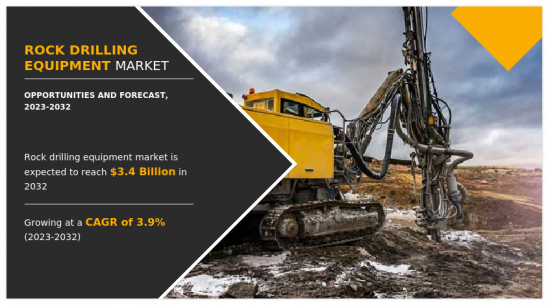
凿岩机涵盖了多种用于在岩石表面钻孔的技术,可实现广泛的工业应用。
该设备用于采矿、建筑、地质勘探以及石油和天然气生产。手提钻的主要任务是突破顽固的地质构造,从而获得宝贵的资源或为基础设施建设铺平道路。手提钻在采矿中至关重要,因为取得丰富的矿物通常需要穿透坚硬的岩层。采矿作业中的先进钻探技术可提高生产力、加快采矿速度并提高安全要求。
手提钻用途广泛,可用于各种地质条件。它们的适应性使这些仪器适用于从软土到硬岩层的广泛应用,使其在许多行业中具有价值。现代凿岩机上安装的传感器和资料监控系统提供有关钻孔参数的即时资讯。这些资料可协助您做出明智的决策、改善钻井方法并防止设备故障。凿岩机的远端控制和自动化提高了安全性和效率。挖掘作业可以远端控制,减少人员进入危险区域的需要。
高昂的采购和维护成本是扩大凿岩机市场的主要障碍。这些设备中使用的现代技术和材料提高了效率,同时增加了总成本。公司必须进行大量的初始投资来购买创新的钻井设备,并且持续的维护成本也很高。这种财务负担对于中小型企业来说尤其困难,这可能会限制他们获得最具创新性和成本效益的钻井技术。随着这些设备的进步,它们变得越来越复杂,需要经验丰富的操作员才能正常运作。公司在培养和留住优秀员工方面可能面临挑战,从而导致营运成本增加和重大风险。
全球基础设施开发计划数量的不断增加是推动凿岩机市场扩张的主要潜在因素之一。随着各国投入资金改善交通网络、建造新结构和扩大能源资源,对高效、强大的手提钻的需求不断增加。新兴经济体对这些技术的需求尤其强烈,这些国家的都市化和工业化程度不断提高,正在推动大规模基础设施投资。人们对风能和太阳能等再生能源来源的日益重视,增加了对用于位置评估和基础安装的土壤开挖的需求。随着现有基础设施的老化,维护、修理和更换的需求不断增加。这创造了对凿岩机的持续需求,特别是当旧设备升级或更换为更先进的型号时。
疫情期间,阻碍手提钻业务的主要困难是缺乏技术纯熟劳工。封锁、社交距离和健康问题都限制了劳动力的供应。缺乏合格劳动力不仅影响设备生产,也影响现有设备的服务和维护。公司必须透过执行职场安全措施、尽可能实施远距工作以及投资培训计划来应对技能差距。在建筑和采矿业,由于疫情的影响,凿岩机的需求下降。由于经济不稳定和封锁措施,一些计划被搁置,而计划延迟获得必要的授权。
相关人员的主要利益
- 该报告提供了 2022 年至 2032 年凿岩机市场分析的细分市场、当前趋势、估计和趋势分析以及动态,并确定了一般凿岩机市场机会。
- 我们提供市场研究以及与市场驱动因素、市场限制和市场机会相关的资讯。
- 波特的五力分析强调买家和供应商帮助相关人员做出利润驱动的商业决策并加强供应商-买家网路的潜力。
- 对凿岩设备市场细分的详细分析有助于识别市场机会。
- 每个地区的主要国家都根据其对全球市场的收益贡献绘製了地图。
- 市场参与者定位有助于基准化分析,并提供对市场参与者当前地位的清晰了解。
- 该报告包括对区域和全球凿岩机市场趋势、主要企业、细分市场、应用领域和市场成长策略的分析。
可以使用此报告进行定制
- 消费者购买行为分析
- 最终用户偏好和痛点
- 投资机会
- 按地区分類的新参与企业
- 科技趋势分析
- 打入市场策略
- 按产品/细分市场区隔
- 痛点分析
- 监管指引
- 策略建议
- 针对客户兴趣的其他公司简介
- 按国家或地区进行的附加分析 – 市场规模和预测
- 十字交叉细分市场分析 - 市场规模与预测
- 公司简介的扩充列表
- 历史市场资料
- 主要参与者的详细资料(Excel格式,包括位置、联络资讯、供应商/供应商网路等)
- 全球/区域/国家层级参与者的市场占有率分析
- SWOT分析
目录
第一章简介
第 2 章执行摘要
第三章市场概况
- 市场定义和范围
- 主要发现
- 影响因素
- 主要投资机会
- 波特五力分析
- 市场动态
- 促进因素
- 抑制因素
- 机会
- 市场占有率分析
- 品牌占有率分析
- 价值链分析
- 关键监管分析
- 专利情况
第四章凿岩机市场:依产品
- 概述
- 中等大小
- 大的
- 重型
第五章凿岩机市场:依製造商分类
- 概述
- OEM
- 售后市场
第六章凿岩机市场:依最终用途产业
- 概述
- 矿业
- 建造
第七章 凿岩设备市场:依地区 凿岩设备市场:依地区
- 概述
- 北美洲
- 美国
- 加拿大
- 墨西哥
- 欧洲
- 德国
- 英国
- 法国
- 西班牙
- 义大利
- 其他的
- 亚太地区
- 中国
- 日本
- 印度
- 韩国
- 澳洲
- 其他的
- 拉丁美洲/中东/非洲
- 巴西
- 沙乌地阿拉伯
- UAE
- 南非
- 其他的
第八章 竞争格局
- 介绍
- 关键成功策略
- 10家主要企业产品图谱
- 竞争对手仪表板
- 竞争热图
- 2022年主要企业定位
第九章 公司简介
- Drill KIng International.LP
- Epiroc AB
- Furukawa Rock Drill
- Global Mining Equipments
- Holte Manufacturing
- Mincon Group Plc
- Numa Tool Company
- Rockmore International,Inc.
- Rock-Tech International
- Sandvik AB
Rock drilling equipment encompasses a wide range of technologies used to drilling holes into rock surfaces, allowing for a wide range of industrial applications. This equipment is used in mining, construction, geotechnical exploration, and oil & gas production. Rock drilling equipment's principal duty is to break through stubborn geological formations, allowing access to valuable resources or opening the way for infrastructure construction. Access to rich minerals typically necessitates penetrating hard rock formations, hence rock drilling equipment is crucial in mining. Advanced drilling technologies in mining operations result in increased productivity, faster extraction rates, and improved safety requirements.
Rock drilling equipment is extremely versatile and may be used in a wide range of geological conditions. Owing to their adaptability, these instruments are suited for a wide range of applications, from soft soil to hard rock formations, enhancing their value across a number of industries. Sensors and data monitoring systems on contemporary rock drilling equipment provide real-time information on drilling parameters. This data is useful for making informed decisions, improving drilling methods, and preventing equipment failures. Remote operation and automation in rock drilling equipment enhances safety and efficiency. Drilling operations may be controlled remotely, reducing the need for human presence in hazardous places.
The high cost of acquisition and maintenance is a major obstacle in the rock drilling equipment market expansion. Modern technology and materials used in these devices increase efficiency while increasing total cost. Companies need to make huge initial investments to obtain innovative drilling equipment and ongoing maintenance costs can also be substantial. This financial burden can be particularly challenging for small and medium-sized firms, limiting their access to the most innovative and cost-effective drilling technologies. As these instruments advance, they become more complicated and require experienced operators to function properly. Companies may have challenges in training and retaining talented staff, resulting in increased operational costs and considerable risks.
The increase in infrastructure development projects worldwide is one of the key potential factors driving the rock drilling equipment market expansion. As countries spend on improving their transportation networks, creating new structures, and expanding energy resources, the demand for efficient and powerful rock drilling equipment increases. The need for these technologies is particularly strong in emerging countries, where growing urbanization and industrialization are driving significant infrastructure investments. The growing emphasis on renewable energy sources like wind and solar boosts the demand for geotechnical drilling for site evaluations and foundation installation. As existing infrastructure ages, there is an ongoing need for maintenance, repairs, and replacement. This creates a continuous demand for rock drilling equipment, especially as older equipment is upgraded or replaced with more advanced models.
During the pandemic, the main difficulty hampering the rock drilling equipment business was a lack of skilled labor. Lockdowns, social distancing measures, and health difficulties all limited workforce availability. The lack of qualified labor affects not just equipment production but also servicing and maintenance of existing units. Companies were forced to respond by implementing strict workplace safety measures, implementing remote work wherever possible, and investing in training programs to overcome the skills gap. Demand for rock drilling equipment in the construction and mining industries was hampered as a result of the pandemic. Some projects were put on hold due to economic uncertainties and lockdown measures, while others were delayed in obtaining necessary permits and licenses.
The key players profiled in this report include Atlas Copco, Hitachi Zosen, Sandvik Construction, Sanyhe International Holdings, Herrenknecht, Furukawa Rock Drill, Kawasaki Heavy, Komatsu, Sunward Equipment Group, China Railway Engineering, and XCMG Group. The market players are continuously striving to achieve a dominant position in this competitive market using strategies such as product innovation and development of rock drilling equipment.
Key Benefits For Stakeholders
- This report provides a quantitative analysis of the market segments, current trends, estimations, and dynamics of the rock drilling equipment market analysis from 2022 to 2032 to identify the prevailing rock drilling equipment market opportunities.
- The market research is offered along with information related to key drivers, restraints, and opportunities.
- Porter's five forces analysis highlights the potency of buyers and suppliers to enable stakeholders make profit-oriented business decisions and strengthen their supplier-buyer network.
- In-depth analysis of the rock drilling equipment market segmentation assists to determine the prevailing market opportunities.
- Major countries in each region are mapped according to their revenue contribution to the global market.
- Market player positioning facilitates benchmarking and provides a clear understanding of the present position of the market players.
- The report includes the analysis of the regional as well as global rock drilling equipment market trends, key players, market segments, application areas, and market growth strategies.
Additional benefits you will get with this purchase are:
- Quarterly Update and* (only available with a corporate license, on listed price)
- 5 additional Company Profile of client Choice pre- or Post-purchase, as a free update.
- Free Upcoming Version on the Purchase of Five and Enterprise User License.
- 16 analyst hours of support* (post-purchase, if you find additional data requirements upon review of the report, you may receive support amounting to 16 analyst hours to solve questions, and post-sale queries)
- 15% Free Customization* (in case the scope or segment of the report does not match your requirements, 15% is equivalent to 3 working days of free work, applicable once)
- Free data Pack on the Five and Enterprise User License. (Excel version of the report)
- Free Updated report if the report is 6-12 months old or older.
- 24-hour priority response*
- Free Industry updates and white papers.
Possible Customization with this report (with additional cost and timeline, please talk to the sales executive to know more)
- Consumer Buying Behavior Analysis
- End user preferences and pain points
- Investment Opportunities
- Upcoming/New Entrant by Regions
- Technology Trend Analysis
- Go To Market Strategy
- Market share analysis of players by products/segments
- Pain Point Analysis
- Regulatory Guidelines
- Strategic Recommedations
- Additional company profiles with specific to client's interest
- Additional country or region analysis- market size and forecast
- Criss-cross segment analysis- market size and forecast
- Expanded list for Company Profiles
- Historic market data
- Key player details (including location, contact details, supplier/vendor network etc. in excel format)
- Market share analysis of players at global/region/country level
- SWOT Analysis
Key Market Segments
By Product
- Medium-Sized
- Large-Sized
- Heavy-Sized
By Manufacturer
- OEM
- Aftermarket
By End-use Industry
- Mining
- Construction
By Region
- North America
- U.S.
- Canada
- Mexico
- Europe
- Germany
- UK
- France
- Spain
- Italy
- Rest of Europe
- Asia-Pacific
- China
- Japan
- India
- South Korea
- Australia
- Rest of Asia-Pacific
- LAMEA
- Brazil
- Saudi Arabia
- UAE
- South Africa
- Rest of LAMEA
Key Market Players:
- Drill KIng International.L.P
- Epiroc AB
- Furukawa Rock Drill
- Global Mining Equipments
- Holte Manufacturing
- Mincon Group Plc
- Numa Tool Company
- Rockmore International,Inc.
- Rock- Tech International
- Sandvik AB
TABLE OF CONTENTS
CHAPTER 1: INTRODUCTION
- 1.1. Report description
- 1.2. Key market segments
- 1.3. Key benefits to the stakeholders
- 1.4. Research methodology
- 1.4.1. Primary research
- 1.4.2. Secondary research
- 1.4.3. Analyst tools and models
CHAPTER 2: EXECUTIVE SUMMARY
- 2.1. CXO Perspective
CHAPTER 3: MARKET OVERVIEW
- 3.1. Market definition and scope
- 3.2. Key findings
- 3.2.1. Top impacting factors
- 3.2.2. Top investment pockets
- 3.3. Porter's five forces analysis
- 3.4. Market dynamics
- 3.4.1. Drivers
- 3.4.2. Restraints
- 3.4.3. Opportunities
- 3.5. Market Share Analysis
- 3.6. Brand Share Analysis
- 3.7. Value Chain Analysis
- 3.8. Key Regulation Analysis
- 3.9. Patent Landscape
CHAPTER 4: ROCK DRILLING EQUIPMENT MARKET, BY PRODUCT
- 4.1. Overview
- 4.1.1. Market size and forecast
- 4.2. Medium-Sized
- 4.2.1. Key market trends, growth factors and opportunities
- 4.2.2. Market size and forecast, by region
- 4.2.3. Market share analysis by country
- 4.3. Large-Sized
- 4.3.1. Key market trends, growth factors and opportunities
- 4.3.2. Market size and forecast, by region
- 4.3.3. Market share analysis by country
- 4.4. Heavy-Sized
- 4.4.1. Key market trends, growth factors and opportunities
- 4.4.2. Market size and forecast, by region
- 4.4.3. Market share analysis by country
CHAPTER 5: ROCK DRILLING EQUIPMENT MARKET, BY MANUFACTURER
- 5.1. Overview
- 5.1.1. Market size and forecast
- 5.2. OEM
- 5.2.1. Key market trends, growth factors and opportunities
- 5.2.2. Market size and forecast, by region
- 5.2.3. Market share analysis by country
- 5.3. Aftermarket
- 5.3.1. Key market trends, growth factors and opportunities
- 5.3.2. Market size and forecast, by region
- 5.3.3. Market share analysis by country
CHAPTER 6: ROCK DRILLING EQUIPMENT MARKET, BY END-USE INDUSTRY
- 6.1. Overview
- 6.1.1. Market size and forecast
- 6.2. Mining
- 6.2.1. Key market trends, growth factors and opportunities
- 6.2.2. Market size and forecast, by region
- 6.2.3. Market share analysis by country
- 6.3. Construction
- 6.3.1. Key market trends, growth factors and opportunities
- 6.3.2. Market size and forecast, by region
- 6.3.3. Market share analysis by country
CHAPTER 7: ROCK DRILLING EQUIPMENT MARKET, BY REGION
- 7.1. Overview
- 7.1.1. Market size and forecast By Region
- 7.2. North America
- 7.2.1. Key market trends, growth factors and opportunities
- 7.2.2. Market size and forecast, by Product
- 7.2.3. Market size and forecast, by Manufacturer
- 7.2.4. Market size and forecast, by End-use Industry
- 7.2.5. Market size and forecast, by country
- 7.2.5.1. U.S.
- 7.2.5.1.1. Market size and forecast, by Product
- 7.2.5.1.2. Market size and forecast, by Manufacturer
- 7.2.5.1.3. Market size and forecast, by End-use Industry
- 7.2.5.2. Canada
- 7.2.5.2.1. Market size and forecast, by Product
- 7.2.5.2.2. Market size and forecast, by Manufacturer
- 7.2.5.2.3. Market size and forecast, by End-use Industry
- 7.2.5.3. Mexico
- 7.2.5.3.1. Market size and forecast, by Product
- 7.2.5.3.2. Market size and forecast, by Manufacturer
- 7.2.5.3.3. Market size and forecast, by End-use Industry
- 7.3. Europe
- 7.3.1. Key market trends, growth factors and opportunities
- 7.3.2. Market size and forecast, by Product
- 7.3.3. Market size and forecast, by Manufacturer
- 7.3.4. Market size and forecast, by End-use Industry
- 7.3.5. Market size and forecast, by country
- 7.3.5.1. Germany
- 7.3.5.1.1. Market size and forecast, by Product
- 7.3.5.1.2. Market size and forecast, by Manufacturer
- 7.3.5.1.3. Market size and forecast, by End-use Industry
- 7.3.5.2. UK
- 7.3.5.2.1. Market size and forecast, by Product
- 7.3.5.2.2. Market size and forecast, by Manufacturer
- 7.3.5.2.3. Market size and forecast, by End-use Industry
- 7.3.5.3. France
- 7.3.5.3.1. Market size and forecast, by Product
- 7.3.5.3.2. Market size and forecast, by Manufacturer
- 7.3.5.3.3. Market size and forecast, by End-use Industry
- 7.3.5.4. Spain
- 7.3.5.4.1. Market size and forecast, by Product
- 7.3.5.4.2. Market size and forecast, by Manufacturer
- 7.3.5.4.3. Market size and forecast, by End-use Industry
- 7.3.5.5. Italy
- 7.3.5.5.1. Market size and forecast, by Product
- 7.3.5.5.2. Market size and forecast, by Manufacturer
- 7.3.5.5.3. Market size and forecast, by End-use Industry
- 7.3.5.6. Rest of Europe
- 7.3.5.6.1. Market size and forecast, by Product
- 7.3.5.6.2. Market size and forecast, by Manufacturer
- 7.3.5.6.3. Market size and forecast, by End-use Industry
- 7.4. Asia-Pacific
- 7.4.1. Key market trends, growth factors and opportunities
- 7.4.2. Market size and forecast, by Product
- 7.4.3. Market size and forecast, by Manufacturer
- 7.4.4. Market size and forecast, by End-use Industry
- 7.4.5. Market size and forecast, by country
- 7.4.5.1. China
- 7.4.5.1.1. Market size and forecast, by Product
- 7.4.5.1.2. Market size and forecast, by Manufacturer
- 7.4.5.1.3. Market size and forecast, by End-use Industry
- 7.4.5.2. Japan
- 7.4.5.2.1. Market size and forecast, by Product
- 7.4.5.2.2. Market size and forecast, by Manufacturer
- 7.4.5.2.3. Market size and forecast, by End-use Industry
- 7.4.5.3. India
- 7.4.5.3.1. Market size and forecast, by Product
- 7.4.5.3.2. Market size and forecast, by Manufacturer
- 7.4.5.3.3. Market size and forecast, by End-use Industry
- 7.4.5.4. South Korea
- 7.4.5.4.1. Market size and forecast, by Product
- 7.4.5.4.2. Market size and forecast, by Manufacturer
- 7.4.5.4.3. Market size and forecast, by End-use Industry
- 7.4.5.5. Australia
- 7.4.5.5.1. Market size and forecast, by Product
- 7.4.5.5.2. Market size and forecast, by Manufacturer
- 7.4.5.5.3. Market size and forecast, by End-use Industry
- 7.4.5.6. Rest of Asia-Pacific
- 7.4.5.6.1. Market size and forecast, by Product
- 7.4.5.6.2. Market size and forecast, by Manufacturer
- 7.4.5.6.3. Market size and forecast, by End-use Industry
- 7.5. LAMEA
- 7.5.1. Key market trends, growth factors and opportunities
- 7.5.2. Market size and forecast, by Product
- 7.5.3. Market size and forecast, by Manufacturer
- 7.5.4. Market size and forecast, by End-use Industry
- 7.5.5. Market size and forecast, by country
- 7.5.5.1. Brazil
- 7.5.5.1.1. Market size and forecast, by Product
- 7.5.5.1.2. Market size and forecast, by Manufacturer
- 7.5.5.1.3. Market size and forecast, by End-use Industry
- 7.5.5.2. Saudi Arabia
- 7.5.5.2.1. Market size and forecast, by Product
- 7.5.5.2.2. Market size and forecast, by Manufacturer
- 7.5.5.2.3. Market size and forecast, by End-use Industry
- 7.5.5.3. UAE
- 7.5.5.3.1. Market size and forecast, by Product
- 7.5.5.3.2. Market size and forecast, by Manufacturer
- 7.5.5.3.3. Market size and forecast, by End-use Industry
- 7.5.5.4. South Africa
- 7.5.5.4.1. Market size and forecast, by Product
- 7.5.5.4.2. Market size and forecast, by Manufacturer
- 7.5.5.4.3. Market size and forecast, by End-use Industry
- 7.5.5.5. Rest of LAMEA
- 7.5.5.5.1. Market size and forecast, by Product
- 7.5.5.5.2. Market size and forecast, by Manufacturer
- 7.5.5.5.3. Market size and forecast, by End-use Industry
CHAPTER 8: COMPETITIVE LANDSCAPE
- 8.1. Introduction
- 8.2. Top winning strategies
- 8.3. Product mapping of top 10 player
- 8.4. Competitive dashboard
- 8.5. Competitive heatmap
- 8.6. Top player positioning, 2022
CHAPTER 9: COMPANY PROFILES
- 9.1. Drill KIng International.L.P
- 9.1.1. Company overview
- 9.1.2. Key executives
- 9.1.3. Company snapshot
- 9.1.4. Operating business segments
- 9.1.5. Product portfolio
- 9.1.6. Business performance
- 9.1.7. Key strategic moves and developments
- 9.2. Epiroc AB
- 9.2.1. Company overview
- 9.2.2. Key executives
- 9.2.3. Company snapshot
- 9.2.4. Operating business segments
- 9.2.5. Product portfolio
- 9.2.6. Business performance
- 9.2.7. Key strategic moves and developments
- 9.3. Furukawa Rock Drill
- 9.3.1. Company overview
- 9.3.2. Key executives
- 9.3.3. Company snapshot
- 9.3.4. Operating business segments
- 9.3.5. Product portfolio
- 9.3.6. Business performance
- 9.3.7. Key strategic moves and developments
- 9.4. Global Mining Equipments
- 9.4.1. Company overview
- 9.4.2. Key executives
- 9.4.3. Company snapshot
- 9.4.4. Operating business segments
- 9.4.5. Product portfolio
- 9.4.6. Business performance
- 9.4.7. Key strategic moves and developments
- 9.5. Holte Manufacturing
- 9.5.1. Company overview
- 9.5.2. Key executives
- 9.5.3. Company snapshot
- 9.5.4. Operating business segments
- 9.5.5. Product portfolio
- 9.5.6. Business performance
- 9.5.7. Key strategic moves and developments
- 9.6. Mincon Group Plc
- 9.6.1. Company overview
- 9.6.2. Key executives
- 9.6.3. Company snapshot
- 9.6.4. Operating business segments
- 9.6.5. Product portfolio
- 9.6.6. Business performance
- 9.6.7. Key strategic moves and developments
- 9.7. Numa Tool Company
- 9.7.1. Company overview
- 9.7.2. Key executives
- 9.7.3. Company snapshot
- 9.7.4. Operating business segments
- 9.7.5. Product portfolio
- 9.7.6. Business performance
- 9.7.7. Key strategic moves and developments
- 9.8. Rockmore International,Inc.
- 9.8.1. Company overview
- 9.8.2. Key executives
- 9.8.3. Company snapshot
- 9.8.4. Operating business segments
- 9.8.5. Product portfolio
- 9.8.6. Business performance
- 9.8.7. Key strategic moves and developments
- 9.9. Rock- Tech International
- 9.9.1. Company overview
- 9.9.2. Key executives
- 9.9.3. Company snapshot
- 9.9.4. Operating business segments
- 9.9.5. Product portfolio
- 9.9.6. Business performance
- 9.9.7. Key strategic moves and developments
- 9.10. Sandvik AB
- 9.10.1. Company overview
- 9.10.2. Key executives
- 9.10.3. Company snapshot
- 9.10.4. Operating business segments
- 9.10.5. Product portfolio
- 9.10.6. Business performance
- 9.10.7. Key strategic moves and developments
LIST OF TABLES
- TABLE 01. GLOBAL ROCK DRILLING EQUIPMENT MARKET, BY PRODUCT, 2022-2032 ($MILLION)
- TABLE 02. ROCK DRILLING EQUIPMENT MARKET FOR MEDIUM-SIZED, BY REGION, 2022-2032 ($MILLION)
- TABLE 03. ROCK DRILLING EQUIPMENT MARKET FOR LARGE-SIZED, BY REGION, 2022-2032 ($MILLION)
- TABLE 04. ROCK DRILLING EQUIPMENT MARKET FOR HEAVY-SIZED, BY REGION, 2022-2032 ($MILLION)
- TABLE 05. GLOBAL ROCK DRILLING EQUIPMENT MARKET, BY MANUFACTURER, 2022-2032 ($MILLION)
- TABLE 06. ROCK DRILLING EQUIPMENT MARKET FOR OEM, BY REGION, 2022-2032 ($MILLION)
- TABLE 07. ROCK DRILLING EQUIPMENT MARKET FOR AFTERMARKET, BY REGION, 2022-2032 ($MILLION)
- TABLE 08. GLOBAL ROCK DRILLING EQUIPMENT MARKET, BY END-USE INDUSTRY, 2022-2032 ($MILLION)
- TABLE 09. ROCK DRILLING EQUIPMENT MARKET FOR MINING, BY REGION, 2022-2032 ($MILLION)
- TABLE 10. ROCK DRILLING EQUIPMENT MARKET FOR CONSTRUCTION, BY REGION, 2022-2032 ($MILLION)
- TABLE 11. ROCK DRILLING EQUIPMENT MARKET, BY REGION, 2022-2032 ($MILLION)
- TABLE 12. NORTH AMERICA ROCK DRILLING EQUIPMENT MARKET, BY PRODUCT, 2022-2032 ($MILLION)
- TABLE 13. NORTH AMERICA ROCK DRILLING EQUIPMENT MARKET, BY MANUFACTURER, 2022-2032 ($MILLION)
- TABLE 14. NORTH AMERICA ROCK DRILLING EQUIPMENT MARKET, BY END-USE INDUSTRY, 2022-2032 ($MILLION)
- TABLE 15. NORTH AMERICA ROCK DRILLING EQUIPMENT MARKET, BY COUNTRY, 2022-2032 ($MILLION)
- TABLE 16. U.S. ROCK DRILLING EQUIPMENT MARKET, BY PRODUCT, 2022-2032 ($MILLION)
- TABLE 17. U.S. ROCK DRILLING EQUIPMENT MARKET, BY MANUFACTURER, 2022-2032 ($MILLION)
- TABLE 18. U.S. ROCK DRILLING EQUIPMENT MARKET, BY END-USE INDUSTRY, 2022-2032 ($MILLION)
- TABLE 19. CANADA ROCK DRILLING EQUIPMENT MARKET, BY PRODUCT, 2022-2032 ($MILLION)
- TABLE 20. CANADA ROCK DRILLING EQUIPMENT MARKET, BY MANUFACTURER, 2022-2032 ($MILLION)
- TABLE 21. CANADA ROCK DRILLING EQUIPMENT MARKET, BY END-USE INDUSTRY, 2022-2032 ($MILLION)
- TABLE 22. MEXICO ROCK DRILLING EQUIPMENT MARKET, BY PRODUCT, 2022-2032 ($MILLION)
- TABLE 23. MEXICO ROCK DRILLING EQUIPMENT MARKET, BY MANUFACTURER, 2022-2032 ($MILLION)
- TABLE 24. MEXICO ROCK DRILLING EQUIPMENT MARKET, BY END-USE INDUSTRY, 2022-2032 ($MILLION)
- TABLE 25. EUROPE ROCK DRILLING EQUIPMENT MARKET, BY PRODUCT, 2022-2032 ($MILLION)
- TABLE 26. EUROPE ROCK DRILLING EQUIPMENT MARKET, BY MANUFACTURER, 2022-2032 ($MILLION)
- TABLE 27. EUROPE ROCK DRILLING EQUIPMENT MARKET, BY END-USE INDUSTRY, 2022-2032 ($MILLION)
- TABLE 28. EUROPE ROCK DRILLING EQUIPMENT MARKET, BY COUNTRY, 2022-2032 ($MILLION)
- TABLE 29. GERMANY ROCK DRILLING EQUIPMENT MARKET, BY PRODUCT, 2022-2032 ($MILLION)
- TABLE 30. GERMANY ROCK DRILLING EQUIPMENT MARKET, BY MANUFACTURER, 2022-2032 ($MILLION)
- TABLE 31. GERMANY ROCK DRILLING EQUIPMENT MARKET, BY END-USE INDUSTRY, 2022-2032 ($MILLION)
- TABLE 32. UK ROCK DRILLING EQUIPMENT MARKET, BY PRODUCT, 2022-2032 ($MILLION)
- TABLE 33. UK ROCK DRILLING EQUIPMENT MARKET, BY MANUFACTURER, 2022-2032 ($MILLION)
- TABLE 34. UK ROCK DRILLING EQUIPMENT MARKET, BY END-USE INDUSTRY, 2022-2032 ($MILLION)
- TABLE 35. FRANCE ROCK DRILLING EQUIPMENT MARKET, BY PRODUCT, 2022-2032 ($MILLION)
- TABLE 36. FRANCE ROCK DRILLING EQUIPMENT MARKET, BY MANUFACTURER, 2022-2032 ($MILLION)
- TABLE 37. FRANCE ROCK DRILLING EQUIPMENT MARKET, BY END-USE INDUSTRY, 2022-2032 ($MILLION)
- TABLE 38. SPAIN ROCK DRILLING EQUIPMENT MARKET, BY PRODUCT, 2022-2032 ($MILLION)
- TABLE 39. SPAIN ROCK DRILLING EQUIPMENT MARKET, BY MANUFACTURER, 2022-2032 ($MILLION)
- TABLE 40. SPAIN ROCK DRILLING EQUIPMENT MARKET, BY END-USE INDUSTRY, 2022-2032 ($MILLION)
- TABLE 41. ITALY ROCK DRILLING EQUIPMENT MARKET, BY PRODUCT, 2022-2032 ($MILLION)
- TABLE 42. ITALY ROCK DRILLING EQUIPMENT MARKET, BY MANUFACTURER, 2022-2032 ($MILLION)
- TABLE 43. ITALY ROCK DRILLING EQUIPMENT MARKET, BY END-USE INDUSTRY, 2022-2032 ($MILLION)
- TABLE 44. REST OF EUROPE ROCK DRILLING EQUIPMENT MARKET, BY PRODUCT, 2022-2032 ($MILLION)
- TABLE 45. REST OF EUROPE ROCK DRILLING EQUIPMENT MARKET, BY MANUFACTURER, 2022-2032 ($MILLION)
- TABLE 46. REST OF EUROPE ROCK DRILLING EQUIPMENT MARKET, BY END-USE INDUSTRY, 2022-2032 ($MILLION)
- TABLE 47. ASIA-PACIFIC ROCK DRILLING EQUIPMENT MARKET, BY PRODUCT, 2022-2032 ($MILLION)
- TABLE 48. ASIA-PACIFIC ROCK DRILLING EQUIPMENT MARKET, BY MANUFACTURER, 2022-2032 ($MILLION)
- TABLE 49. ASIA-PACIFIC ROCK DRILLING EQUIPMENT MARKET, BY END-USE INDUSTRY, 2022-2032 ($MILLION)
- TABLE 50. ASIA-PACIFIC ROCK DRILLING EQUIPMENT MARKET, BY COUNTRY, 2022-2032 ($MILLION)
- TABLE 51. CHINA ROCK DRILLING EQUIPMENT MARKET, BY PRODUCT, 2022-2032 ($MILLION)
- TABLE 52. CHINA ROCK DRILLING EQUIPMENT MARKET, BY MANUFACTURER, 2022-2032 ($MILLION)
- TABLE 53. CHINA ROCK DRILLING EQUIPMENT MARKET, BY END-USE INDUSTRY, 2022-2032 ($MILLION)
- TABLE 54. JAPAN ROCK DRILLING EQUIPMENT MARKET, BY PRODUCT, 2022-2032 ($MILLION)
- TABLE 55. JAPAN ROCK DRILLING EQUIPMENT MARKET, BY MANUFACTURER, 2022-2032 ($MILLION)
- TABLE 56. JAPAN ROCK DRILLING EQUIPMENT MARKET, BY END-USE INDUSTRY, 2022-2032 ($MILLION)
- TABLE 57. INDIA ROCK DRILLING EQUIPMENT MARKET, BY PRODUCT, 2022-2032 ($MILLION)
- TABLE 58. INDIA ROCK DRILLING EQUIPMENT MARKET, BY MANUFACTURER, 2022-2032 ($MILLION)
- TABLE 59. INDIA ROCK DRILLING EQUIPMENT MARKET, BY END-USE INDUSTRY, 2022-2032 ($MILLION)
- TABLE 60. SOUTH KOREA ROCK DRILLING EQUIPMENT MARKET, BY PRODUCT, 2022-2032 ($MILLION)
- TABLE 61. SOUTH KOREA ROCK DRILLING EQUIPMENT MARKET, BY MANUFACTURER, 2022-2032 ($MILLION)
- TABLE 62. SOUTH KOREA ROCK DRILLING EQUIPMENT MARKET, BY END-USE INDUSTRY, 2022-2032 ($MILLION)
- TABLE 63. AUSTRALIA ROCK DRILLING EQUIPMENT MARKET, BY PRODUCT, 2022-2032 ($MILLION)
- TABLE 64. AUSTRALIA ROCK DRILLING EQUIPMENT MARKET, BY MANUFACTURER, 2022-2032 ($MILLION)
- TABLE 65. AUSTRALIA ROCK DRILLING EQUIPMENT MARKET, BY END-USE INDUSTRY, 2022-2032 ($MILLION)
- TABLE 66. REST OF ASIA-PACIFIC ROCK DRILLING EQUIPMENT MARKET, BY PRODUCT, 2022-2032 ($MILLION)
- TABLE 67. REST OF ASIA-PACIFIC ROCK DRILLING EQUIPMENT MARKET, BY MANUFACTURER, 2022-2032 ($MILLION)
- TABLE 68. REST OF ASIA-PACIFIC ROCK DRILLING EQUIPMENT MARKET, BY END-USE INDUSTRY, 2022-2032 ($MILLION)
- TABLE 69. LAMEA ROCK DRILLING EQUIPMENT MARKET, BY PRODUCT, 2022-2032 ($MILLION)
- TABLE 70. LAMEA ROCK DRILLING EQUIPMENT MARKET, BY MANUFACTURER, 2022-2032 ($MILLION)
- TABLE 71. LAMEA ROCK DRILLING EQUIPMENT MARKET, BY END-USE INDUSTRY, 2022-2032 ($MILLION)
- TABLE 72. LAMEA ROCK DRILLING EQUIPMENT MARKET, BY COUNTRY, 2022-2032 ($MILLION)
- TABLE 73. BRAZIL ROCK DRILLING EQUIPMENT MARKET, BY PRODUCT, 2022-2032 ($MILLION)
- TABLE 74. BRAZIL ROCK DRILLING EQUIPMENT MARKET, BY MANUFACTURER, 2022-2032 ($MILLION)
- TABLE 75. BRAZIL ROCK DRILLING EQUIPMENT MARKET, BY END-USE INDUSTRY, 2022-2032 ($MILLION)
- TABLE 76. SAUDI ARABIA ROCK DRILLING EQUIPMENT MARKET, BY PRODUCT, 2022-2032 ($MILLION)
- TABLE 77. SAUDI ARABIA ROCK DRILLING EQUIPMENT MARKET, BY MANUFACTURER, 2022-2032 ($MILLION)
- TABLE 78. SAUDI ARABIA ROCK DRILLING EQUIPMENT MARKET, BY END-USE INDUSTRY, 2022-2032 ($MILLION)
- TABLE 79. UAE ROCK DRILLING EQUIPMENT MARKET, BY PRODUCT, 2022-2032 ($MILLION)
- TABLE 80. UAE ROCK DRILLING EQUIPMENT MARKET, BY MANUFACTURER, 2022-2032 ($MILLION)
- TABLE 81. UAE ROCK DRILLING EQUIPMENT MARKET, BY END-USE INDUSTRY, 2022-2032 ($MILLION)
- TABLE 82. SOUTH AFRICA ROCK DRILLING EQUIPMENT MARKET, BY PRODUCT, 2022-2032 ($MILLION)
- TABLE 83. SOUTH AFRICA ROCK DRILLING EQUIPMENT MARKET, BY MANUFACTURER, 2022-2032 ($MILLION)
- TABLE 84. SOUTH AFRICA ROCK DRILLING EQUIPMENT MARKET, BY END-USE INDUSTRY, 2022-2032 ($MILLION)
- TABLE 85. REST OF LAMEA ROCK DRILLING EQUIPMENT MARKET, BY PRODUCT, 2022-2032 ($MILLION)
- TABLE 86. REST OF LAMEA ROCK DRILLING EQUIPMENT MARKET, BY MANUFACTURER, 2022-2032 ($MILLION)
- TABLE 87. REST OF LAMEA ROCK DRILLING EQUIPMENT MARKET, BY END-USE INDUSTRY, 2022-2032 ($MILLION)
- TABLE 88. DRILL KING INTERNATIONAL.L.P: KEY EXECUTIVES
- TABLE 89. DRILL KING INTERNATIONAL.L.P: COMPANY SNAPSHOT
- TABLE 90. DRILL KING INTERNATIONAL.L.P: PRODUCT SEGMENTS
- TABLE 91. DRILL KING INTERNATIONAL.L.P: SERVICE SEGMENTS
- TABLE 92. DRILL KING INTERNATIONAL.L.P: PRODUCT PORTFOLIO
- TABLE 93. DRILL KING INTERNATIONAL.L.P: KEY STRATERGIES
- TABLE 94. EPIROC AB: KEY EXECUTIVES
- TABLE 95. EPIROC AB: COMPANY SNAPSHOT
- TABLE 96. EPIROC AB: PRODUCT SEGMENTS
- TABLE 97. EPIROC AB: SERVICE SEGMENTS
- TABLE 98. EPIROC AB: PRODUCT PORTFOLIO
- TABLE 99. EPIROC AB: KEY STRATERGIES
- TABLE 100. FURUKAWA ROCK DRILL: KEY EXECUTIVES
- TABLE 101. FURUKAWA ROCK DRILL: COMPANY SNAPSHOT
- TABLE 102. FURUKAWA ROCK DRILL: PRODUCT SEGMENTS
- TABLE 103. FURUKAWA ROCK DRILL: SERVICE SEGMENTS
- TABLE 104. FURUKAWA ROCK DRILL: PRODUCT PORTFOLIO
- TABLE 105. FURUKAWA ROCK DRILL: KEY STRATERGIES
- TABLE 106. GLOBAL MINING EQUIPMENTS: KEY EXECUTIVES
- TABLE 107. GLOBAL MINING EQUIPMENTS: COMPANY SNAPSHOT
- TABLE 108. GLOBAL MINING EQUIPMENTS: PRODUCT SEGMENTS
- TABLE 109. GLOBAL MINING EQUIPMENTS: SERVICE SEGMENTS
- TABLE 110. GLOBAL MINING EQUIPMENTS: PRODUCT PORTFOLIO
- TABLE 111. GLOBAL MINING EQUIPMENTS: KEY STRATERGIES
- TABLE 112. HOLTE MANUFACTURING: KEY EXECUTIVES
- TABLE 113. HOLTE MANUFACTURING: COMPANY SNAPSHOT
- TABLE 114. HOLTE MANUFACTURING: PRODUCT SEGMENTS
- TABLE 115. HOLTE MANUFACTURING: SERVICE SEGMENTS
- TABLE 116. HOLTE MANUFACTURING: PRODUCT PORTFOLIO
- TABLE 117. HOLTE MANUFACTURING: KEY STRATERGIES
- TABLE 118. MINCON GROUP PLC: KEY EXECUTIVES
- TABLE 119. MINCON GROUP PLC: COMPANY SNAPSHOT
- TABLE 120. MINCON GROUP PLC: PRODUCT SEGMENTS
- TABLE 121. MINCON GROUP PLC: SERVICE SEGMENTS
- TABLE 122. MINCON GROUP PLC: PRODUCT PORTFOLIO
- TABLE 123. MINCON GROUP PLC: KEY STRATERGIES
- TABLE 124. NUMA TOOL COMPANY: KEY EXECUTIVES
- TABLE 125. NUMA TOOL COMPANY: COMPANY SNAPSHOT
- TABLE 126. NUMA TOOL COMPANY: PRODUCT SEGMENTS
- TABLE 127. NUMA TOOL COMPANY: SERVICE SEGMENTS
- TABLE 128. NUMA TOOL COMPANY: PRODUCT PORTFOLIO
- TABLE 129. NUMA TOOL COMPANY: KEY STRATERGIES
- TABLE 130. ROCKMORE INTERNATIONAL,INC.: KEY EXECUTIVES
- TABLE 131. ROCKMORE INTERNATIONAL,INC.: COMPANY SNAPSHOT
- TABLE 132. ROCKMORE INTERNATIONAL,INC.: PRODUCT SEGMENTS
- TABLE 133. ROCKMORE INTERNATIONAL,INC.: SERVICE SEGMENTS
- TABLE 134. ROCKMORE INTERNATIONAL,INC.: PRODUCT PORTFOLIO
- TABLE 135. ROCKMORE INTERNATIONAL,INC.: KEY STRATERGIES
- TABLE 136. ROCK- TECH INTERNATIONAL: KEY EXECUTIVES
- TABLE 137. ROCK- TECH INTERNATIONAL: COMPANY SNAPSHOT
- TABLE 138. ROCK- TECH INTERNATIONAL: PRODUCT SEGMENTS
- TABLE 139. ROCK- TECH INTERNATIONAL: SERVICE SEGMENTS
- TABLE 140. ROCK- TECH INTERNATIONAL: PRODUCT PORTFOLIO
- TABLE 141. ROCK- TECH INTERNATIONAL: KEY STRATERGIES
- TABLE 142. SANDVIK AB: KEY EXECUTIVES
- TABLE 143. SANDVIK AB: COMPANY SNAPSHOT
- TABLE 144. SANDVIK AB: PRODUCT SEGMENTS
- TABLE 145. SANDVIK AB: SERVICE SEGMENTS
- TABLE 146. SANDVIK AB: PRODUCT PORTFOLIO
- TABLE 147. SANDVIK AB: KEY STRATERGIES
LIST OF FIGURES
- FIGURE 01. ROCK DRILLING EQUIPMENT MARKET, 2022-2032
- FIGURE 02. SEGMENTATION OF ROCK DRILLING EQUIPMENT MARKET,2022-2032
- FIGURE 03. TOP IMPACTING FACTORS IN ROCK DRILLING EQUIPMENT MARKET
- FIGURE 04. TOP INVESTMENT POCKETS IN ROCK DRILLING EQUIPMENT MARKET (2023-2032)
- FIGURE 05. BARGAINING POWER OF SUPPLIERS
- FIGURE 06. BARGAINING POWER OF BUYERS
- FIGURE 07. THREAT OF SUBSTITUTION
- FIGURE 08. THREAT OF SUBSTITUTION
- FIGURE 09. COMPETITIVE RIVALRY
- FIGURE 10. GLOBAL ROCK DRILLING EQUIPMENT MARKET:DRIVERS, RESTRAINTS AND OPPORTUNITIES
- FIGURE 11. IMPACT OF KEY REGULATION: ROCK DRILLING EQUIPMENT MARKET
- FIGURE 12. PATENT ANALYSIS BY COMPANY
- FIGURE 13. PATENT ANALYSIS BY COUNTRY
- FIGURE 14. ROCK DRILLING EQUIPMENT MARKET, BY PRODUCT, 2022 AND 2032(%)
- FIGURE 15. COMPARATIVE SHARE ANALYSIS OF ROCK DRILLING EQUIPMENT MARKET FOR MEDIUM-SIZED, BY COUNTRY 2022 AND 2032(%)
- FIGURE 16. COMPARATIVE SHARE ANALYSIS OF ROCK DRILLING EQUIPMENT MARKET FOR LARGE-SIZED, BY COUNTRY 2022 AND 2032(%)
- FIGURE 17. COMPARATIVE SHARE ANALYSIS OF ROCK DRILLING EQUIPMENT MARKET FOR HEAVY-SIZED, BY COUNTRY 2022 AND 2032(%)
- FIGURE 18. ROCK DRILLING EQUIPMENT MARKET, BY MANUFACTURER, 2022 AND 2032(%)
- FIGURE 19. COMPARATIVE SHARE ANALYSIS OF ROCK DRILLING EQUIPMENT MARKET FOR OEM, BY COUNTRY 2022 AND 2032(%)
- FIGURE 20. COMPARATIVE SHARE ANALYSIS OF ROCK DRILLING EQUIPMENT MARKET FOR AFTERMARKET, BY COUNTRY 2022 AND 2032(%)
- FIGURE 21. ROCK DRILLING EQUIPMENT MARKET, BY END-USE INDUSTRY, 2022 AND 2032(%)
- FIGURE 22. COMPARATIVE SHARE ANALYSIS OF ROCK DRILLING EQUIPMENT MARKET FOR MINING, BY COUNTRY 2022 AND 2032(%)
- FIGURE 23. COMPARATIVE SHARE ANALYSIS OF ROCK DRILLING EQUIPMENT MARKET FOR CONSTRUCTION, BY COUNTRY 2022 AND 2032(%)
- FIGURE 24. ROCK DRILLING EQUIPMENT MARKET BY REGION, 2022 AND 2032(%)
- FIGURE 25. U.S. ROCK DRILLING EQUIPMENT MARKET, 2022-2032 ($MILLION)
- FIGURE 26. CANADA ROCK DRILLING EQUIPMENT MARKET, 2022-2032 ($MILLION)
- FIGURE 27. MEXICO ROCK DRILLING EQUIPMENT MARKET, 2022-2032 ($MILLION)
- FIGURE 28. GERMANY ROCK DRILLING EQUIPMENT MARKET, 2022-2032 ($MILLION)
- FIGURE 29. UK ROCK DRILLING EQUIPMENT MARKET, 2022-2032 ($MILLION)
- FIGURE 30. FRANCE ROCK DRILLING EQUIPMENT MARKET, 2022-2032 ($MILLION)
- FIGURE 31. SPAIN ROCK DRILLING EQUIPMENT MARKET, 2022-2032 ($MILLION)
- FIGURE 32. ITALY ROCK DRILLING EQUIPMENT MARKET, 2022-2032 ($MILLION)
- FIGURE 33. REST OF EUROPE ROCK DRILLING EQUIPMENT MARKET, 2022-2032 ($MILLION)
- FIGURE 34. CHINA ROCK DRILLING EQUIPMENT MARKET, 2022-2032 ($MILLION)
- FIGURE 35. JAPAN ROCK DRILLING EQUIPMENT MARKET, 2022-2032 ($MILLION)
- FIGURE 36. INDIA ROCK DRILLING EQUIPMENT MARKET, 2022-2032 ($MILLION)
- FIGURE 37. SOUTH KOREA ROCK DRILLING EQUIPMENT MARKET, 2022-2032 ($MILLION)
- FIGURE 38. AUSTRALIA ROCK DRILLING EQUIPMENT MARKET, 2022-2032 ($MILLION)
- FIGURE 39. REST OF ASIA-PACIFIC ROCK DRILLING EQUIPMENT MARKET, 2022-2032 ($MILLION)
- FIGURE 40. BRAZIL ROCK DRILLING EQUIPMENT MARKET, 2022-2032 ($MILLION)
- FIGURE 41. SAUDI ARABIA ROCK DRILLING EQUIPMENT MARKET, 2022-2032 ($MILLION)
- FIGURE 42. UAE ROCK DRILLING EQUIPMENT MARKET, 2022-2032 ($MILLION)
- FIGURE 43. SOUTH AFRICA ROCK DRILLING EQUIPMENT MARKET, 2022-2032 ($MILLION)
- FIGURE 44. REST OF LAMEA ROCK DRILLING EQUIPMENT MARKET, 2022-2032 ($MILLION)
- FIGURE 45. TOP WINNING STRATEGIES, BY YEAR
- FIGURE 46. TOP WINNING STRATEGIES, BY DEVELOPMENT
- FIGURE 47. TOP WINNING STRATEGIES, BY COMPANY
- FIGURE 48. PRODUCT MAPPING OF TOP 10 PLAYERS
- FIGURE 49. COMPETITIVE DASHBOARD
- FIGURE 50. COMPETITIVE HEATMAP: ROCK DRILLING EQUIPMENT MARKET
- FIGURE 51. TOP PLAYER POSITIONING, 2022
 PCB机器式钻孔机的全球市场:实际成果·预测 (2019~2030年)
 PCB雷射钻孔机的全球市场:实际成果·预测 (2019~2030年)
 全球钻井工具市场评估:按类型、地点、地区、机会、预测(2017-2031)
 Trencher附件报告:2030 年趋势、预测与竞争分析
 螺旋钻探市场:按类型、结构、设计、安装、应用、最终用户分类 - 全球预测 2024-2030
 土孔螺旋钻市场:按类型、按设计、按最终用途行业、按销售管道、按地区
 海上钻井隔水管市场 - 2019-2029 年按类型、按应用、地区和竞争细分的全球行业规模、份额、趋势、机会和预测
 全球爆破孔钻机市场:按类型、驱动方法、动力传输方法、钻孔方法、应用分类 - 2023-2030 年预测
 全球太阳能雷射钻孔市场:按电池类型、雷射类型 - 机会分析与产业预测(2023-2032)
 动臂式隧道钻掘机的全球市场:2023年