


 |
市场调查报告书
商品编码
1472189
放大器市场:按类型、材料和最终用户分类:2023-2032 年全球机会分析和行业预测Power Amplifier Market By Type, By Material, By End User : Global Opportunity Analysis and Industry Forecast, 2023-2032 |
||||||
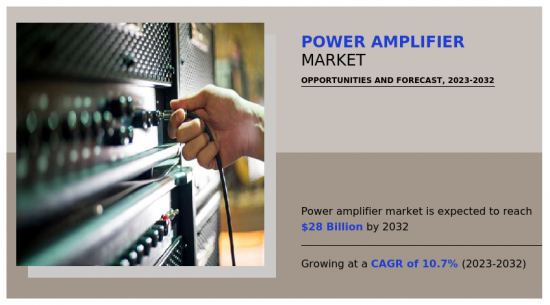
2022年全球放大器市场规模为101.8亿美元,预计2032年将达280亿美元,2023年至2032年复合年增长率为10.72%。
放大器是一种增加电讯号幅度或功率等级的电子设备。放大器通常用于音讯系统、RF(射频)发射器和各种其他应用,可将低功率讯号放大到适合驱动扬声器、天线和其他负载的高功率等级。放大器在提高讯号强度和清晰度以及在远距或充满挑战的环境中有效传输或再现音讯、资料和无线讯号方面发挥关键作用。
放大器是透过一系列製造步骤创建的,这些步骤选择适当的电子元件,例如电晶体、电容器和电阻器。这些组件使用自动化机械和技术组装到印刷电路基板(PCB) 上,然后进行严格的测试和品管措施,以确保最佳的性能和可靠性。
放大器用于多种行业和应用。它应用于多种领域,包括娱乐设施、通讯、医疗设备、汽车技术和工业机械。这些应用包括音讯系统、射频传输、医疗设备、汽车电子、工业自动化等等,使得放大器广泛应用于各个领域。
由于 Wi-Fi、蓝牙和其他无线通讯的使用不断增加,放大器市场正在经历显着增长。随着越来越多的设备依赖无线连接来实现无缝通讯,对放大器来增强讯号传输和接收的需求日益增长。 Wi-Fi 促进各种装置之间的网路访问,而蓝牙则支援耳机和扬声器等周边设备之间的无线连接。此外,Zigbee 和 Z-Wave 等新无线通讯协定对于物联网生态系统至关重要。无线技术采用的激增凸显了放大器的关键作用,并推动了其在各种领域和应用中的需求。
放大器所需的高材料成本和先进技术透过增加製造成本限制了市场成长。这种成本障碍可能会限制市场进入,尤其是在价格敏感领域,并阻碍普及和市场扩张。
放大器市场的主要目标是为通讯、消费性电子、汽车和航太等各行业开发并提供高效、可靠、高性能的放大解决方案。这包括提高功率效率、线性度和频宽,同时降低外形尺寸和成本的先进技术。满足客户对改善连结、讯号强度和音质的需求推动创新和市场竞争。最终目标是提供能够实现电子设备和系统无缝运作的放大解决方案。
放大器市场按类型、材料、最终用户和地区进行细分。依类型分为音讯放大器、射频放大器和线性放大器。依材质分为硅锗(SiGe)、氮化镓(GaN)、砷化镓(GaAs)。依最终用户分为家电、汽车、军事/国防、通讯等。
依地区划分,北美(美国、加拿大、墨西哥)、欧洲(英国、德国、法国其他欧洲国家地区)、亚太地区(中国、日本、印度、韩国等亚太地区)、及中南美洲(巴西、阿根廷,分析分为其他亚太地区)、中东和非洲地区。
可以自订此报告(需要额外的费用和时间表)
- 产品生命週期
- 新产品开发/主要企业产品矩阵
- 根据客户兴趣新增其他公司简介
- 按国家或地区进行的附加分析 – 市场规模和预测
- 公司简介的扩充列表
- 主要参与者的详细资料(Excel格式,包括位置、联络资讯、供应商/供应商网路等)
- SWOT分析
目录
第一章简介
第 2 章执行摘要
第三章市场概况
- 市场定义和范围
- 主要发现
- 影响因素
- 主要投资机会
- 波特五力分析
- 市场动态
- 促进因素
- 抑制因素
- 机会
第四章放大器市场:按类型
- 概述
- 音讯放大器
- 射频 (RF)放大器
- 线性放大器
第五章放大器市场:依材料分类
- 概述
- 硅锗 (SiGe)
- 氮化镓(GaN)
- 砷化镓 (GaAs)
第六章放大器市场:依最终用户分类
- 概述
- 消费性电子产品
- 卫生保健
- 航太/国防
- 通讯
- 其他(汽车、能源/电力、石油/天然气)
第七章放大器市场:按地区
- 概述
- 北美洲
- 美国
- 加拿大
- 墨西哥
- 欧洲
- 英国
- 德国
- 法国
- 其他的
- 亚太地区
- 中国
- 日本
- 印度
- 韩国
- 其他的
- 拉丁美洲
- 巴西
- 阿根廷
- 其他拉丁美洲
- 中东/非洲
- 沙乌地阿拉伯
- 南非
- 其他中东/非洲
第八章 竞争格局
- 介绍
- 关键成功策略
- 10家主要企业产品图谱
- 竞争对手仪表板
- 竞争热图
- 2022年主要企业定位
第九章 公司简介
- Texas Instruments Inc.
- Infineon Technologies AG
- NXP Semiconductors NV
- Analog Devices, Inc
- STMicroelectronics NV
- Toshiba Corporation
- Renesas Electronics Corporation.
- Skyworks Solutions, Inc.
- Broadcom Inc.
- Qualcomm Incorporated.
The Global Power Amplifier Market was valued at $10.18 billion in 2022 and is estimated to reach $28 billion by 2032, exhibiting a CAGR of 10.72% from 2023 to 2032.
A power amplifier is an electronic device that increases the amplitude or power level of an electrical signal. Typically used in audio systems, RF (radio frequency) transmitters, and various other applications, power amplifiers take a low-power signal and amplify it to a higher power level suitable for driving speakers, antennas, or other loads. They play a crucial role in enhancing the strength and clarity of signals, ensuring efficient transmission or reproduction of audio, data, or radio signals over long distances or through challenging environments.
Power amplifiers are made through a series of manufacturing processes involving the selection of appropriate electronic components such as transistors, capacitors, and resistors. These components are assembled onto printed circuit boards (PCBs) using automated machinery and techniques, followed by rigorous testing and quality control measures to ensure optimal performance and reliability.
Power amplifiers are utilized in a diverse range of industries and applications. They serve various sectors including entertainment venues, telecommunications, medical equipment, automotive technology, and industrial machinery. These applications include audio systems, RF transmission, medical devices, automotive electronics, and industrial automation, highlighting the widespread utility of power amplifiers across multiple sectors.
The power amplifier market is experiencing significant growth due to increased usage of Wi-Fi, Bluetooth, and other wireless communication. With more devices relying on wireless connectivity for seamless communication, there is rise in need for power amplifiers to enhance signal transmission and reception. Wi-Fi facilitates internet access across diverse devices, while Bluetooth enables wireless links between peripherals such as headphones and speakers. In addition, emerging wireless protocols like Zigbee and Z-Wave are vital for IoT ecosystems. This surge in wireless tech adoption highlights the essential role of power amplifiers, propelling their demand across different sectors and applications.
High cost of materials and advanced technologies required for power amplifiers limit the market growth by increasing production expenses. This cost barrier can restrict market accessibility, particularly in price-sensitive segments, hindering widespread adoption and market expansion.
The primary goal of the power amplifier market is to develop and deliver efficient, reliable, and high-performance amplification solutions across various industries such as telecommunications, consumer electronics, automotive, and aerospace. This involves advancing technologies to enhance power efficiency, linearity, and bandwidth while reducing form factor and cost. Meeting customer demands for improved connectivity, signal strength, and audio quality drives innovation and market competitiveness. Ultimately, the goal is to provide amplification solutions that enable the seamless operation of electronic devices and systems.
The power amplifier market is segmented on the basis of type, material, end user, and region. By type, the market is classified into audio power amplifiers, radio frequency (RF) power amplifiers, and linear power amplifiers. By material, the market is segmented into silicon germanium (SiGe), gallium nitride (GaN), and gallium arsenide (GaAs). By end user, the market is classified into consumer electronics, automotive, military & defense, telecommunication, and others.
By region, it is analyzed across North America (the U.S., Canada, and Mexico), Europe (UK, Germany, France, and rest of Europe), Asia-Pacific (China, Japan, India, South Korea, and rest of Asia-Pacific), Latin America (Brazil, Argentina, and rest of Latin America), and Middle East and Africa (Saudi Arabia, South Africa, and Rest of MEA).
Competitive analysis and profiles of the major power amplifier market players, such as Texas Instruments Inc, Infineon Technologies AG, NXP Semiconductors N.V., Analog Devices, Inc, STMicroelectronics N.V., Toshiba Corporation, Maxim Integrated Products, Inc., Skyworks Solutions, Inc., Broadcom Inc., and Qualcomm Incorporated. are provided in this report. Business strategies such as product launch, acquisition and partnership were adopted by the major market players in 2022.
Additional benefits you will get with this purchase are:
- Quarterly Update and* (only available with a corporate license, on listed price)
- 5 additional Company Profile of client Choice pre- or Post-purchase, as a free update.
- Free Upcoming Version on the Purchase of Five and Enterprise User License.
- 16 analyst hours of support* (post-purchase, if you find additional data requirements upon review of the report, you may receive support amounting to 16 analyst hours to solve questions, and post-sale queries)
- 15% Free Customization* (in case the scope or segment of the report does not match your requirements, 15% is equivalent to 3 working days of free work, applicable once)
- Free data Pack on the Five and Enterprise User License. (Excel version of the report)
- Free Updated report if the report is 6-12 months old or older.
- 24-hour priority response*
- Free Industry updates and white papers.
Possible Customization with this report (with additional cost and timeline, please talk to the sales executive to know more)
- Product Life Cycles
- New Product Development/ Product Matrix of Key Players
- Additional company profiles with specific to client's interest
- Additional country or region analysis- market size and forecast
- Expanded list for Company Profiles
- Key player details (including location, contact details, supplier/vendor network etc. in excel format)
- SWOT Analysis
Key Market Segments
By Type
- Audio Power Amplifier
- Radio Frequency (RF) Power Amplifier
- Linear Power Amplifier
By Material
- Gallium Nitride (GaN)
- Gallium Arsenide (GaAs)
- Silicon Germanium (SiGe)
By End User
- Consumer Electronics
- Healthcare
- Aerospace and Defense
- Telecommunication
- Others (Automotive, Energy and power and Oil and Gas)
By Region
- North America
- U.S.
- Canada
- Mexico
- Europe
- UK
- Germany
- France
- Rest of Europe
- Asia-Pacific
- China
- Japan
- India
- South Korea
- Rest of Asia-Pacific
- Latin America
- Brazil
- Argentina
- Rest of Latin America
- Middle East and Africa
- Saudi Arabia
- South Africa
- Rest of Middle East And Africa
Key Market Players:
- Texas Instruments Inc.
- Infineon Technologies AG
- NXP Semiconductors N.V.
- Analog Devices, Inc
- STMicroelectronics N.V.
- Toshiba Corporation
- Renesas Electronics Corporation.
- Skyworks Solutions, Inc.
- Broadcom Inc.
- Qualcomm Incorporated.
TABLE OF CONTENTS
CHAPTER 1: INTRODUCTION
- 1.1. Report description
- 1.2. Key market segments
- 1.3. Key benefits to the stakeholders
- 1.4. Research methodology
- 1.4.1. Primary research
- 1.4.2. Secondary research
- 1.4.3. Analyst tools and models
CHAPTER 2: EXECUTIVE SUMMARY
- 2.1. CXO perspective
CHAPTER 3: MARKET OVERVIEW
- 3.1. Market definition and scope
- 3.2. Key findings
- 3.2.1. Top impacting factors
- 3.2.2. Top investment pockets
- 3.3. Porter's five forces analysis
- 3.4. Market dynamics
- 3.4.1. Drivers
- 3.4.2. Restraints
- 3.4.3. Opportunities
CHAPTER 4: POWER AMPLIFIER MARKET, BY TYPE
- 4.1. Overview
- 4.1.1. Market size and forecast
- 4.2. Audio Power Amplifier
- 4.2.1. Key market trends, growth factors and opportunities
- 4.2.2. Market size and forecast, by region
- 4.2.3. Market share analysis by country
- 4.3. Radio Frequency (RF) Power Amplifier
- 4.3.1. Key market trends, growth factors and opportunities
- 4.3.2. Market size and forecast, by region
- 4.3.3. Market share analysis by country
- 4.4. Linear Power Amplifier
- 4.4.1. Key market trends, growth factors and opportunities
- 4.4.2. Market size and forecast, by region
- 4.4.3. Market share analysis by country
CHAPTER 5: POWER AMPLIFIER MARKET, BY MATERIAL
- 5.1. Overview
- 5.1.1. Market size and forecast
- 5.2. Silicon Germanium (SiGe)
- 5.2.1. Key market trends, growth factors and opportunities
- 5.2.2. Market size and forecast, by region
- 5.2.3. Market share analysis by country
- 5.3. Gallium Nitride (GaN)
- 5.3.1. Key market trends, growth factors and opportunities
- 5.3.2. Market size and forecast, by region
- 5.3.3. Market share analysis by country
- 5.4. Gallium Arsenide (GaAs)
- 5.4.1. Key market trends, growth factors and opportunities
- 5.4.2. Market size and forecast, by region
- 5.4.3. Market share analysis by country
CHAPTER 6: POWER AMPLIFIER MARKET, BY END USER
- 6.1. Overview
- 6.1.1. Market size and forecast
- 6.2. Consumer Electronics
- 6.2.1. Key market trends, growth factors and opportunities
- 6.2.2. Market size and forecast, by region
- 6.2.3. Market share analysis by country
- 6.3. Healthcare
- 6.3.1. Key market trends, growth factors and opportunities
- 6.3.2. Market size and forecast, by region
- 6.3.3. Market share analysis by country
- 6.4. Aerospace and Defense
- 6.4.1. Key market trends, growth factors and opportunities
- 6.4.2. Market size and forecast, by region
- 6.4.3. Market share analysis by country
- 6.5. Telecommunication
- 6.5.1. Key market trends, growth factors and opportunities
- 6.5.2. Market size and forecast, by region
- 6.5.3. Market share analysis by country
- 6.6. Others (Automotive, Energy and power and Oil and Gas)
- 6.6.1. Key market trends, growth factors and opportunities
- 6.6.2. Market size and forecast, by region
- 6.6.3. Market share analysis by country
CHAPTER 7: POWER AMPLIFIER MARKET, BY REGION
- 7.1. Overview
- 7.1.1. Market size and forecast By Region
- 7.2. North America
- 7.2.1. Key market trends, growth factors and opportunities
- 7.2.2. Market size and forecast, by Type
- 7.2.3. Market size and forecast, by Material
- 7.2.4. Market size and forecast, by End User
- 7.2.5. Market size and forecast, by country
- 7.2.5.1. U.S.
- 7.2.5.1.1. Market size and forecast, by Type
- 7.2.5.1.2. Market size and forecast, by Material
- 7.2.5.1.3. Market size and forecast, by End User
- 7.2.5.2. Canada
- 7.2.5.2.1. Market size and forecast, by Type
- 7.2.5.2.2. Market size and forecast, by Material
- 7.2.5.2.3. Market size and forecast, by End User
- 7.2.5.3. Mexico
- 7.2.5.3.1. Market size and forecast, by Type
- 7.2.5.3.2. Market size and forecast, by Material
- 7.2.5.3.3. Market size and forecast, by End User
- 7.3. Europe
- 7.3.1. Key market trends, growth factors and opportunities
- 7.3.2. Market size and forecast, by Type
- 7.3.3. Market size and forecast, by Material
- 7.3.4. Market size and forecast, by End User
- 7.3.5. Market size and forecast, by country
- 7.3.5.1. UK
- 7.3.5.1.1. Market size and forecast, by Type
- 7.3.5.1.2. Market size and forecast, by Material
- 7.3.5.1.3. Market size and forecast, by End User
- 7.3.5.2. Germany
- 7.3.5.2.1. Market size and forecast, by Type
- 7.3.5.2.2. Market size and forecast, by Material
- 7.3.5.2.3. Market size and forecast, by End User
- 7.3.5.3. France
- 7.3.5.3.1. Market size and forecast, by Type
- 7.3.5.3.2. Market size and forecast, by Material
- 7.3.5.3.3. Market size and forecast, by End User
- 7.3.5.4. Rest of Europe
- 7.3.5.4.1. Market size and forecast, by Type
- 7.3.5.4.2. Market size and forecast, by Material
- 7.3.5.4.3. Market size and forecast, by End User
- 7.4. Asia-Pacific
- 7.4.1. Key market trends, growth factors and opportunities
- 7.4.2. Market size and forecast, by Type
- 7.4.3. Market size and forecast, by Material
- 7.4.4. Market size and forecast, by End User
- 7.4.5. Market size and forecast, by country
- 7.4.5.1. China
- 7.4.5.1.1. Market size and forecast, by Type
- 7.4.5.1.2. Market size and forecast, by Material
- 7.4.5.1.3. Market size and forecast, by End User
- 7.4.5.2. Japan
- 7.4.5.2.1. Market size and forecast, by Type
- 7.4.5.2.2. Market size and forecast, by Material
- 7.4.5.2.3. Market size and forecast, by End User
- 7.4.5.3. India
- 7.4.5.3.1. Market size and forecast, by Type
- 7.4.5.3.2. Market size and forecast, by Material
- 7.4.5.3.3. Market size and forecast, by End User
- 7.4.5.4. South Korea
- 7.4.5.4.1. Market size and forecast, by Type
- 7.4.5.4.2. Market size and forecast, by Material
- 7.4.5.4.3. Market size and forecast, by End User
- 7.4.5.5. Rest of Asia-Pacific
- 7.4.5.5.1. Market size and forecast, by Type
- 7.4.5.5.2. Market size and forecast, by Material
- 7.4.5.5.3. Market size and forecast, by End User
- 7.5. Latin America
- 7.5.1. Key market trends, growth factors and opportunities
- 7.5.2. Market size and forecast, by Type
- 7.5.3. Market size and forecast, by Material
- 7.5.4. Market size and forecast, by End User
- 7.5.5. Market size and forecast, by country
- 7.5.5.1. Brazil
- 7.5.5.1.1. Market size and forecast, by Type
- 7.5.5.1.2. Market size and forecast, by Material
- 7.5.5.1.3. Market size and forecast, by End User
- 7.5.5.2. Argentina
- 7.5.5.2.1. Market size and forecast, by Type
- 7.5.5.2.2. Market size and forecast, by Material
- 7.5.5.2.3. Market size and forecast, by End User
- 7.5.5.3. Rest of Latin America
- 7.5.5.3.1. Market size and forecast, by Type
- 7.5.5.3.2. Market size and forecast, by Material
- 7.5.5.3.3. Market size and forecast, by End User
- 7.6. Middle East and Africa
- 7.6.1. Key market trends, growth factors and opportunities
- 7.6.2. Market size and forecast, by Type
- 7.6.3. Market size and forecast, by Material
- 7.6.4. Market size and forecast, by End User
- 7.6.5. Market size and forecast, by country
- 7.6.5.1. Saudi Arabia
- 7.6.5.1.1. Market size and forecast, by Type
- 7.6.5.1.2. Market size and forecast, by Material
- 7.6.5.1.3. Market size and forecast, by End User
- 7.6.5.2. South Africa
- 7.6.5.2.1. Market size and forecast, by Type
- 7.6.5.2.2. Market size and forecast, by Material
- 7.6.5.2.3. Market size and forecast, by End User
- 7.6.5.3. Rest of Middle East And Africa
- 7.6.5.3.1. Market size and forecast, by Type
- 7.6.5.3.2. Market size and forecast, by Material
- 7.6.5.3.3. Market size and forecast, by End User
CHAPTER 8: COMPETITIVE LANDSCAPE
- 8.1. Introduction
- 8.2. Top winning strategies
- 8.3. Product mapping of top 10 player
- 8.4. Competitive dashboard
- 8.5. Competitive heatmap
- 8.6. Top player positioning, 2022
CHAPTER 9: COMPANY PROFILES
- 9.1. Texas Instruments Inc.
- 9.1.1. Company overview
- 9.1.2. Key executives
- 9.1.3. Company snapshot
- 9.1.4. Operating business segments
- 9.1.5. Product portfolio
- 9.1.6. Business performance
- 9.1.7. Key strategic moves and developments
- 9.2. Infineon Technologies AG
- 9.2.1. Company overview
- 9.2.2. Key executives
- 9.2.3. Company snapshot
- 9.2.4. Operating business segments
- 9.2.5. Product portfolio
- 9.2.6. Business performance
- 9.2.7. Key strategic moves and developments
- 9.3. NXP Semiconductors N.V.
- 9.3.1. Company overview
- 9.3.2. Key executives
- 9.3.3. Company snapshot
- 9.3.4. Operating business segments
- 9.3.5. Product portfolio
- 9.3.6. Business performance
- 9.3.7. Key strategic moves and developments
- 9.4. Analog Devices, Inc
- 9.4.1. Company overview
- 9.4.2. Key executives
- 9.4.3. Company snapshot
- 9.4.4. Operating business segments
- 9.4.5. Product portfolio
- 9.4.6. Business performance
- 9.4.7. Key strategic moves and developments
- 9.5. STMicroelectronics N.V.
- 9.5.1. Company overview
- 9.5.2. Key executives
- 9.5.3. Company snapshot
- 9.5.4. Operating business segments
- 9.5.5. Product portfolio
- 9.5.6. Business performance
- 9.5.7. Key strategic moves and developments
- 9.6. Toshiba Corporation
- 9.6.1. Company overview
- 9.6.2. Key executives
- 9.6.3. Company snapshot
- 9.6.4. Operating business segments
- 9.6.5. Product portfolio
- 9.6.6. Business performance
- 9.6.7. Key strategic moves and developments
- 9.7. Renesas Electronics Corporation.
- 9.7.1. Company overview
- 9.7.2. Key executives
- 9.7.3. Company snapshot
- 9.7.4. Operating business segments
- 9.7.5. Product portfolio
- 9.7.6. Business performance
- 9.7.7. Key strategic moves and developments
- 9.8. Skyworks Solutions, Inc.
- 9.8.1. Company overview
- 9.8.2. Key executives
- 9.8.3. Company snapshot
- 9.8.4. Operating business segments
- 9.8.5. Product portfolio
- 9.8.6. Business performance
- 9.8.7. Key strategic moves and developments
- 9.9. Broadcom Inc.
- 9.9.1. Company overview
- 9.9.2. Key executives
- 9.9.3. Company snapshot
- 9.9.4. Operating business segments
- 9.9.5. Product portfolio
- 9.9.6. Business performance
- 9.9.7. Key strategic moves and developments
- 9.10. Qualcomm Incorporated.
- 9.10.1. Company overview
- 9.10.2. Key executives
- 9.10.3. Company snapshot
- 9.10.4. Operating business segments
- 9.10.5. Product portfolio
- 9.10.6. Business performance
- 9.10.7. Key strategic moves and developments
LIST OF TABLES
- TABLE 01. GLOBAL POWER AMPLIFIER MARKET, BY TYPE, 2022-2032 ($MILLION)
- TABLE 02. POWER AMPLIFIER MARKET FOR AUDIO POWER AMPLIFIER, BY REGION, 2022-2032 ($MILLION)
- TABLE 03. POWER AMPLIFIER MARKET FOR RADIO FREQUENCY (RF) POWER AMPLIFIER, BY REGION, 2022-2032 ($MILLION)
- TABLE 04. POWER AMPLIFIER MARKET FOR LINEAR POWER AMPLIFIER, BY REGION, 2022-2032 ($MILLION)
- TABLE 05. GLOBAL POWER AMPLIFIER MARKET, BY MATERIAL, 2022-2032 ($MILLION)
- TABLE 06. POWER AMPLIFIER MARKET FOR SILICON GERMANIUM (SIGE), BY REGION, 2022-2032 ($MILLION)
- TABLE 07. POWER AMPLIFIER MARKET FOR GALLIUM NITRIDE (GAN), BY REGION, 2022-2032 ($MILLION)
- TABLE 08. POWER AMPLIFIER MARKET FOR GALLIUM ARSENIDE (GAAS), BY REGION, 2022-2032 ($MILLION)
- TABLE 09. GLOBAL POWER AMPLIFIER MARKET, BY END USER, 2022-2032 ($MILLION)
- TABLE 10. POWER AMPLIFIER MARKET FOR CONSUMER ELECTRONICS, BY REGION, 2022-2032 ($MILLION)
- TABLE 11. POWER AMPLIFIER MARKET FOR HEALTHCARE, BY REGION, 2022-2032 ($MILLION)
- TABLE 12. POWER AMPLIFIER MARKET FOR AEROSPACE AND DEFENSE, BY REGION, 2022-2032 ($MILLION)
- TABLE 13. POWER AMPLIFIER MARKET FOR TELECOMMUNICATION, BY REGION, 2022-2032 ($MILLION)
- TABLE 14. POWER AMPLIFIER MARKET FOR OTHERS (AUTOMOTIVE, ENERGY AND POWER AND OIL AND GAS), BY REGION, 2022-2032 ($MILLION)
- TABLE 15. POWER AMPLIFIER MARKET, BY REGION, 2022-2032 ($MILLION)
- TABLE 16. NORTH AMERICA POWER AMPLIFIER MARKET, BY TYPE, 2022-2032 ($MILLION)
- TABLE 17. NORTH AMERICA POWER AMPLIFIER MARKET, BY MATERIAL, 2022-2032 ($MILLION)
- TABLE 18. NORTH AMERICA POWER AMPLIFIER MARKET, BY END USER, 2022-2032 ($MILLION)
- TABLE 19. NORTH AMERICA POWER AMPLIFIER MARKET, BY COUNTRY, 2022-2032 ($MILLION)
- TABLE 20. U.S. POWER AMPLIFIER MARKET, BY TYPE, 2022-2032 ($MILLION)
- TABLE 21. U.S. POWER AMPLIFIER MARKET, BY MATERIAL, 2022-2032 ($MILLION)
- TABLE 22. U.S. POWER AMPLIFIER MARKET, BY END USER, 2022-2032 ($MILLION)
- TABLE 23. CANADA POWER AMPLIFIER MARKET, BY TYPE, 2022-2032 ($MILLION)
- TABLE 24. CANADA POWER AMPLIFIER MARKET, BY MATERIAL, 2022-2032 ($MILLION)
- TABLE 25. CANADA POWER AMPLIFIER MARKET, BY END USER, 2022-2032 ($MILLION)
- TABLE 26. MEXICO POWER AMPLIFIER MARKET, BY TYPE, 2022-2032 ($MILLION)
- TABLE 27. MEXICO POWER AMPLIFIER MARKET, BY MATERIAL, 2022-2032 ($MILLION)
- TABLE 28. MEXICO POWER AMPLIFIER MARKET, BY END USER, 2022-2032 ($MILLION)
- TABLE 29. EUROPE POWER AMPLIFIER MARKET, BY TYPE, 2022-2032 ($MILLION)
- TABLE 30. EUROPE POWER AMPLIFIER MARKET, BY MATERIAL, 2022-2032 ($MILLION)
- TABLE 31. EUROPE POWER AMPLIFIER MARKET, BY END USER, 2022-2032 ($MILLION)
- TABLE 32. EUROPE POWER AMPLIFIER MARKET, BY COUNTRY, 2022-2032 ($MILLION)
- TABLE 33. UK POWER AMPLIFIER MARKET, BY TYPE, 2022-2032 ($MILLION)
- TABLE 34. UK POWER AMPLIFIER MARKET, BY MATERIAL, 2022-2032 ($MILLION)
- TABLE 35. UK POWER AMPLIFIER MARKET, BY END USER, 2022-2032 ($MILLION)
- TABLE 36. GERMANY POWER AMPLIFIER MARKET, BY TYPE, 2022-2032 ($MILLION)
- TABLE 37. GERMANY POWER AMPLIFIER MARKET, BY MATERIAL, 2022-2032 ($MILLION)
- TABLE 38. GERMANY POWER AMPLIFIER MARKET, BY END USER, 2022-2032 ($MILLION)
- TABLE 39. FRANCE POWER AMPLIFIER MARKET, BY TYPE, 2022-2032 ($MILLION)
- TABLE 40. FRANCE POWER AMPLIFIER MARKET, BY MATERIAL, 2022-2032 ($MILLION)
- TABLE 41. FRANCE POWER AMPLIFIER MARKET, BY END USER, 2022-2032 ($MILLION)
- TABLE 42. REST OF EUROPE POWER AMPLIFIER MARKET, BY TYPE, 2022-2032 ($MILLION)
- TABLE 43. REST OF EUROPE POWER AMPLIFIER MARKET, BY MATERIAL, 2022-2032 ($MILLION)
- TABLE 44. REST OF EUROPE POWER AMPLIFIER MARKET, BY END USER, 2022-2032 ($MILLION)
- TABLE 45. ASIA-PACIFIC POWER AMPLIFIER MARKET, BY TYPE, 2022-2032 ($MILLION)
- TABLE 46. ASIA-PACIFIC POWER AMPLIFIER MARKET, BY MATERIAL, 2022-2032 ($MILLION)
- TABLE 47. ASIA-PACIFIC POWER AMPLIFIER MARKET, BY END USER, 2022-2032 ($MILLION)
- TABLE 48. ASIA-PACIFIC POWER AMPLIFIER MARKET, BY COUNTRY, 2022-2032 ($MILLION)
- TABLE 49. CHINA POWER AMPLIFIER MARKET, BY TYPE, 2022-2032 ($MILLION)
- TABLE 50. CHINA POWER AMPLIFIER MARKET, BY MATERIAL, 2022-2032 ($MILLION)
- TABLE 51. CHINA POWER AMPLIFIER MARKET, BY END USER, 2022-2032 ($MILLION)
- TABLE 52. JAPAN POWER AMPLIFIER MARKET, BY TYPE, 2022-2032 ($MILLION)
- TABLE 53. JAPAN POWER AMPLIFIER MARKET, BY MATERIAL, 2022-2032 ($MILLION)
- TABLE 54. JAPAN POWER AMPLIFIER MARKET, BY END USER, 2022-2032 ($MILLION)
- TABLE 55. INDIA POWER AMPLIFIER MARKET, BY TYPE, 2022-2032 ($MILLION)
- TABLE 56. INDIA POWER AMPLIFIER MARKET, BY MATERIAL, 2022-2032 ($MILLION)
- TABLE 57. INDIA POWER AMPLIFIER MARKET, BY END USER, 2022-2032 ($MILLION)
- TABLE 58. SOUTH KOREA POWER AMPLIFIER MARKET, BY TYPE, 2022-2032 ($MILLION)
- TABLE 59. SOUTH KOREA POWER AMPLIFIER MARKET, BY MATERIAL, 2022-2032 ($MILLION)
- TABLE 60. SOUTH KOREA POWER AMPLIFIER MARKET, BY END USER, 2022-2032 ($MILLION)
- TABLE 61. REST OF ASIA-PACIFIC POWER AMPLIFIER MARKET, BY TYPE, 2022-2032 ($MILLION)
- TABLE 62. REST OF ASIA-PACIFIC POWER AMPLIFIER MARKET, BY MATERIAL, 2022-2032 ($MILLION)
- TABLE 63. REST OF ASIA-PACIFIC POWER AMPLIFIER MARKET, BY END USER, 2022-2032 ($MILLION)
- TABLE 64. LATIN AMERICA POWER AMPLIFIER MARKET, BY TYPE, 2022-2032 ($MILLION)
- TABLE 65. LATIN AMERICA POWER AMPLIFIER MARKET, BY MATERIAL, 2022-2032 ($MILLION)
- TABLE 66. LATIN AMERICA POWER AMPLIFIER MARKET, BY END USER, 2022-2032 ($MILLION)
- TABLE 67. LATIN AMERICA POWER AMPLIFIER MARKET, BY COUNTRY, 2022-2032 ($MILLION)
- TABLE 68. BRAZIL POWER AMPLIFIER MARKET, BY TYPE, 2022-2032 ($MILLION)
- TABLE 69. BRAZIL POWER AMPLIFIER MARKET, BY MATERIAL, 2022-2032 ($MILLION)
- TABLE 70. BRAZIL POWER AMPLIFIER MARKET, BY END USER, 2022-2032 ($MILLION)
- TABLE 71. ARGENTINA POWER AMPLIFIER MARKET, BY TYPE, 2022-2032 ($MILLION)
- TABLE 72. ARGENTINA POWER AMPLIFIER MARKET, BY MATERIAL, 2022-2032 ($MILLION)
- TABLE 73. ARGENTINA POWER AMPLIFIER MARKET, BY END USER, 2022-2032 ($MILLION)
- TABLE 74. REST OF LATIN AMERICA POWER AMPLIFIER MARKET, BY TYPE, 2022-2032 ($MILLION)
- TABLE 75. REST OF LATIN AMERICA POWER AMPLIFIER MARKET, BY MATERIAL, 2022-2032 ($MILLION)
- TABLE 76. REST OF LATIN AMERICA POWER AMPLIFIER MARKET, BY END USER, 2022-2032 ($MILLION)
- TABLE 77. MIDDLE EAST AND AFRICA POWER AMPLIFIER MARKET, BY TYPE, 2022-2032 ($MILLION)
- TABLE 78. MIDDLE EAST AND AFRICA POWER AMPLIFIER MARKET, BY MATERIAL, 2022-2032 ($MILLION)
- TABLE 79. MIDDLE EAST AND AFRICA POWER AMPLIFIER MARKET, BY END USER, 2022-2032 ($MILLION)
- TABLE 80. MIDDLE EAST AND AFRICA POWER AMPLIFIER MARKET, BY COUNTRY, 2022-2032 ($MILLION)
- TABLE 81. SAUDI ARABIA POWER AMPLIFIER MARKET, BY TYPE, 2022-2032 ($MILLION)
- TABLE 82. SAUDI ARABIA POWER AMPLIFIER MARKET, BY MATERIAL, 2022-2032 ($MILLION)
- TABLE 83. SAUDI ARABIA POWER AMPLIFIER MARKET, BY END USER, 2022-2032 ($MILLION)
- TABLE 84. SOUTH AFRICA POWER AMPLIFIER MARKET, BY TYPE, 2022-2032 ($MILLION)
- TABLE 85. SOUTH AFRICA POWER AMPLIFIER MARKET, BY MATERIAL, 2022-2032 ($MILLION)
- TABLE 86. SOUTH AFRICA POWER AMPLIFIER MARKET, BY END USER, 2022-2032 ($MILLION)
- TABLE 87. REST OF MIDDLE EAST AND AFRICA POWER AMPLIFIER MARKET, BY TYPE, 2022-2032 ($MILLION)
- TABLE 88. REST OF MIDDLE EAST AND AFRICA POWER AMPLIFIER MARKET, BY MATERIAL, 2022-2032 ($MILLION)
- TABLE 89. REST OF MIDDLE EAST AND AFRICA POWER AMPLIFIER MARKET, BY END USER, 2022-2032 ($MILLION)
- TABLE 90. TEXAS INSTRUMENTS INC.: KEY EXECUTIVES
- TABLE 91. TEXAS INSTRUMENTS INC.: COMPANY SNAPSHOT
- TABLE 92. TEXAS INSTRUMENTS INC.: PRODUCT SEGMENTS
- TABLE 93. TEXAS INSTRUMENTS INC.: SERVICE SEGMENTS
- TABLE 94. TEXAS INSTRUMENTS INC.: PRODUCT PORTFOLIO
- TABLE 95. TEXAS INSTRUMENTS INC.: KEY STRATERGIES
- TABLE 96. INFINEON TECHNOLOGIES AG: KEY EXECUTIVES
- TABLE 97. INFINEON TECHNOLOGIES AG: COMPANY SNAPSHOT
- TABLE 98. INFINEON TECHNOLOGIES AG: PRODUCT SEGMENTS
- TABLE 99. INFINEON TECHNOLOGIES AG: SERVICE SEGMENTS
- TABLE 100. INFINEON TECHNOLOGIES AG: PRODUCT PORTFOLIO
- TABLE 101. INFINEON TECHNOLOGIES AG: KEY STRATERGIES
- TABLE 102. NXP SEMICONDUCTORS N.V.: KEY EXECUTIVES
- TABLE 103. NXP SEMICONDUCTORS N.V.: COMPANY SNAPSHOT
- TABLE 104. NXP SEMICONDUCTORS N.V.: PRODUCT SEGMENTS
- TABLE 105. NXP SEMICONDUCTORS N.V.: SERVICE SEGMENTS
- TABLE 106. NXP SEMICONDUCTORS N.V.: PRODUCT PORTFOLIO
- TABLE 107. NXP SEMICONDUCTORS N.V.: KEY STRATERGIES
- TABLE 108. ANALOG DEVICES, INC: KEY EXECUTIVES
- TABLE 109. ANALOG DEVICES, INC: COMPANY SNAPSHOT
- TABLE 110. ANALOG DEVICES, INC: PRODUCT SEGMENTS
- TABLE 111. ANALOG DEVICES, INC: SERVICE SEGMENTS
- TABLE 112. ANALOG DEVICES, INC: PRODUCT PORTFOLIO
- TABLE 113. ANALOG DEVICES, INC: KEY STRATERGIES
- TABLE 114. STMICROELECTRONICS N.V.: KEY EXECUTIVES
- TABLE 115. STMICROELECTRONICS N.V.: COMPANY SNAPSHOT
- TABLE 116. STMICROELECTRONICS N.V.: PRODUCT SEGMENTS
- TABLE 117. STMICROELECTRONICS N.V.: SERVICE SEGMENTS
- TABLE 118. STMICROELECTRONICS N.V.: PRODUCT PORTFOLIO
- TABLE 119. STMICROELECTRONICS N.V.: KEY STRATERGIES
- TABLE 120. TOSHIBA CORPORATION: KEY EXECUTIVES
- TABLE 121. TOSHIBA CORPORATION: COMPANY SNAPSHOT
- TABLE 122. TOSHIBA CORPORATION: PRODUCT SEGMENTS
- TABLE 123. TOSHIBA CORPORATION: SERVICE SEGMENTS
- TABLE 124. TOSHIBA CORPORATION: PRODUCT PORTFOLIO
- TABLE 125. TOSHIBA CORPORATION: KEY STRATERGIES
- TABLE 126. RENESAS ELECTRONICS CORPORATION.: KEY EXECUTIVES
- TABLE 127. RENESAS ELECTRONICS CORPORATION.: COMPANY SNAPSHOT
- TABLE 128. RENESAS ELECTRONICS CORPORATION.: PRODUCT SEGMENTS
- TABLE 129. RENESAS ELECTRONICS CORPORATION.: SERVICE SEGMENTS
- TABLE 130. RENESAS ELECTRONICS CORPORATION.: PRODUCT PORTFOLIO
- TABLE 131. RENESAS ELECTRONICS CORPORATION.: KEY STRATERGIES
- TABLE 132. SKYWORKS SOLUTIONS, INC.: KEY EXECUTIVES
- TABLE 133. SKYWORKS SOLUTIONS, INC.: COMPANY SNAPSHOT
- TABLE 134. SKYWORKS SOLUTIONS, INC.: PRODUCT SEGMENTS
- TABLE 135. SKYWORKS SOLUTIONS, INC.: SERVICE SEGMENTS
- TABLE 136. SKYWORKS SOLUTIONS, INC.: PRODUCT PORTFOLIO
- TABLE 137. SKYWORKS SOLUTIONS, INC.: KEY STRATERGIES
- TABLE 138. BROADCOM INC.: KEY EXECUTIVES
- TABLE 139. BROADCOM INC.: COMPANY SNAPSHOT
- TABLE 140. BROADCOM INC.: PRODUCT SEGMENTS
- TABLE 141. BROADCOM INC.: SERVICE SEGMENTS
- TABLE 142. BROADCOM INC.: PRODUCT PORTFOLIO
- TABLE 143. BROADCOM INC.: KEY STRATERGIES
- TABLE 144. QUALCOMM INCORPORATED.: KEY EXECUTIVES
- TABLE 145. QUALCOMM INCORPORATED.: COMPANY SNAPSHOT
- TABLE 146. QUALCOMM INCORPORATED.: PRODUCT SEGMENTS
- TABLE 147. QUALCOMM INCORPORATED.: SERVICE SEGMENTS
- TABLE 148. QUALCOMM INCORPORATED.: PRODUCT PORTFOLIO
- TABLE 149. QUALCOMM INCORPORATED.: KEY STRATERGIES
LIST OF FIGURES
- FIGURE 01. POWER AMPLIFIER MARKET, 2022-2032
- FIGURE 02. SEGMENTATION OF POWER AMPLIFIER MARKET,2022-2032
- FIGURE 03. TOP IMPACTING FACTORS IN POWER AMPLIFIER MARKET
- FIGURE 04. TOP INVESTMENT POCKETS IN POWER AMPLIFIER MARKET (2023-2032)
- FIGURE 05. BARGAINING POWER OF SUPPLIERS
- FIGURE 06. BARGAINING POWER OF BUYERS
- FIGURE 07. THREAT OF SUBSTITUTION
- FIGURE 08. THREAT OF SUBSTITUTION
- FIGURE 09. COMPETITIVE RIVALRY
- FIGURE 10. GLOBAL POWER AMPLIFIER MARKET:DRIVERS, RESTRAINTS AND OPPORTUNITIES
- FIGURE 11. POWER AMPLIFIER MARKET, BY TYPE, 2022 AND 2032(%)
- FIGURE 12. COMPARATIVE SHARE ANALYSIS OF POWER AMPLIFIER MARKET FOR AUDIO POWER AMPLIFIER, BY COUNTRY 2022 AND 2032(%)
- FIGURE 13. COMPARATIVE SHARE ANALYSIS OF POWER AMPLIFIER MARKET FOR RADIO FREQUENCY (RF) POWER AMPLIFIER, BY COUNTRY 2022 AND 2032(%)
- FIGURE 14. COMPARATIVE SHARE ANALYSIS OF POWER AMPLIFIER MARKET FOR LINEAR POWER AMPLIFIER, BY COUNTRY 2022 AND 2032(%)
- FIGURE 15. POWER AMPLIFIER MARKET, BY MATERIAL, 2022 AND 2032(%)
- FIGURE 16. COMPARATIVE SHARE ANALYSIS OF POWER AMPLIFIER MARKET FOR SILICON GERMANIUM (SIGE), BY COUNTRY 2022 AND 2032(%)
- FIGURE 17. COMPARATIVE SHARE ANALYSIS OF POWER AMPLIFIER MARKET FOR GALLIUM NITRIDE (GAN), BY COUNTRY 2022 AND 2032(%)
- FIGURE 18. COMPARATIVE SHARE ANALYSIS OF POWER AMPLIFIER MARKET FOR GALLIUM ARSENIDE (GAAS), BY COUNTRY 2022 AND 2032(%)
- FIGURE 19. POWER AMPLIFIER MARKET, BY END USER, 2022 AND 2032(%)
- FIGURE 20. COMPARATIVE SHARE ANALYSIS OF POWER AMPLIFIER MARKET FOR CONSUMER ELECTRONICS, BY COUNTRY 2022 AND 2032(%)
- FIGURE 21. COMPARATIVE SHARE ANALYSIS OF POWER AMPLIFIER MARKET FOR HEALTHCARE, BY COUNTRY 2022 AND 2032(%)
- FIGURE 22. COMPARATIVE SHARE ANALYSIS OF POWER AMPLIFIER MARKET FOR AEROSPACE AND DEFENSE, BY COUNTRY 2022 AND 2032(%)
- FIGURE 23. COMPARATIVE SHARE ANALYSIS OF POWER AMPLIFIER MARKET FOR TELECOMMUNICATION, BY COUNTRY 2022 AND 2032(%)
- FIGURE 24. COMPARATIVE SHARE ANALYSIS OF POWER AMPLIFIER MARKET FOR OTHERS (AUTOMOTIVE, ENERGY AND POWER AND OIL AND GAS), BY COUNTRY 2022 AND 2032(%)
- FIGURE 25. POWER AMPLIFIER MARKET BY REGION, 2022 AND 2032(%)
- FIGURE 26. U.S. POWER AMPLIFIER MARKET, 2022-2032 ($MILLION)
- FIGURE 27. CANADA POWER AMPLIFIER MARKET, 2022-2032 ($MILLION)
- FIGURE 28. MEXICO POWER AMPLIFIER MARKET, 2022-2032 ($MILLION)
- FIGURE 29. UK POWER AMPLIFIER MARKET, 2022-2032 ($MILLION)
- FIGURE 30. GERMANY POWER AMPLIFIER MARKET, 2022-2032 ($MILLION)
- FIGURE 31. FRANCE POWER AMPLIFIER MARKET, 2022-2032 ($MILLION)
- FIGURE 32. REST OF EUROPE POWER AMPLIFIER MARKET, 2022-2032 ($MILLION)
- FIGURE 33. CHINA POWER AMPLIFIER MARKET, 2022-2032 ($MILLION)
- FIGURE 34. JAPAN POWER AMPLIFIER MARKET, 2022-2032 ($MILLION)
- FIGURE 35. INDIA POWER AMPLIFIER MARKET, 2022-2032 ($MILLION)
- FIGURE 36. SOUTH KOREA POWER AMPLIFIER MARKET, 2022-2032 ($MILLION)
- FIGURE 37. REST OF ASIA-PACIFIC POWER AMPLIFIER MARKET, 2022-2032 ($MILLION)
- FIGURE 38. BRAZIL POWER AMPLIFIER MARKET, 2022-2032 ($MILLION)
- FIGURE 39. ARGENTINA POWER AMPLIFIER MARKET, 2022-2032 ($MILLION)
- FIGURE 40. REST OF LATIN AMERICA POWER AMPLIFIER MARKET, 2022-2032 ($MILLION)
- FIGURE 41. SAUDI ARABIA POWER AMPLIFIER MARKET, 2022-2032 ($MILLION)
- FIGURE 42. SOUTH AFRICA POWER AMPLIFIER MARKET, 2022-2032 ($MILLION)
- FIGURE 43. REST OF MIDDLE EAST AND AFRICA POWER AMPLIFIER MARKET, 2022-2032 ($MILLION)
- FIGURE 44. TOP WINNING STRATEGIES, BY YEAR
- FIGURE 45. TOP WINNING STRATEGIES, BY DEVELOPMENT
- FIGURE 46. TOP WINNING STRATEGIES, BY COMPANY
- FIGURE 47. PRODUCT MAPPING OF TOP 10 PLAYERS
- FIGURE 48. COMPETITIVE DASHBOARD
- FIGURE 49. COMPETITIVE HEATMAP: POWER AMPLIFIER MARKET
- FIGURE 50. TOP PLAYER POSITIONING, 2022
 功率放大器市场规模、份额和成长分析(按产品、类别、技术、垂直和地区)- 产业预测 2025-2032
 CMOS 功率放大器市场,按类型、频率范围、应用、国家和地区 - 2024-2032 年行业分析、市场规模、市场份额和预测
 功率放大器市场 - 按产品、垂直产业、地区和竞争细分的全球产业规模、份额、趋势、机会和预测,2019-2029 年小型蜂窝功率放大器市场 - 按产品类型、应用、最终用户、地区和竞争细分的全球行业规模、份额、趋势、机会和预测,2019-2029F
 固态功率放大器市场、机会、成长动力、产业趋势分析与预测,2024-2032
 2024-2032 年小型蜂窝功率放大器市场报告(按类型、类别、应用和地区)功率放大器市场,按产品、类别、技术、垂直领域和地区 - 2024-2032 年行业分析、市场规模、市场份额和预测
 全球功率放大器市场:市场规模、份额、趋势分析 - 按类型、最终用户、材料和地区分類的展望和预测(2024-2031)
 2024-2028 年嵌入式系统放大器全球市场
 2024-2028年全球放大器市场