


 |
市场调查报告书
商品编码
1472234
大陆护理产品市场:按产品类型、性别、类别、最终用户划分:2023-2032 年全球机会分析与产业预测Continence Care Products Market By Product Type, By Gender, By Category, By End User : Global Opportunity Analysis and Industry Forecast, 2023-2032 |
||||||
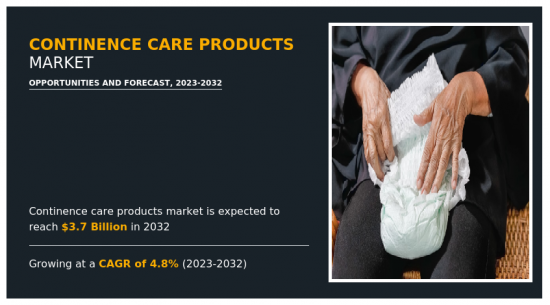
大陆护理产品市场预计到 2022 年将达到 23 亿美元,2023 年至 2032 年复合年增长率为 4.8%,到 2032 年将达到 37 亿美元。
失禁护理是指一个综合性的医疗保健领域,重点在于解决和管理与尿失禁和大便失禁相关的症状。失禁护理包括各种旨在帮助难以控制膀胱和肠道功能的人的产品、干预措施和策略。失禁护理涉及使用吸收性产品、导管和护肤产品,以改善有失禁问题的人的舒适度、卫生状况和整体生活品质。它还包括教育、意识和医疗干预措施,旨在为尿失禁和大便失禁患者提供量身定制的解决方案,最大限度地减少耻辱并促进福祉。
越来越多的政府倡议旨在提高人们对膀胱和肠道问题的认识,这对大陆护理产品市场的成长做出了重大贡献。例如,2009 年,世界失禁和骨盆问题联合会 (WFIPP) 发起了世界失禁週 (WCW),这是一项年度健康宣传活动,旨在提高对失禁相关问题的认识。该宣传活动旨在透过将六月的第三週定为世界失禁週(WCW),教育大众了解膀胱和肠道问题的盛行率、原因和管理。这些努力增加了对失禁相关症状的理解和接受,并鼓励寻找适当的解决方案和治疗方法。此外,政府对此类宣传活动的支持扩大了其范围和有效性,导致对大陆护理产品的需求增加。因此,政府主导的宣传活动在推动市场成长、同时改善患有膀胱和肠道问题的人们的生活品质方面发挥着至关重要的作用。
此外,大陆护理产品市场的成长很大程度上是由主要企业加强其产品系列的策略重点所推动的。例如,2023 年 2 月,开发、製造和销售与造口术、泌尿系统、节制和伤口护理相关的医疗设备和服务的跨国公司康乐保公司(Coloplast Corp.) 宣布推出采用微孔区域技术的CE标誌。因此,该产品的推出表明了我们对满足特定用户需求并提高大陆护理产品整体功效的创新的承诺。这些努力不仅体现了对市场需求的应对力,而且有助于竞争格局,推动技术和设计的进步,促进市场的持续扩张,并提高膀胱和肠道管理不良治疗的有效性。需求。
大陆护理产品市场按产品类型、类别、性别、最终用户和地区进行细分。依产品类型分为导尿管、尿袋/尿袋、吸收性产品等。按类别划分,市场分为一次性和可重复使用。从性别来看,市场分为男性和女性。依最终用户划分,市场分为医院/诊所、居家照护等。依地区划分,市场分为北美(美国、加拿大、墨西哥)、欧洲(德国、法国、英国、义大利、西班牙其他欧洲国家地区)、亚太地区(中国、日本、印度、澳洲、南美洲)韩国及其他亚太地区),对拉丁美洲(巴西、哥伦比亚、阿根廷、拉丁美洲其他地区)、中东和非洲(海湾合作委员会、南非、中东和非洲其他地区)进行了分析。
相关人员的主要利益
- 本报告定量分析了 2022 年至 2032 年失禁护理产品市场的细分市场、当前趋势、估计和趋势以及动态,并确定了失禁护理产品市场的强大机会。
- 我们提供市场研究以及与市场驱动因素、市场限制和市场机会相关的资讯。
- 波特的五力分析揭示了买方和供应商的潜力,可帮助相关人员做出以利润为导向的业务决策并加强供应商和买方网络。
- 对失禁护理产品市场细分的详细分析有助于识别市场机会。
- 每个地区的主要国家都根据其对全球市场的收益贡献绘製了地图。
- 市场参与者定位有助于基准化分析,并提供对市场参与者当前地位的清晰了解。
- 该报告包括对区域和全球失禁护理产品市场趋势、主要企业、细分市场、应用领域和市场成长策略的分析。
此报告可以客製化(请联络销售人员以了解额外费用和时间表)
- 监管指引
- 根据客户兴趣加入公司简介
- 按国家或地区进行的附加分析 – 市场规模和预测
- 公司简介的扩充列表
- 历史市场资料
目录
第一章简介
第 2 章执行摘要
第三章市场概况
- 市场定义和范围
- 主要发现
- 主要影响因素
- 关键投资机会
- 波特五力分析
- 市场动态
- 促进因素
- 抑制因素
- 机会
第 4 章失禁护理产品市场:依产品类型
- 概述
- 导尿管
- 尿袋/尿袋
- 吸收性产品
- 其他的
第五章大陆护理产品市场:性别
- 概述
- 男性
- 女士
第六章大陆护理产品市场:依类别
- 概述
- 一次性的
- 可重复使用的
第 7 章失禁护理产品市场:依最终用户分类
- 概述
- 医院/诊所
- 居家护理
- 其他的
第八章大陆护理产品市场:按地区
- 概述
- 北美洲
- 美国
- 加拿大
- 墨西哥
- 欧洲
- 德国
- 法国
- 英国
- 义大利
- 西班牙
- 其他欧洲国家
- 亚太地区
- 日本
- 中国
- 印度
- 澳洲
- 韩国
- 其他亚太地区
- 拉丁美洲
- 巴西
- 哥伦比亚
- 阿根廷
- 其他拉丁美洲
- 中东/非洲
- Gcc
- 南非
- 北非
- 其他中东/非洲
第9章 竞争格局
- 介绍
- 关键成功策略
- 10家主要企业产品图谱
- 竞争对手仪表板
- 竞争热图
- 2022年主要企业定位
第十章 公司简介
- Hollister Incorporated
- Coloplast Group
- ConvaTec Group plc
- BD(Becton, Dickinson and Company)
- Wellspect HealthCare AB
- Essity
- Boston Scientific Corporation
- ethicon
- AstraTech
- Tyco
The continence care products market was valued at $2.3 billion in 2022 and is estimated to reach $3.7 billion by 2032, exhibiting a CAGR of 4.8% from 2023 to 2032. Continence care refers to a comprehensive healthcare domain focused on addressing and managing conditions related to urinary and fecal incontinence. It includes a range of products, interventions, and strategies designed to support individuals experiencing challenges in maintaining control over bladder and bowel functions. Continence care involves the use of absorbent products, catheters, and skincare items to enhance comfort, hygiene, and overall quality of life for those affected by incontinence issues. In addition, it includes education, awareness initiatives, and medical interventions aimed at providing tailored solutions, minimizing stigma, and promoting the well-being of individuals grappling with urinary and fecal incontinence.
Rise in government initiatives aimed at raising awareness about bladder and bowel problems significantly contributes to the growth of the continence care products market. For instance, in 2009, the World Federation for Incontinence and Pelvic Problems (WFIPP) launched World Continence Week (WCW), an annual health campaign dedicated to raising awareness of incontinence-related issues. By designating the third week of June as World Continence Week (WCW), the campaign aims to educate the public about the prevalence, causes, and management of bladder and bowel problems. These initiatives foster greater understanding and acceptance of incontinence-related conditions, encouraging individuals to seek appropriate solutions and treatment options. In addition, government support for such campaigns enhances their reach and impact, leading to increase in demand for continence care products. As a result, government-led awareness initiatives play a pivotal role in driving market growth while improving the quality of life for individuals affected by bladder and bowel problems.
In addition, the market growth of continence care products is significantly propelled by the strategic focus of key players on enhancing their product portfolios. For instance, in February 2023, Coloplast Corp, a multinational company that develops, manufactures, and markets medical devices and services related to ostomy, urology, continence, and wound care announced the launch of Luja, the new CE-marked male intermittent catheter with a Micro-hole Zone Technology. Thus, product launch demonstrates a commitment to innovation, addressing specific user needs and improving the overall efficacy of continence care products. Such initiatives not only showcase responsiveness to market demands but also contribute to the competitive landscape, fostering advancements in technology and design that drive continual market expansion and cater to the evolving needs of individuals seeking effective solutions for poor bladder and bowel management.
The continence care products market is segmented on the basis of product type, category, gender, end user, and region. On the basis of product type, the market is segmented into urinary catheters, urinary bags and pouch, absorbent products, and others. On the basis of category, the market is segmented into disposable and reusable. On the basis of gender, the market is segmented into male and female. On the basis of end user, the market is segmented into hospitals and clinics, home care, and others. Region-wise, the market is analyzed across North America (U.S., Canada, and Mexico), Europe (Germany, France, UK, Italy, Spain, and rest of Europe), Asia-Pacific (China, Japan, India, Australia, South Korea, and rest of Asia-Pacific), and LA (Brazil, Colombia, Argentina, and rest of LA), and MEA (GCC, South Africa, North Africa and rest of MEA).
The major key players that operate in the global continence care products market are Hollister Incorporated, Coloplast Group, Convatec Group PLC, Becton, Dickinson and Company, Wellspect Healthcare (Dentsply Sirona), Marlen Manufact, Healthcare Associates Pvt. Ltd., B Braun SE, and Cotton Incorporated. The key players have adopted product launch, product development and product approval as the key strategy to expand their product portfolio.
Key Benefits for Stakeholders
- This report provides a quantitative analysis of the market segments, current trends, estimations, and dynamics of the continence care products market analysis from 2022 to 2032 to identify the prevailing continence care products market opportunities.
- The market research is offered along with information related to key drivers, restraints, and opportunities.
- Porter's five forces analysis highlights the potency of buyers and suppliers to enable stakeholders make profit-oriented business decisions and strengthen their supplier-buyer network.
- In-depth analysis of the continence care products market segmentation assists to determine the prevailing market opportunities.
- Major countries in each region are mapped according to their revenue contribution to the global market.
- Market player positioning facilitates benchmarking and provides a clear understanding of the present position of the market players.
- The report includes the analysis of the regional as well as global continence care products market trends, key players, market segments, application areas, and market growth strategies.
Additional benefits you will get with this purchase are:
- Quarterly Update and* (only available with a corporate license, on listed price)
- 5 additional Company Profile of client Choice pre- or Post-purchase, as a free update.
- Free Upcoming Version on the Purchase of Five and Enterprise User License.
- 16 analyst hours of support* (post-purchase, if you find additional data requirements upon review of the report, you may receive support amounting to 16 analyst hours to solve questions, and post-sale queries)
- 15% Free Customization* (in case the scope or segment of the report does not match your requirements, 15% is equivalent to 3 working days of free work, applicable once)
- Free data Pack on the Five and Enterprise User License. (Excel version of the report)
- Free Updated report if the report is 6-12 months old or older.
- 24-hour priority response*
- Free Industry updates and white papers.
Possible Customization with this report (with additional cost and timeline, please talk to the sales executive to know more)
- Regulatory Guidelines
- Additional company profiles with specific to client's interest
- Additional country or region analysis- market size and forecast
- Expanded list for Company Profiles
- Historic market data
Key Market Segments
By Product Type
- Urinary catheters
- Urinary bags and pouch
- Absorbent Products
- Others
By Gender
- Male
- Female
By Category
- Disposable
- Reusable
By End User
- Hospitals and clinics
- Home care
- Others
By Region
- North America
- U.S.
- Canada
- Mexico
- Europe
- Germany
- France
- UK
- Italy
- Spain
- Rest of Europe
- Asia-Pacific
- Japan
- China
- India
- Australia
- South Korea
- Rest of Asia-Pacific
- Latin America
- Brazil
- Colombia
- Argentina
- Rest Of La
- Middle East and Africa
- Gcc
- South Africa
- North Africa
- Rest Of Mea
Key Market Players:
- Hollister Incorporated
- Coloplast Group
- ConvaTec Group plc
- BD (Becton, Dickinson and Company)
- Wellspect HealthCare AB
- Essity
- Boston Scientific Corporation
- ethicon
- AstraTech
- Tyco
TABLE OF CONTENTS
CHAPTER 1: INTRODUCTION
- 1.1. Report description
- 1.2. Key market segments
- 1.3. Key benefits to the stakeholders
- 1.4. Research methodology
- 1.4.1. Primary research
- 1.4.2. Secondary research
- 1.4.3. Analyst tools and models
CHAPTER 2: EXECUTIVE SUMMARY
- 2.1. CXO perspective
CHAPTER 3: MARKET OVERVIEW
- 3.1. Market definition and scope
- 3.2. Key findings
- 3.2.1. Top impacting factors
- 3.2.2. Top investment pockets
- 3.3. Porter's five forces analysis
- 3.4. Market dynamics
- 3.4.1. Drivers
- 3.4.2. Restraints
- 3.4.3. Opportunities
CHAPTER 4: CONTINENCE CARE PRODUCTS MARKET, BY PRODUCT TYPE
- 4.1. Overview
- 4.1.1. Market size and forecast
- 4.2. Urinary catheters
- 4.2.1. Key market trends, growth factors and opportunities
- 4.2.2. Market size and forecast, by region
- 4.2.3. Market share analysis by country
- 4.3. Urinary bags and pouch
- 4.3.1. Key market trends, growth factors and opportunities
- 4.3.2. Market size and forecast, by region
- 4.3.3. Market share analysis by country
- 4.4. Absorbent Products
- 4.4.1. Key market trends, growth factors and opportunities
- 4.4.2. Market size and forecast, by region
- 4.4.3. Market share analysis by country
- 4.5. Others
- 4.5.1. Key market trends, growth factors and opportunities
- 4.5.2. Market size and forecast, by region
- 4.5.3. Market share analysis by country
CHAPTER 5: CONTINENCE CARE PRODUCTS MARKET, BY GENDER
- 5.1. Overview
- 5.1.1. Market size and forecast
- 5.2. Male
- 5.2.1. Key market trends, growth factors and opportunities
- 5.2.2. Market size and forecast, by region
- 5.2.3. Market share analysis by country
- 5.3. Female
- 5.3.1. Key market trends, growth factors and opportunities
- 5.3.2. Market size and forecast, by region
- 5.3.3. Market share analysis by country
CHAPTER 6: CONTINENCE CARE PRODUCTS MARKET, BY CATEGORY
- 6.1. Overview
- 6.1.1. Market size and forecast
- 6.2. Disposable
- 6.2.1. Key market trends, growth factors and opportunities
- 6.2.2. Market size and forecast, by region
- 6.2.3. Market share analysis by country
- 6.3. Reusable
- 6.3.1. Key market trends, growth factors and opportunities
- 6.3.2. Market size and forecast, by region
- 6.3.3. Market share analysis by country
CHAPTER 7: CONTINENCE CARE PRODUCTS MARKET, BY END USER
- 7.1. Overview
- 7.1.1. Market size and forecast
- 7.2. Hospitals and clinics
- 7.2.1. Key market trends, growth factors and opportunities
- 7.2.2. Market size and forecast, by region
- 7.2.3. Market share analysis by country
- 7.3. Home care
- 7.3.1. Key market trends, growth factors and opportunities
- 7.3.2. Market size and forecast, by region
- 7.3.3. Market share analysis by country
- 7.4. Others
- 7.4.1. Key market trends, growth factors and opportunities
- 7.4.2. Market size and forecast, by region
- 7.4.3. Market share analysis by country
CHAPTER 8: CONTINENCE CARE PRODUCTS MARKET, BY REGION
- 8.1. Overview
- 8.1.1. Market size and forecast By Region
- 8.2. North America
- 8.2.1. Key market trends, growth factors and opportunities
- 8.2.2. Market size and forecast, by Product Type
- 8.2.3. Market size and forecast, by Gender
- 8.2.4. Market size and forecast, by Category
- 8.2.5. Market size and forecast, by End User
- 8.2.6. Market size and forecast, by country
- 8.2.6.1. U.S.
- 8.2.6.1.1. Market size and forecast, by Product Type
- 8.2.6.1.2. Market size and forecast, by Gender
- 8.2.6.1.3. Market size and forecast, by Category
- 8.2.6.1.4. Market size and forecast, by End User
- 8.2.6.2. Canada
- 8.2.6.2.1. Market size and forecast, by Product Type
- 8.2.6.2.2. Market size and forecast, by Gender
- 8.2.6.2.3. Market size and forecast, by Category
- 8.2.6.2.4. Market size and forecast, by End User
- 8.2.6.3. Mexico
- 8.2.6.3.1. Market size and forecast, by Product Type
- 8.2.6.3.2. Market size and forecast, by Gender
- 8.2.6.3.3. Market size and forecast, by Category
- 8.2.6.3.4. Market size and forecast, by End User
- 8.3. Europe
- 8.3.1. Key market trends, growth factors and opportunities
- 8.3.2. Market size and forecast, by Product Type
- 8.3.3. Market size and forecast, by Gender
- 8.3.4. Market size and forecast, by Category
- 8.3.5. Market size and forecast, by End User
- 8.3.6. Market size and forecast, by country
- 8.3.6.1. Germany
- 8.3.6.1.1. Market size and forecast, by Product Type
- 8.3.6.1.2. Market size and forecast, by Gender
- 8.3.6.1.3. Market size and forecast, by Category
- 8.3.6.1.4. Market size and forecast, by End User
- 8.3.6.2. France
- 8.3.6.2.1. Market size and forecast, by Product Type
- 8.3.6.2.2. Market size and forecast, by Gender
- 8.3.6.2.3. Market size and forecast, by Category
- 8.3.6.2.4. Market size and forecast, by End User
- 8.3.6.3. UK
- 8.3.6.3.1. Market size and forecast, by Product Type
- 8.3.6.3.2. Market size and forecast, by Gender
- 8.3.6.3.3. Market size and forecast, by Category
- 8.3.6.3.4. Market size and forecast, by End User
- 8.3.6.4. Italy
- 8.3.6.4.1. Market size and forecast, by Product Type
- 8.3.6.4.2. Market size and forecast, by Gender
- 8.3.6.4.3. Market size and forecast, by Category
- 8.3.6.4.4. Market size and forecast, by End User
- 8.3.6.5. Spain
- 8.3.6.5.1. Market size and forecast, by Product Type
- 8.3.6.5.2. Market size and forecast, by Gender
- 8.3.6.5.3. Market size and forecast, by Category
- 8.3.6.5.4. Market size and forecast, by End User
- 8.3.6.6. Rest of Europe
- 8.3.6.6.1. Market size and forecast, by Product Type
- 8.3.6.6.2. Market size and forecast, by Gender
- 8.3.6.6.3. Market size and forecast, by Category
- 8.3.6.6.4. Market size and forecast, by End User
- 8.4. Asia-Pacific
- 8.4.1. Key market trends, growth factors and opportunities
- 8.4.2. Market size and forecast, by Product Type
- 8.4.3. Market size and forecast, by Gender
- 8.4.4. Market size and forecast, by Category
- 8.4.5. Market size and forecast, by End User
- 8.4.6. Market size and forecast, by country
- 8.4.6.1. Japan
- 8.4.6.1.1. Market size and forecast, by Product Type
- 8.4.6.1.2. Market size and forecast, by Gender
- 8.4.6.1.3. Market size and forecast, by Category
- 8.4.6.1.4. Market size and forecast, by End User
- 8.4.6.2. China
- 8.4.6.2.1. Market size and forecast, by Product Type
- 8.4.6.2.2. Market size and forecast, by Gender
- 8.4.6.2.3. Market size and forecast, by Category
- 8.4.6.2.4. Market size and forecast, by End User
- 8.4.6.3. India
- 8.4.6.3.1. Market size and forecast, by Product Type
- 8.4.6.3.2. Market size and forecast, by Gender
- 8.4.6.3.3. Market size and forecast, by Category
- 8.4.6.3.4. Market size and forecast, by End User
- 8.4.6.4. Australia
- 8.4.6.4.1. Market size and forecast, by Product Type
- 8.4.6.4.2. Market size and forecast, by Gender
- 8.4.6.4.3. Market size and forecast, by Category
- 8.4.6.4.4. Market size and forecast, by End User
- 8.4.6.5. South Korea
- 8.4.6.5.1. Market size and forecast, by Product Type
- 8.4.6.5.2. Market size and forecast, by Gender
- 8.4.6.5.3. Market size and forecast, by Category
- 8.4.6.5.4. Market size and forecast, by End User
- 8.4.6.6. Rest of Asia-Pacific
- 8.4.6.6.1. Market size and forecast, by Product Type
- 8.4.6.6.2. Market size and forecast, by Gender
- 8.4.6.6.3. Market size and forecast, by Category
- 8.4.6.6.4. Market size and forecast, by End User
- 8.5. Latin America
- 8.5.1. Key market trends, growth factors and opportunities
- 8.5.2. Market size and forecast, by Product Type
- 8.5.3. Market size and forecast, by Gender
- 8.5.4. Market size and forecast, by Category
- 8.5.5. Market size and forecast, by End User
- 8.5.6. Market size and forecast, by country
- 8.5.6.1. Brazil
- 8.5.6.1.1. Market size and forecast, by Product Type
- 8.5.6.1.2. Market size and forecast, by Gender
- 8.5.6.1.3. Market size and forecast, by Category
- 8.5.6.1.4. Market size and forecast, by End User
- 8.5.6.2. Colombia
- 8.5.6.2.1. Market size and forecast, by Product Type
- 8.5.6.2.2. Market size and forecast, by Gender
- 8.5.6.2.3. Market size and forecast, by Category
- 8.5.6.2.4. Market size and forecast, by End User
- 8.5.6.3. Argentina
- 8.5.6.3.1. Market size and forecast, by Product Type
- 8.5.6.3.2. Market size and forecast, by Gender
- 8.5.6.3.3. Market size and forecast, by Category
- 8.5.6.3.4. Market size and forecast, by End User
- 8.5.6.4. Rest Of La
- 8.5.6.4.1. Market size and forecast, by Product Type
- 8.5.6.4.2. Market size and forecast, by Gender
- 8.5.6.4.3. Market size and forecast, by Category
- 8.5.6.4.4. Market size and forecast, by End User
- 8.6. Middle East and Africa
- 8.6.1. Key market trends, growth factors and opportunities
- 8.6.2. Market size and forecast, by Product Type
- 8.6.3. Market size and forecast, by Gender
- 8.6.4. Market size and forecast, by Category
- 8.6.5. Market size and forecast, by End User
- 8.6.6. Market size and forecast, by country
- 8.6.6.1. Gcc
- 8.6.6.1.1. Market size and forecast, by Product Type
- 8.6.6.1.2. Market size and forecast, by Gender
- 8.6.6.1.3. Market size and forecast, by Category
- 8.6.6.1.4. Market size and forecast, by End User
- 8.6.6.2. South Africa
- 8.6.6.2.1. Market size and forecast, by Product Type
- 8.6.6.2.2. Market size and forecast, by Gender
- 8.6.6.2.3. Market size and forecast, by Category
- 8.6.6.2.4. Market size and forecast, by End User
- 8.6.6.3. North Africa
- 8.6.6.3.1. Market size and forecast, by Product Type
- 8.6.6.3.2. Market size and forecast, by Gender
- 8.6.6.3.3. Market size and forecast, by Category
- 8.6.6.3.4. Market size and forecast, by End User
- 8.6.6.4. Rest Of Mea
- 8.6.6.4.1. Market size and forecast, by Product Type
- 8.6.6.4.2. Market size and forecast, by Gender
- 8.6.6.4.3. Market size and forecast, by Category
- 8.6.6.4.4. Market size and forecast, by End User
CHAPTER 9: COMPETITIVE LANDSCAPE
- 9.1. Introduction
- 9.2. Top winning strategies
- 9.3. Product mapping of top 10 player
- 9.4. Competitive dashboard
- 9.5. Competitive heatmap
- 9.6. Top player positioning, 2022
CHAPTER 10: COMPANY PROFILES
- 10.1. Hollister Incorporated
- 10.1.1. Company overview
- 10.1.2. Key executives
- 10.1.3. Company snapshot
- 10.1.4. Operating business segments
- 10.1.5. Product portfolio
- 10.1.6. Business performance
- 10.1.7. Key strategic moves and developments
- 10.2. Coloplast Group
- 10.2.1. Company overview
- 10.2.2. Key executives
- 10.2.3. Company snapshot
- 10.2.4. Operating business segments
- 10.2.5. Product portfolio
- 10.2.6. Business performance
- 10.2.7. Key strategic moves and developments
- 10.3. ConvaTec Group plc
- 10.3.1. Company overview
- 10.3.2. Key executives
- 10.3.3. Company snapshot
- 10.3.4. Operating business segments
- 10.3.5. Product portfolio
- 10.3.6. Business performance
- 10.3.7. Key strategic moves and developments
- 10.4. BD (Becton, Dickinson and Company)
- 10.4.1. Company overview
- 10.4.2. Key executives
- 10.4.3. Company snapshot
- 10.4.4. Operating business segments
- 10.4.5. Product portfolio
- 10.4.6. Business performance
- 10.4.7. Key strategic moves and developments
- 10.5. Wellspect HealthCare AB
- 10.5.1. Company overview
- 10.5.2. Key executives
- 10.5.3. Company snapshot
- 10.5.4. Operating business segments
- 10.5.5. Product portfolio
- 10.5.6. Business performance
- 10.5.7. Key strategic moves and developments
- 10.6. Essity
- 10.6.1. Company overview
- 10.6.2. Key executives
- 10.6.3. Company snapshot
- 10.6.4. Operating business segments
- 10.6.5. Product portfolio
- 10.6.6. Business performance
- 10.6.7. Key strategic moves and developments
- 10.7. Boston Scientific Corporation
- 10.7.1. Company overview
- 10.7.2. Key executives
- 10.7.3. Company snapshot
- 10.7.4. Operating business segments
- 10.7.5. Product portfolio
- 10.7.6. Business performance
- 10.7.7. Key strategic moves and developments
- 10.8. ethicon
- 10.8.1. Company overview
- 10.8.2. Key executives
- 10.8.3. Company snapshot
- 10.8.4. Operating business segments
- 10.8.5. Product portfolio
- 10.8.6. Business performance
- 10.8.7. Key strategic moves and developments
- 10.9. AstraTech
- 10.9.1. Company overview
- 10.9.2. Key executives
- 10.9.3. Company snapshot
- 10.9.4. Operating business segments
- 10.9.5. Product portfolio
- 10.9.6. Business performance
- 10.9.7. Key strategic moves and developments
- 10.10. Tyco
- 10.10.1. Company overview
- 10.10.2. Key executives
- 10.10.3. Company snapshot
- 10.10.4. Operating business segments
- 10.10.5. Product portfolio
- 10.10.6. Business performance
- 10.10.7. Key strategic moves and developments
LIST OF TABLES
- TABLE 01. GLOBAL CONTINENCE CARE PRODUCTS MARKET, BY PRODUCT TYPE, 2022-2032 ($MILLION)
- TABLE 02. CONTINENCE CARE PRODUCTS MARKET FOR URINARY CATHETERS, BY REGION, 2022-2032 ($MILLION)
- TABLE 03. CONTINENCE CARE PRODUCTS MARKET FOR URINARY BAGS AND POUCH, BY REGION, 2022-2032 ($MILLION)
- TABLE 04. CONTINENCE CARE PRODUCTS MARKET FOR ABSORBENT PRODUCTS, BY REGION, 2022-2032 ($MILLION)
- TABLE 05. CONTINENCE CARE PRODUCTS MARKET FOR OTHERS, BY REGION, 2022-2032 ($MILLION)
- TABLE 06. GLOBAL CONTINENCE CARE PRODUCTS MARKET, BY GENDER, 2022-2032 ($MILLION)
- TABLE 07. CONTINENCE CARE PRODUCTS MARKET FOR MALE, BY REGION, 2022-2032 ($MILLION)
- TABLE 08. CONTINENCE CARE PRODUCTS MARKET FOR FEMALE, BY REGION, 2022-2032 ($MILLION)
- TABLE 09. GLOBAL CONTINENCE CARE PRODUCTS MARKET, BY CATEGORY, 2022-2032 ($MILLION)
- TABLE 10. CONTINENCE CARE PRODUCTS MARKET FOR DISPOSABLE, BY REGION, 2022-2032 ($MILLION)
- TABLE 11. CONTINENCE CARE PRODUCTS MARKET FOR REUSABLE, BY REGION, 2022-2032 ($MILLION)
- TABLE 12. GLOBAL CONTINENCE CARE PRODUCTS MARKET, BY END USER, 2022-2032 ($MILLION)
- TABLE 13. CONTINENCE CARE PRODUCTS MARKET FOR HOSPITALS AND CLINICS, BY REGION, 2022-2032 ($MILLION)
- TABLE 14. CONTINENCE CARE PRODUCTS MARKET FOR HOME CARE, BY REGION, 2022-2032 ($MILLION)
- TABLE 15. CONTINENCE CARE PRODUCTS MARKET FOR OTHERS, BY REGION, 2022-2032 ($MILLION)
- TABLE 16. CONTINENCE CARE PRODUCTS MARKET, BY REGION, 2022-2032 ($MILLION)
- TABLE 17. NORTH AMERICA CONTINENCE CARE PRODUCTS MARKET, BY PRODUCT TYPE, 2022-2032 ($MILLION)
- TABLE 18. NORTH AMERICA CONTINENCE CARE PRODUCTS MARKET, BY GENDER, 2022-2032 ($MILLION)
- TABLE 19. NORTH AMERICA CONTINENCE CARE PRODUCTS MARKET, BY CATEGORY, 2022-2032 ($MILLION)
- TABLE 20. NORTH AMERICA CONTINENCE CARE PRODUCTS MARKET, BY END USER, 2022-2032 ($MILLION)
- TABLE 21. NORTH AMERICA CONTINENCE CARE PRODUCTS MARKET, BY COUNTRY, 2022-2032 ($MILLION)
- TABLE 22. U.S. CONTINENCE CARE PRODUCTS MARKET, BY PRODUCT TYPE, 2022-2032 ($MILLION)
- TABLE 23. U.S. CONTINENCE CARE PRODUCTS MARKET, BY GENDER, 2022-2032 ($MILLION)
- TABLE 24. U.S. CONTINENCE CARE PRODUCTS MARKET, BY CATEGORY, 2022-2032 ($MILLION)
- TABLE 25. U.S. CONTINENCE CARE PRODUCTS MARKET, BY END USER, 2022-2032 ($MILLION)
- TABLE 26. CANADA CONTINENCE CARE PRODUCTS MARKET, BY PRODUCT TYPE, 2022-2032 ($MILLION)
- TABLE 27. CANADA CONTINENCE CARE PRODUCTS MARKET, BY GENDER, 2022-2032 ($MILLION)
- TABLE 28. CANADA CONTINENCE CARE PRODUCTS MARKET, BY CATEGORY, 2022-2032 ($MILLION)
- TABLE 29. CANADA CONTINENCE CARE PRODUCTS MARKET, BY END USER, 2022-2032 ($MILLION)
- TABLE 30. MEXICO CONTINENCE CARE PRODUCTS MARKET, BY PRODUCT TYPE, 2022-2032 ($MILLION)
- TABLE 31. MEXICO CONTINENCE CARE PRODUCTS MARKET, BY GENDER, 2022-2032 ($MILLION)
- TABLE 32. MEXICO CONTINENCE CARE PRODUCTS MARKET, BY CATEGORY, 2022-2032 ($MILLION)
- TABLE 33. MEXICO CONTINENCE CARE PRODUCTS MARKET, BY END USER, 2022-2032 ($MILLION)
- TABLE 34. EUROPE CONTINENCE CARE PRODUCTS MARKET, BY PRODUCT TYPE, 2022-2032 ($MILLION)
- TABLE 35. EUROPE CONTINENCE CARE PRODUCTS MARKET, BY GENDER, 2022-2032 ($MILLION)
- TABLE 36. EUROPE CONTINENCE CARE PRODUCTS MARKET, BY CATEGORY, 2022-2032 ($MILLION)
- TABLE 37. EUROPE CONTINENCE CARE PRODUCTS MARKET, BY END USER, 2022-2032 ($MILLION)
- TABLE 38. EUROPE CONTINENCE CARE PRODUCTS MARKET, BY COUNTRY, 2022-2032 ($MILLION)
- TABLE 39. GERMANY CONTINENCE CARE PRODUCTS MARKET, BY PRODUCT TYPE, 2022-2032 ($MILLION)
- TABLE 40. GERMANY CONTINENCE CARE PRODUCTS MARKET, BY GENDER, 2022-2032 ($MILLION)
- TABLE 41. GERMANY CONTINENCE CARE PRODUCTS MARKET, BY CATEGORY, 2022-2032 ($MILLION)
- TABLE 42. GERMANY CONTINENCE CARE PRODUCTS MARKET, BY END USER, 2022-2032 ($MILLION)
- TABLE 43. FRANCE CONTINENCE CARE PRODUCTS MARKET, BY PRODUCT TYPE, 2022-2032 ($MILLION)
- TABLE 44. FRANCE CONTINENCE CARE PRODUCTS MARKET, BY GENDER, 2022-2032 ($MILLION)
- TABLE 45. FRANCE CONTINENCE CARE PRODUCTS MARKET, BY CATEGORY, 2022-2032 ($MILLION)
- TABLE 46. FRANCE CONTINENCE CARE PRODUCTS MARKET, BY END USER, 2022-2032 ($MILLION)
- TABLE 47. UK CONTINENCE CARE PRODUCTS MARKET, BY PRODUCT TYPE, 2022-2032 ($MILLION)
- TABLE 48. UK CONTINENCE CARE PRODUCTS MARKET, BY GENDER, 2022-2032 ($MILLION)
- TABLE 49. UK CONTINENCE CARE PRODUCTS MARKET, BY CATEGORY, 2022-2032 ($MILLION)
- TABLE 50. UK CONTINENCE CARE PRODUCTS MARKET, BY END USER, 2022-2032 ($MILLION)
- TABLE 51. ITALY CONTINENCE CARE PRODUCTS MARKET, BY PRODUCT TYPE, 2022-2032 ($MILLION)
- TABLE 52. ITALY CONTINENCE CARE PRODUCTS MARKET, BY GENDER, 2022-2032 ($MILLION)
- TABLE 53. ITALY CONTINENCE CARE PRODUCTS MARKET, BY CATEGORY, 2022-2032 ($MILLION)
- TABLE 54. ITALY CONTINENCE CARE PRODUCTS MARKET, BY END USER, 2022-2032 ($MILLION)
- TABLE 55. SPAIN CONTINENCE CARE PRODUCTS MARKET, BY PRODUCT TYPE, 2022-2032 ($MILLION)
- TABLE 56. SPAIN CONTINENCE CARE PRODUCTS MARKET, BY GENDER, 2022-2032 ($MILLION)
- TABLE 57. SPAIN CONTINENCE CARE PRODUCTS MARKET, BY CATEGORY, 2022-2032 ($MILLION)
- TABLE 58. SPAIN CONTINENCE CARE PRODUCTS MARKET, BY END USER, 2022-2032 ($MILLION)
- TABLE 59. REST OF EUROPE CONTINENCE CARE PRODUCTS MARKET, BY PRODUCT TYPE, 2022-2032 ($MILLION)
- TABLE 60. REST OF EUROPE CONTINENCE CARE PRODUCTS MARKET, BY GENDER, 2022-2032 ($MILLION)
- TABLE 61. REST OF EUROPE CONTINENCE CARE PRODUCTS MARKET, BY CATEGORY, 2022-2032 ($MILLION)
- TABLE 62. REST OF EUROPE CONTINENCE CARE PRODUCTS MARKET, BY END USER, 2022-2032 ($MILLION)
- TABLE 63. ASIA-PACIFIC CONTINENCE CARE PRODUCTS MARKET, BY PRODUCT TYPE, 2022-2032 ($MILLION)
- TABLE 64. ASIA-PACIFIC CONTINENCE CARE PRODUCTS MARKET, BY GENDER, 2022-2032 ($MILLION)
- TABLE 65. ASIA-PACIFIC CONTINENCE CARE PRODUCTS MARKET, BY CATEGORY, 2022-2032 ($MILLION)
- TABLE 66. ASIA-PACIFIC CONTINENCE CARE PRODUCTS MARKET, BY END USER, 2022-2032 ($MILLION)
- TABLE 67. ASIA-PACIFIC CONTINENCE CARE PRODUCTS MARKET, BY COUNTRY, 2022-2032 ($MILLION)
- TABLE 68. JAPAN CONTINENCE CARE PRODUCTS MARKET, BY PRODUCT TYPE, 2022-2032 ($MILLION)
- TABLE 69. JAPAN CONTINENCE CARE PRODUCTS MARKET, BY GENDER, 2022-2032 ($MILLION)
- TABLE 70. JAPAN CONTINENCE CARE PRODUCTS MARKET, BY CATEGORY, 2022-2032 ($MILLION)
- TABLE 71. JAPAN CONTINENCE CARE PRODUCTS MARKET, BY END USER, 2022-2032 ($MILLION)
- TABLE 72. CHINA CONTINENCE CARE PRODUCTS MARKET, BY PRODUCT TYPE, 2022-2032 ($MILLION)
- TABLE 73. CHINA CONTINENCE CARE PRODUCTS MARKET, BY GENDER, 2022-2032 ($MILLION)
- TABLE 74. CHINA CONTINENCE CARE PRODUCTS MARKET, BY CATEGORY, 2022-2032 ($MILLION)
- TABLE 75. CHINA CONTINENCE CARE PRODUCTS MARKET, BY END USER, 2022-2032 ($MILLION)
- TABLE 76. INDIA CONTINENCE CARE PRODUCTS MARKET, BY PRODUCT TYPE, 2022-2032 ($MILLION)
- TABLE 77. INDIA CONTINENCE CARE PRODUCTS MARKET, BY GENDER, 2022-2032 ($MILLION)
- TABLE 78. INDIA CONTINENCE CARE PRODUCTS MARKET, BY CATEGORY, 2022-2032 ($MILLION)
- TABLE 79. INDIA CONTINENCE CARE PRODUCTS MARKET, BY END USER, 2022-2032 ($MILLION)
- TABLE 80. AUSTRALIA CONTINENCE CARE PRODUCTS MARKET, BY PRODUCT TYPE, 2022-2032 ($MILLION)
- TABLE 81. AUSTRALIA CONTINENCE CARE PRODUCTS MARKET, BY GENDER, 2022-2032 ($MILLION)
- TABLE 82. AUSTRALIA CONTINENCE CARE PRODUCTS MARKET, BY CATEGORY, 2022-2032 ($MILLION)
- TABLE 83. AUSTRALIA CONTINENCE CARE PRODUCTS MARKET, BY END USER, 2022-2032 ($MILLION)
- TABLE 84. SOUTH KOREA CONTINENCE CARE PRODUCTS MARKET, BY PRODUCT TYPE, 2022-2032 ($MILLION)
- TABLE 85. SOUTH KOREA CONTINENCE CARE PRODUCTS MARKET, BY GENDER, 2022-2032 ($MILLION)
- TABLE 86. SOUTH KOREA CONTINENCE CARE PRODUCTS MARKET, BY CATEGORY, 2022-2032 ($MILLION)
- TABLE 87. SOUTH KOREA CONTINENCE CARE PRODUCTS MARKET, BY END USER, 2022-2032 ($MILLION)
- TABLE 88. REST OF ASIA-PACIFIC CONTINENCE CARE PRODUCTS MARKET, BY PRODUCT TYPE, 2022-2032 ($MILLION)
- TABLE 89. REST OF ASIA-PACIFIC CONTINENCE CARE PRODUCTS MARKET, BY GENDER, 2022-2032 ($MILLION)
- TABLE 90. REST OF ASIA-PACIFIC CONTINENCE CARE PRODUCTS MARKET, BY CATEGORY, 2022-2032 ($MILLION)
- TABLE 91. REST OF ASIA-PACIFIC CONTINENCE CARE PRODUCTS MARKET, BY END USER, 2022-2032 ($MILLION)
- TABLE 92. LATIN AMERICA CONTINENCE CARE PRODUCTS MARKET, BY PRODUCT TYPE, 2022-2032 ($MILLION)
- TABLE 93. LATIN AMERICA CONTINENCE CARE PRODUCTS MARKET, BY GENDER, 2022-2032 ($MILLION)
- TABLE 94. LATIN AMERICA CONTINENCE CARE PRODUCTS MARKET, BY CATEGORY, 2022-2032 ($MILLION)
- TABLE 95. LATIN AMERICA CONTINENCE CARE PRODUCTS MARKET, BY END USER, 2022-2032 ($MILLION)
- TABLE 96. LATIN AMERICA CONTINENCE CARE PRODUCTS MARKET, BY COUNTRY, 2022-2032 ($MILLION)
- TABLE 97. BRAZIL CONTINENCE CARE PRODUCTS MARKET, BY PRODUCT TYPE, 2022-2032 ($MILLION)
- TABLE 98. BRAZIL CONTINENCE CARE PRODUCTS MARKET, BY GENDER, 2022-2032 ($MILLION)
- TABLE 99. BRAZIL CONTINENCE CARE PRODUCTS MARKET, BY CATEGORY, 2022-2032 ($MILLION)
- TABLE 100. BRAZIL CONTINENCE CARE PRODUCTS MARKET, BY END USER, 2022-2032 ($MILLION)
- TABLE 101. COLOMBIA CONTINENCE CARE PRODUCTS MARKET, BY PRODUCT TYPE, 2022-2032 ($MILLION)
- TABLE 102. COLOMBIA CONTINENCE CARE PRODUCTS MARKET, BY GENDER, 2022-2032 ($MILLION)
- TABLE 103. COLOMBIA CONTINENCE CARE PRODUCTS MARKET, BY CATEGORY, 2022-2032 ($MILLION)
- TABLE 104. COLOMBIA CONTINENCE CARE PRODUCTS MARKET, BY END USER, 2022-2032 ($MILLION)
- TABLE 105. ARGENTINA CONTINENCE CARE PRODUCTS MARKET, BY PRODUCT TYPE, 2022-2032 ($MILLION)
- TABLE 106. ARGENTINA CONTINENCE CARE PRODUCTS MARKET, BY GENDER, 2022-2032 ($MILLION)
- TABLE 107. ARGENTINA CONTINENCE CARE PRODUCTS MARKET, BY CATEGORY, 2022-2032 ($MILLION)
- TABLE 108. ARGENTINA CONTINENCE CARE PRODUCTS MARKET, BY END USER, 2022-2032 ($MILLION)
- TABLE 109. REST OF LA CONTINENCE CARE PRODUCTS MARKET, BY PRODUCT TYPE, 2022-2032 ($MILLION)
- TABLE 110. REST OF LA CONTINENCE CARE PRODUCTS MARKET, BY GENDER, 2022-2032 ($MILLION)
- TABLE 111. REST OF LA CONTINENCE CARE PRODUCTS MARKET, BY CATEGORY, 2022-2032 ($MILLION)
- TABLE 112. REST OF LA CONTINENCE CARE PRODUCTS MARKET, BY END USER, 2022-2032 ($MILLION)
- TABLE 113. MIDDLE EAST AND AFRICA CONTINENCE CARE PRODUCTS MARKET, BY PRODUCT TYPE, 2022-2032 ($MILLION)
- TABLE 114. MIDDLE EAST AND AFRICA CONTINENCE CARE PRODUCTS MARKET, BY GENDER, 2022-2032 ($MILLION)
- TABLE 115. MIDDLE EAST AND AFRICA CONTINENCE CARE PRODUCTS MARKET, BY CATEGORY, 2022-2032 ($MILLION)
- TABLE 116. MIDDLE EAST AND AFRICA CONTINENCE CARE PRODUCTS MARKET, BY END USER, 2022-2032 ($MILLION)
- TABLE 117. MIDDLE EAST AND AFRICA CONTINENCE CARE PRODUCTS MARKET, BY COUNTRY, 2022-2032 ($MILLION)
- TABLE 118. GCC CONTINENCE CARE PRODUCTS MARKET, BY PRODUCT TYPE, 2022-2032 ($MILLION)
- TABLE 119. GCC CONTINENCE CARE PRODUCTS MARKET, BY GENDER, 2022-2032 ($MILLION)
- TABLE 120. GCC CONTINENCE CARE PRODUCTS MARKET, BY CATEGORY, 2022-2032 ($MILLION)
- TABLE 121. GCC CONTINENCE CARE PRODUCTS MARKET, BY END USER, 2022-2032 ($MILLION)
- TABLE 122. SOUTH AFRICA CONTINENCE CARE PRODUCTS MARKET, BY PRODUCT TYPE, 2022-2032 ($MILLION)
- TABLE 123. SOUTH AFRICA CONTINENCE CARE PRODUCTS MARKET, BY GENDER, 2022-2032 ($MILLION)
- TABLE 124. SOUTH AFRICA CONTINENCE CARE PRODUCTS MARKET, BY CATEGORY, 2022-2032 ($MILLION)
- TABLE 125. SOUTH AFRICA CONTINENCE CARE PRODUCTS MARKET, BY END USER, 2022-2032 ($MILLION)
- TABLE 126. NORTH AFRICA CONTINENCE CARE PRODUCTS MARKET, BY PRODUCT TYPE, 2022-2032 ($MILLION)
- TABLE 127. NORTH AFRICA CONTINENCE CARE PRODUCTS MARKET, BY GENDER, 2022-2032 ($MILLION)
- TABLE 128. NORTH AFRICA CONTINENCE CARE PRODUCTS MARKET, BY CATEGORY, 2022-2032 ($MILLION)
- TABLE 129. NORTH AFRICA CONTINENCE CARE PRODUCTS MARKET, BY END USER, 2022-2032 ($MILLION)
- TABLE 130. REST OF MEA CONTINENCE CARE PRODUCTS MARKET, BY PRODUCT TYPE, 2022-2032 ($MILLION)
- TABLE 131. REST OF MEA CONTINENCE CARE PRODUCTS MARKET, BY GENDER, 2022-2032 ($MILLION)
- TABLE 132. REST OF MEA CONTINENCE CARE PRODUCTS MARKET, BY CATEGORY, 2022-2032 ($MILLION)
- TABLE 133. REST OF MEA CONTINENCE CARE PRODUCTS MARKET, BY END USER, 2022-2032 ($MILLION)
- TABLE 134. HOLLISTER INCORPORATED: KEY EXECUTIVES
- TABLE 135. HOLLISTER INCORPORATED: COMPANY SNAPSHOT
- TABLE 136. HOLLISTER INCORPORATED: PRODUCT SEGMENTS
- TABLE 137. HOLLISTER INCORPORATED: SERVICE SEGMENTS
- TABLE 138. HOLLISTER INCORPORATED: PRODUCT PORTFOLIO
- TABLE 139. HOLLISTER INCORPORATED: KEY STRATERGIES
- TABLE 140. COLOPLAST GROUP: KEY EXECUTIVES
- TABLE 141. COLOPLAST GROUP: COMPANY SNAPSHOT
- TABLE 142. COLOPLAST GROUP: PRODUCT SEGMENTS
- TABLE 143. COLOPLAST GROUP: SERVICE SEGMENTS
- TABLE 144. COLOPLAST GROUP: PRODUCT PORTFOLIO
- TABLE 145. COLOPLAST GROUP: KEY STRATERGIES
- TABLE 146. CONVATEC GROUP PLC: KEY EXECUTIVES
- TABLE 147. CONVATEC GROUP PLC: COMPANY SNAPSHOT
- TABLE 148. CONVATEC GROUP PLC: PRODUCT SEGMENTS
- TABLE 149. CONVATEC GROUP PLC: SERVICE SEGMENTS
- TABLE 150. CONVATEC GROUP PLC: PRODUCT PORTFOLIO
- TABLE 151. CONVATEC GROUP PLC: KEY STRATERGIES
- TABLE 152. BD (BECTON, DICKINSON AND COMPANY): KEY EXECUTIVES
- TABLE 153. BD (BECTON, DICKINSON AND COMPANY): COMPANY SNAPSHOT
- TABLE 154. BD (BECTON, DICKINSON AND COMPANY): PRODUCT SEGMENTS
- TABLE 155. BD (BECTON, DICKINSON AND COMPANY): SERVICE SEGMENTS
- TABLE 156. BD (BECTON, DICKINSON AND COMPANY): PRODUCT PORTFOLIO
- TABLE 157. BD (BECTON, DICKINSON AND COMPANY): KEY STRATERGIES
- TABLE 158. WELLSPECT HEALTHCARE AB: KEY EXECUTIVES
- TABLE 159. WELLSPECT HEALTHCARE AB: COMPANY SNAPSHOT
- TABLE 160. WELLSPECT HEALTHCARE AB: PRODUCT SEGMENTS
- TABLE 161. WELLSPECT HEALTHCARE AB: SERVICE SEGMENTS
- TABLE 162. WELLSPECT HEALTHCARE AB: PRODUCT PORTFOLIO
- TABLE 163. WELLSPECT HEALTHCARE AB: KEY STRATERGIES
- TABLE 164. ESSITY: KEY EXECUTIVES
- TABLE 165. ESSITY: COMPANY SNAPSHOT
- TABLE 166. ESSITY: PRODUCT SEGMENTS
- TABLE 167. ESSITY: SERVICE SEGMENTS
- TABLE 168. ESSITY: PRODUCT PORTFOLIO
- TABLE 169. ESSITY: KEY STRATERGIES
- TABLE 170. BOSTON SCIENTIFIC CORPORATION: KEY EXECUTIVES
- TABLE 171. BOSTON SCIENTIFIC CORPORATION: COMPANY SNAPSHOT
- TABLE 172. BOSTON SCIENTIFIC CORPORATION: PRODUCT SEGMENTS
- TABLE 173. BOSTON SCIENTIFIC CORPORATION: SERVICE SEGMENTS
- TABLE 174. BOSTON SCIENTIFIC CORPORATION: PRODUCT PORTFOLIO
- TABLE 175. BOSTON SCIENTIFIC CORPORATION: KEY STRATERGIES
- TABLE 176. ETHICON: KEY EXECUTIVES
- TABLE 177. ETHICON: COMPANY SNAPSHOT
- TABLE 178. ETHICON: PRODUCT SEGMENTS
- TABLE 179. ETHICON: SERVICE SEGMENTS
- TABLE 180. ETHICON: PRODUCT PORTFOLIO
- TABLE 181. ETHICON: KEY STRATERGIES
- TABLE 182. ASTRATECH: KEY EXECUTIVES
- TABLE 183. ASTRATECH: COMPANY SNAPSHOT
- TABLE 184. ASTRATECH: PRODUCT SEGMENTS
- TABLE 185. ASTRATECH: SERVICE SEGMENTS
- TABLE 186. ASTRATECH: PRODUCT PORTFOLIO
- TABLE 187. ASTRATECH: KEY STRATERGIES
- TABLE 188. TYCO: KEY EXECUTIVES
- TABLE 189. TYCO: COMPANY SNAPSHOT
- TABLE 190. TYCO: PRODUCT SEGMENTS
- TABLE 191. TYCO: SERVICE SEGMENTS
- TABLE 192. TYCO: PRODUCT PORTFOLIO
- TABLE 193. TYCO: KEY STRATERGIES
LIST OF FIGURES
- FIGURE 01. CONTINENCE CARE PRODUCTS MARKET, 2022-2032
- FIGURE 02. SEGMENTATION OF CONTINENCE CARE PRODUCTS MARKET,2022-2032
- FIGURE 03. TOP IMPACTING FACTORS IN CONTINENCE CARE PRODUCTS MARKET
- FIGURE 04. TOP INVESTMENT POCKETS IN CONTINENCE CARE PRODUCTS MARKET (2023-2032)
- FIGURE 05. BARGAINING POWER OF SUPPLIERS
- FIGURE 06. BARGAINING POWER OF BUYERS
- FIGURE 07. THREAT OF SUBSTITUTION
- FIGURE 08. THREAT OF SUBSTITUTION
- FIGURE 09. COMPETITIVE RIVALRY
- FIGURE 10. GLOBAL CONTINENCE CARE PRODUCTS MARKET:DRIVERS, RESTRAINTS AND OPPORTUNITIES
- FIGURE 11. CONTINENCE CARE PRODUCTS MARKET, BY PRODUCT TYPE, 2022 AND 2032(%)
- FIGURE 12. COMPARATIVE SHARE ANALYSIS OF CONTINENCE CARE PRODUCTS MARKET FOR URINARY CATHETERS, BY COUNTRY 2022 AND 2032(%)
- FIGURE 13. COMPARATIVE SHARE ANALYSIS OF CONTINENCE CARE PRODUCTS MARKET FOR URINARY BAGS AND POUCH, BY COUNTRY 2022 AND 2032(%)
- FIGURE 14. COMPARATIVE SHARE ANALYSIS OF CONTINENCE CARE PRODUCTS MARKET FOR ABSORBENT PRODUCTS, BY COUNTRY 2022 AND 2032(%)
- FIGURE 15. COMPARATIVE SHARE ANALYSIS OF CONTINENCE CARE PRODUCTS MARKET FOR OTHERS, BY COUNTRY 2022 AND 2032(%)
- FIGURE 16. CONTINENCE CARE PRODUCTS MARKET, BY GENDER, 2022 AND 2032(%)
- FIGURE 17. COMPARATIVE SHARE ANALYSIS OF CONTINENCE CARE PRODUCTS MARKET FOR MALE, BY COUNTRY 2022 AND 2032(%)
- FIGURE 18. COMPARATIVE SHARE ANALYSIS OF CONTINENCE CARE PRODUCTS MARKET FOR FEMALE, BY COUNTRY 2022 AND 2032(%)
- FIGURE 19. CONTINENCE CARE PRODUCTS MARKET, BY CATEGORY, 2022 AND 2032(%)
- FIGURE 20. COMPARATIVE SHARE ANALYSIS OF CONTINENCE CARE PRODUCTS MARKET FOR DISPOSABLE, BY COUNTRY 2022 AND 2032(%)
- FIGURE 21. COMPARATIVE SHARE ANALYSIS OF CONTINENCE CARE PRODUCTS MARKET FOR REUSABLE, BY COUNTRY 2022 AND 2032(%)
- FIGURE 22. CONTINENCE CARE PRODUCTS MARKET, BY END USER, 2022 AND 2032(%)
- FIGURE 23. COMPARATIVE SHARE ANALYSIS OF CONTINENCE CARE PRODUCTS MARKET FOR HOSPITALS AND CLINICS, BY COUNTRY 2022 AND 2032(%)
- FIGURE 24. COMPARATIVE SHARE ANALYSIS OF CONTINENCE CARE PRODUCTS MARKET FOR HOME CARE, BY COUNTRY 2022 AND 2032(%)
- FIGURE 25. COMPARATIVE SHARE ANALYSIS OF CONTINENCE CARE PRODUCTS MARKET FOR OTHERS, BY COUNTRY 2022 AND 2032(%)
- FIGURE 26. CONTINENCE CARE PRODUCTS MARKET BY REGION, 2022 AND 2032(%)
- FIGURE 27. U.S. CONTINENCE CARE PRODUCTS MARKET, 2022-2032 ($MILLION)
- FIGURE 28. CANADA CONTINENCE CARE PRODUCTS MARKET, 2022-2032 ($MILLION)
- FIGURE 29. MEXICO CONTINENCE CARE PRODUCTS MARKET, 2022-2032 ($MILLION)
- FIGURE 30. GERMANY CONTINENCE CARE PRODUCTS MARKET, 2022-2032 ($MILLION)
- FIGURE 31. FRANCE CONTINENCE CARE PRODUCTS MARKET, 2022-2032 ($MILLION)
- FIGURE 32. UK CONTINENCE CARE PRODUCTS MARKET, 2022-2032 ($MILLION)
- FIGURE 33. ITALY CONTINENCE CARE PRODUCTS MARKET, 2022-2032 ($MILLION)
- FIGURE 34. SPAIN CONTINENCE CARE PRODUCTS MARKET, 2022-2032 ($MILLION)
- FIGURE 35. REST OF EUROPE CONTINENCE CARE PRODUCTS MARKET, 2022-2032 ($MILLION)
- FIGURE 36. JAPAN CONTINENCE CARE PRODUCTS MARKET, 2022-2032 ($MILLION)
- FIGURE 37. CHINA CONTINENCE CARE PRODUCTS MARKET, 2022-2032 ($MILLION)
- FIGURE 38. INDIA CONTINENCE CARE PRODUCTS MARKET, 2022-2032 ($MILLION)
- FIGURE 39. AUSTRALIA CONTINENCE CARE PRODUCTS MARKET, 2022-2032 ($MILLION)
- FIGURE 40. SOUTH KOREA CONTINENCE CARE PRODUCTS MARKET, 2022-2032 ($MILLION)
- FIGURE 41. REST OF ASIA-PACIFIC CONTINENCE CARE PRODUCTS MARKET, 2022-2032 ($MILLION)
- FIGURE 42. BRAZIL CONTINENCE CARE PRODUCTS MARKET, 2022-2032 ($MILLION)
- FIGURE 43. COLOMBIA CONTINENCE CARE PRODUCTS MARKET, 2022-2032 ($MILLION)
- FIGURE 44. ARGENTINA CONTINENCE CARE PRODUCTS MARKET, 2022-2032 ($MILLION)
- FIGURE 45. REST OF LA CONTINENCE CARE PRODUCTS MARKET, 2022-2032 ($MILLION)
- FIGURE 46. GCC CONTINENCE CARE PRODUCTS MARKET, 2022-2032 ($MILLION)
- FIGURE 47. SOUTH AFRICA CONTINENCE CARE PRODUCTS MARKET, 2022-2032 ($MILLION)
- FIGURE 48. NORTH AFRICA CONTINENCE CARE PRODUCTS MARKET, 2022-2032 ($MILLION)
- FIGURE 49. REST OF MEA CONTINENCE CARE PRODUCTS MARKET, 2022-2032 ($MILLION)
- FIGURE 50. TOP WINNING STRATEGIES, BY YEAR
- FIGURE 51. TOP WINNING STRATEGIES, BY DEVELOPMENT
- FIGURE 52. TOP WINNING STRATEGIES, BY COMPANY
- FIGURE 53. PRODUCT MAPPING OF TOP 10 PLAYERS
- FIGURE 54. COMPETITIVE DASHBOARD
- FIGURE 55. COMPETITIVE HEATMAP: CONTINENCE CARE PRODUCTS MARKET
- FIGURE 56. TOP PLAYER POSITIONING, 2022
 全球大陆护理产品市场:规模、份额、趋势分析报告、展望和预测(按性别、最终用户、产品类型、类别、地区划分,2024-2031 年)
 失禁器具的开发平台(管线) - 开发阶段,市场区隔,地区和国家,法规途径,主要企业(2024年版)
 可重复使用失禁产品市场:依产品类型、最终用户、地区(北美、欧洲、亚太地区、拉丁美洲、中东非洲)、规模、占有率、成长、趋势、预测(2024-2032)进行的全球产业分析
 失禁护理市场规模和预测、全球和地区份额、趋势和成长机会分析报告范围:按产品、类型、最终用户和地理位置
 一次性失禁产品的全球市场规模、份额和趋势分析报告:2023-2030 年失禁类型、产品和地区的展望和预测
 2024 年一次性失禁产品全球市场报告
 失禁产品市场报告:2030 年趋势、预测与竞争分析
 一次性失禁产品市场 - 2018-2028 年全球产业规模、份额、趋势、机会和预测,按产品类型、地区按应用和竞争细分
 失禁垫市场 - 2018-2028 年全球产业规模、份额、趋势、机会与预测,按产品类型、病患、最终用途产业、配销通路、地区、竞争细分
 失禁护理产品的全球市场 (ICP) (~2028):产品(吸收性(床保护器、护垫和防护装置)、非吸收性(导管、引流袋))、用途(可重复使用/一次性) 、配销通路(电子-商业)和最终用户(医院)