


 |
市场调查报告书
商品编码
1472297
全球睪酮替代疗法市场:按产品类型、活性成分和最终用户 - 机会分析和产业预测,2023-2032Testosterone Replacement Therapy Market By Product Type, By Active ingredients, By End User : Global Opportunity Analysis and Industry Forecast, 2023-2032 |
||||||
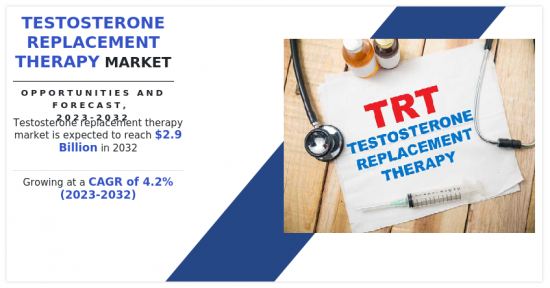
全球睪固酮替代疗法市场规模预计到2022年将达到19亿美元,2023年至2032年复合年增长率为4.2%,2032年将达到29亿美元。
睾酮替代疗法是一种旨在解决睾酮水平低下问题的医疗干预措施。睪固酮是一种重要的激素,负责男性生殖组织的发育和维持男性特征,如肌肉质量、骨骼密度和脸部毛髮。随着男性年龄的增长,他们的睪固酮水平往往会自然下降,导致各种症状,包括疲劳、性慾下降和肌肉质量损失。睪固酮替代疗法包括透过注射、贴片、凝胶或植入皮下的颗粒来施用外源性睪固酮。其目的是将睪酮水平恢復到正常范围并减轻相关症状。
睪固酮替代疗法市场的成长归因于性腺功能减退症盛行率的上升以及肥胖、糖尿病和METABOLIC INC.症候群等慢性疾病发病率的上升,这些疾病与低睪固酮水平的风险增加有关。近年来,性腺功能减退症的盛行率显着上升,并已成为睾酮替代疗法市场成长的关键驱动力。性腺功能减退症的特征是睪丸中睪酮生成不足,影响很大一部分男性群体,尤其是随着老龄化。例如,国家医学图书馆 2021 年的一份报告估计,中老年男性性腺功能减退症的盛行率在 2.1% 至 38.7% 之间。睾酮替代疗法已成为医疗保健专业人员解决与性腺功能减退症相关的荷尔蒙失衡的主要选择。因此,性腺功能减退症盛行率的增加预计将推动市场成长。
此外,导致睪固酮水平低下的肥胖和糖尿病等慢性疾病发病率的增加预计将推动市场成长。糖尿病、肥胖和心血管疾病等慢性疾病在世界各地变得越来越普遍,导致荷尔蒙失衡、尤其是睪固酮水平低下的人数急剧增加。科学研究已经确定了慢性疾病与睪固酮生成减少之间的直接相关性,从而产生了大量寻求有效治疗性介入来治疗睪固酮水平低下的患者群体。美国国家医学图书馆 2023 年的报告指出,男性肥胖与荷尔蒙失调有关,荷尔蒙失调会导致荷尔蒙和生殖性腺功能受损。据报导,高达 45% 的中度至重度肥胖患者患有与肥胖相关的性腺功能减退症。因此,肥胖和糖尿病等慢性病发病率的增加预计将推动睾酮替代疗法市场的成长。然而,与化学换肤和光疗相关的副作用正在限制市场的成长。美国心臟学会基金会 2023 年的报告显示,在接受睪固酮替代疗法的受试者中,肺动脉栓塞、非致命性心律不整、心房颤动和急性损伤的发生率较高。
睪固酮替代疗法市场按产品类型、活性成分、最终用户和地区细分。依产品类型划分,市场分为注射剂、外用药物等。其他产品类型包括口服、植入和鼻腔製剂。依活性成分划分,市场分为环丙酸睪酮、睪酮、庚酸睪酮、十一酸睪酮等。依最终使用者分为医院和诊所。按地区划分:北美(美国、加拿大、墨西哥)、欧洲(德国、法国、英国、义大利、西班牙、欧洲其他地区)、亚太地区(日本、中国、澳洲、印度、韩国、亚太地区其他地区) )、欧洲(巴西、哥伦比亚、阿根廷和亚太其他地区)和中东/非洲(海湾合作委员会、南美洲、北非和中东/非洲其他地区)。
相关人员的主要利益
- 本报告定量分析了 2022 年至 2032 年睾酮替代疗法市场分析的细分市场、当前趋势、估计/趋势和动态,以确定主要的睾酮替代疗法市场机会。
- 我们提供市场研究以及与市场驱动因素、市场限制和市场机会相关的资讯。
- 波特的五力分析强调买家和供应商帮助相关人员做出利润驱动的商业决策并加强供应商-买家网路的潜力。
- 对睾酮替代疗法市场细分的详细分析有助于识别市场机会。
- 每个地区的主要国家都根据其对全球市场的收益贡献绘製了地图。
- 市场参与者定位有助于基准化分析,并提供对市场参与者当前地位的清晰了解。
- 该报告包括对区域和全球睾酮替代疗法市场趋势、主要企业、细分市场、应用领域和市场成长策略的分析。
可以使用此报告进行定制
- 监管指引
- 根据客户兴趣加入公司简介
- 按国家或地区进行的附加分析 – 市场规模和预测
- 公司简介的扩充列表
- 历史市场资料
- 主要参与者的详细资料(Excel格式,包括位置、联络资讯、供应商/供应商网路等)
目录
第一章简介
第 2 章执行摘要
第三章市场概况
- 市场定义和范围
- 主要发现
- 影响因素
- 主要投资机会
- 波特五力分析
- 市场动态
- 促进因素
- 抑制因素
- 机会
第四章睾酮替代疗法市场:依产品类型
- 概述
- 注射
- 外用製剂
- 其他的
第五章睪酮替代疗法市场:依活性成分分类
- 概述
- 环丙酸睪酮
- 睪固酮
- 庚酸睪酮
- 十一酸睪酮
- 其他的
第六章 睪固酮替代疗法市场:依最终用户分类
- 概述
- 医院
- 诊所
第七章 睪酮替代治疗市场:按地区
- 概述
- 北美洲
- 美国
- 加拿大
- 墨西哥
- 欧洲
- 德国
- 法国
- 英国
- 义大利
- 西班牙
- 欧洲其他地区
- 亚太地区
- 日本
- 中国
- 印度
- 澳洲
- 韩国
- 其他亚太地区
- 拉丁美洲
- 巴西
- 哥伦比亚
- 阿根廷
- 其他拉丁美洲
- 中东/非洲
- GCC
- 南非
- 北非
- 其他中东/非洲
第八章 竞争格局
- 介绍
- 关键成功策略
- 10家主要企业产品图谱
- 竞争对手仪表板
- 竞争热图
- 2022年主要企业定位
第九章 公司简介
- AbbVie Inc.
- Besins Healthcare SA
- Acerus Pharmaceuticals Corporation
- Amneal Pharmaceuticals Inc.
- Acrux Ltd.
- Endo International plc.
- Biote Medical LLC
- Insud Pharma SL
- Marius Pharmaceuticals
- Pfizer Inc.
The global testosterone replacement therapy market was valued at $1.9 billion in 2022, and is projected to reach $2.9 billion by 2032, growing at a CAGR of 4.2% from 2023 to 2032.
Testosterone replacement therapy is a medical intervention designed to address low levels of testosterone. Testosterone is a crucial hormone responsible for the development of male reproductive tissues and the maintenance of male characteristics, such as muscle mass, bone density, and facial hair. As men age, testosterone levels tend to decline naturally, leading to various symptoms such as fatigue, reduced libido, and loss of muscle mass. Testosterone replacement therapy involves the administration of exogenous testosterone through methods such as injections, patches, gels, or pellets implanted under the skin. The goal is to restore testosterone levels to a normal range and alleviate associated symptoms.
The testosterone replacement therapy market growth is attributed rise in prevalence of hypogonadism and the rising incidence of chronic diseases such as obesity, diabetes, and metabolic syndrome, which are associated with an increased risk of low testosterone levels. The prevalence of hypogonadism has witnessed a notable rise in recent years, emerging as a significant driver for the growth of testosterone replacement therapy market. Hypogonadism, characterized by the insufficient production of testosterone in the testes, affects a considerable portion of the male population, particularly as they age. For instance, according to 2021 report by National Library of Medicine, it was estimated that the prevalence of hypogonadism in middle-aged and older men varies between 2.1% and 38.7%. Testosterone replacement therapy has become a primary choice for healthcare professionals in addressing the hormonal imbalances associated with hypogonadism. Thus, a rise in prevalence of hypogonadism is expected to drive the growth of the market.
In addition, rise in incidence of chronic diseases such as obesity and diabetes which causes low testosterone is expected to drive the market growth. Chronic diseases, including diabetes, obesity, and cardiovascular ailments, have become increasingly prevalent worldwide, contributing to a surge in individuals experiencing hormonal imbalances, particularly low testosterone levels. Scientific studies have established a direct correlation between chronic illnesses and reduced testosterone production, creating a substantial patient pool seeking effective therapeutic interventions to treat low testosterone levels. According to 2023 report by National Library of Medicine, it was reported that male obesity is linked to hormonal disturbances leading to impaired gonadal functions, both hormonal and reproductive. Male obesity-related hypogonadism has been reported in up to 45% of patients with moderate to severe obesity. Thus, rise in incidence of chronic diseases, such as obesity and diabetes, is expected to drive the growth of the testosterone replacement therapy market. However, side effects associated with the chemical peels and photo therapy restrain the growth of the market. According to the 2023 report by American College of Cardiology Foundation, it was reported that the incidence of pulmonary embolism, nonfatal arrhythmia, atrial fibrillation, and acute injury was higher in subjects who received testosterone replacement therapy.
The testosterone replacement therapy market is segmented on the basis of product type, active ingredient, end user, and region. By product type, the market is classified into injectables, topical, and others. Other product types include oral, implant, and intranasal formulations. By active ingredient, the market is divided into testosterone cypionate, testosterone, testosterone enanthate, testosterone undecanoate, others. By end user, it is segregated into hospitals, and clinics. Region-wise, the market is analyzed across North America (the U.S., Canada, and Mexico), Europe (Germany, France, the UK, Italy, Spain, and rest of Europe), Asia-Pacific (Japan, China, Australia, India, South Korea, and rest of Asia-Pacific), LA (Brazil, Colombia, Argentina, and rest of LA), and MEA (GCC, South Africa, North Africa, and rest of MEA).
Major key players that operate in the testosterone replacement therapy market are AbbVie Inc, Besins Healthcare SA, Acerus Pharmaceuticals Corporation, Amneal Pharmaceuticals Inc., Acrux Ltd., Endo International Plc, Biote Medical, LLC, Pfizer Inc., Insud Pharma S.L, and Marius Pharmaceuticals. Key players have adopted acquisition as a key developmental strategy to improve the product portfolio of the testosterone replacement therapy market
Key Benefits For Stakeholders
- This report provides a quantitative analysis of the market segments, current trends, estimations, and dynamics of the testosterone replacement therapy market analysis from 2022 to 2032 to identify the prevailing testosterone replacement therapy market opportunities.
- The market research is offered along with information related to key drivers, restraints, and opportunities.
- Porter's five forces analysis highlights the potency of buyers and suppliers to enable stakeholders make profit-oriented business decisions and strengthen their supplier-buyer network.
- In-depth analysis of the testosterone replacement therapy market segmentation assists to determine the prevailing market opportunities.
- Major countries in each region are mapped according to their revenue contribution to the global market.
- Market player positioning facilitates benchmarking and provides a clear understanding of the present position of the market players.
- The report includes the analysis of the regional as well as global testosterone replacement therapy market trends, key players, market segments, application areas, and market growth strategies.
Additional benefits you will get with this purchase are:
- Quarterly Update and* (only available with a corporate license, on listed price)
- 5 additional Company Profile of client Choice pre- or Post-purchase, as a free update.
- Free Upcoming Version on the Purchase of Five and Enterprise User License.
- 16 analyst hours of support* (post-purchase, if you find additional data requirements upon review of the report, you may receive support amounting to 16 analyst hours to solve questions, and post-sale queries)
- 15% Free Customization* (in case the scope or segment of the report does not match your requirements, 15% is equivalent to 3 working days of free work, applicable once)
- Free data Pack on the Five and Enterprise User License. (Excel version of the report)
- Free Updated report if the report is 6-12 months old or older.
- 24-hour priority response*
- Free Industry updates and white papers.
Possible Customization with this report (with additional cost and timeline, please talk to the sales executive to know more)
- Regulatory Guidelines
- Additional company profiles with specific to client's interest
- Additional country or region analysis- market size and forecast
- Expanded list for Company Profiles
- Historic market data
- Key player details (including location, contact details, supplier/vendor network etc. in excel format)
Key Market Segments
By Product Type
- Injectables
- Topical
- Others
By Active ingredients
- Testosterone Undecanoate
- Others
- Testosterone Cypionate
- Testosterone
- Testosterone Enanthate
By End User
- Hospital
- Clinics
By Region
- North America
- U.S.
- Canada
- Mexico
- Europe
- Germany
- France
- UK
- Italy
- Spain
- Rest of Europe
- Asia-Pacific
- Japan
- China
- India
- Australia
- South Korea
- Rest of Asia-Pacific
- Latin America
- Brazil
- Colombia
- Argentina
- Rest of Latin America
- Middle East and Africa
- Gcc
- South Africa
- North Africa
- Rest Of Mea
Key Market Players:
- AbbVie Inc.
- Besins Healthcare SA
- Acerus Pharmaceuticals Corporation
- Amneal Pharmaceuticals Inc.
- Acrux Ltd.
- Endo International plc.
- Biote Medical LLC
- Insud Pharma S.L
- Marius Pharmaceuticals
- Pfizer Inc.
TABLE OF CONTENTS
CHAPTER 1: INTRODUCTION
- 1.1. Report description
- 1.2. Key market segments
- 1.3. Key benefits to the stakeholders
- 1.4. Research methodology
- 1.4.1. Primary research
- 1.4.2. Secondary research
- 1.4.3. Analyst tools and models
CHAPTER 2: EXECUTIVE SUMMARY
- 2.1. CXO perspective
CHAPTER 3: MARKET OVERVIEW
- 3.1. Market definition and scope
- 3.2. Key findings
- 3.2.1. Top impacting factors
- 3.2.2. Top investment pockets
- 3.3. Porter's five forces analysis
- 3.4. Market dynamics
- 3.4.1. Drivers
- 3.4.2. Restraints
- 3.4.3. Opportunities
CHAPTER 4: TESTOSTERONE REPLACEMENT THERAPY MARKET, BY PRODUCT TYPE
- 4.1. Overview
- 4.1.1. Market size and forecast
- 4.2. Injectables
- 4.2.1. Key market trends, growth factors and opportunities
- 4.2.2. Market size and forecast, by region
- 4.2.3. Market share analysis by country
- 4.3. Topical
- 4.3.1. Key market trends, growth factors and opportunities
- 4.3.2. Market size and forecast, by region
- 4.3.3. Market share analysis by country
- 4.4. Others
- 4.4.1. Key market trends, growth factors and opportunities
- 4.4.2. Market size and forecast, by region
- 4.4.3. Market share analysis by country
CHAPTER 5: TESTOSTERONE REPLACEMENT THERAPY MARKET, BY ACTIVE INGREDIENTS
- 5.1. Overview
- 5.1.1. Market size and forecast
- 5.2. Testosterone Cypionate
- 5.2.1. Key market trends, growth factors and opportunities
- 5.2.2. Market size and forecast, by region
- 5.2.3. Market share analysis by country
- 5.3. Testosterone
- 5.3.1. Key market trends, growth factors and opportunities
- 5.3.2. Market size and forecast, by region
- 5.3.3. Market share analysis by country
- 5.4. Testosterone Enanthate
- 5.4.1. Key market trends, growth factors and opportunities
- 5.4.2. Market size and forecast, by region
- 5.4.3. Market share analysis by country
- 5.5. Testosterone Undecanoate
- 5.5.1. Key market trends, growth factors and opportunities
- 5.5.2. Market size and forecast, by region
- 5.5.3. Market share analysis by country
- 5.6. Others
- 5.6.1. Key market trends, growth factors and opportunities
- 5.6.2. Market size and forecast, by region
- 5.6.3. Market share analysis by country
CHAPTER 6: TESTOSTERONE REPLACEMENT THERAPY MARKET, BY END USER
- 6.1. Overview
- 6.1.1. Market size and forecast
- 6.2. Hospital
- 6.2.1. Key market trends, growth factors and opportunities
- 6.2.2. Market size and forecast, by region
- 6.2.3. Market share analysis by country
- 6.3. Clinics
- 6.3.1. Key market trends, growth factors and opportunities
- 6.3.2. Market size and forecast, by region
- 6.3.3. Market share analysis by country
CHAPTER 7: TESTOSTERONE REPLACEMENT THERAPY MARKET, BY REGION
- 7.1. Overview
- 7.1.1. Market size and forecast By Region
- 7.2. North America
- 7.2.1. Key market trends, growth factors and opportunities
- 7.2.2. Market size and forecast, by Product Type
- 7.2.3. Market size and forecast, by Active ingredients
- 7.2.4. Market size and forecast, by End User
- 7.2.5. Market size and forecast, by country
- 7.2.5.1. U.S.
- 7.2.5.1.1. Market size and forecast, by Product Type
- 7.2.5.1.2. Market size and forecast, by Active ingredients
- 7.2.5.1.3. Market size and forecast, by End User
- 7.2.5.2. Canada
- 7.2.5.2.1. Market size and forecast, by Product Type
- 7.2.5.2.2. Market size and forecast, by Active ingredients
- 7.2.5.2.3. Market size and forecast, by End User
- 7.2.5.3. Mexico
- 7.2.5.3.1. Market size and forecast, by Product Type
- 7.2.5.3.2. Market size and forecast, by Active ingredients
- 7.2.5.3.3. Market size and forecast, by End User
- 7.3. Europe
- 7.3.1. Key market trends, growth factors and opportunities
- 7.3.2. Market size and forecast, by Product Type
- 7.3.3. Market size and forecast, by Active ingredients
- 7.3.4. Market size and forecast, by End User
- 7.3.5. Market size and forecast, by country
- 7.3.5.1. Germany
- 7.3.5.1.1. Market size and forecast, by Product Type
- 7.3.5.1.2. Market size and forecast, by Active ingredients
- 7.3.5.1.3. Market size and forecast, by End User
- 7.3.5.2. France
- 7.3.5.2.1. Market size and forecast, by Product Type
- 7.3.5.2.2. Market size and forecast, by Active ingredients
- 7.3.5.2.3. Market size and forecast, by End User
- 7.3.5.3. UK
- 7.3.5.3.1. Market size and forecast, by Product Type
- 7.3.5.3.2. Market size and forecast, by Active ingredients
- 7.3.5.3.3. Market size and forecast, by End User
- 7.3.5.4. Italy
- 7.3.5.4.1. Market size and forecast, by Product Type
- 7.3.5.4.2. Market size and forecast, by Active ingredients
- 7.3.5.4.3. Market size and forecast, by End User
- 7.3.5.5. Spain
- 7.3.5.5.1. Market size and forecast, by Product Type
- 7.3.5.5.2. Market size and forecast, by Active ingredients
- 7.3.5.5.3. Market size and forecast, by End User
- 7.3.5.6. Rest of Europe
- 7.3.5.6.1. Market size and forecast, by Product Type
- 7.3.5.6.2. Market size and forecast, by Active ingredients
- 7.3.5.6.3. Market size and forecast, by End User
- 7.4. Asia-Pacific
- 7.4.1. Key market trends, growth factors and opportunities
- 7.4.2. Market size and forecast, by Product Type
- 7.4.3. Market size and forecast, by Active ingredients
- 7.4.4. Market size and forecast, by End User
- 7.4.5. Market size and forecast, by country
- 7.4.5.1. Japan
- 7.4.5.1.1. Market size and forecast, by Product Type
- 7.4.5.1.2. Market size and forecast, by Active ingredients
- 7.4.5.1.3. Market size and forecast, by End User
- 7.4.5.2. China
- 7.4.5.2.1. Market size and forecast, by Product Type
- 7.4.5.2.2. Market size and forecast, by Active ingredients
- 7.4.5.2.3. Market size and forecast, by End User
- 7.4.5.3. India
- 7.4.5.3.1. Market size and forecast, by Product Type
- 7.4.5.3.2. Market size and forecast, by Active ingredients
- 7.4.5.3.3. Market size and forecast, by End User
- 7.4.5.4. Australia
- 7.4.5.4.1. Market size and forecast, by Product Type
- 7.4.5.4.2. Market size and forecast, by Active ingredients
- 7.4.5.4.3. Market size and forecast, by End User
- 7.4.5.5. South Korea
- 7.4.5.5.1. Market size and forecast, by Product Type
- 7.4.5.5.2. Market size and forecast, by Active ingredients
- 7.4.5.5.3. Market size and forecast, by End User
- 7.4.5.6. Rest of Asia-Pacific
- 7.4.5.6.1. Market size and forecast, by Product Type
- 7.4.5.6.2. Market size and forecast, by Active ingredients
- 7.4.5.6.3. Market size and forecast, by End User
- 7.5. Latin America
- 7.5.1. Key market trends, growth factors and opportunities
- 7.5.2. Market size and forecast, by Product Type
- 7.5.3. Market size and forecast, by Active ingredients
- 7.5.4. Market size and forecast, by End User
- 7.5.5. Market size and forecast, by country
- 7.5.5.1. Brazil
- 7.5.5.1.1. Market size and forecast, by Product Type
- 7.5.5.1.2. Market size and forecast, by Active ingredients
- 7.5.5.1.3. Market size and forecast, by End User
- 7.5.5.2. Colombia
- 7.5.5.2.1. Market size and forecast, by Product Type
- 7.5.5.2.2. Market size and forecast, by Active ingredients
- 7.5.5.2.3. Market size and forecast, by End User
- 7.5.5.3. Argentina
- 7.5.5.3.1. Market size and forecast, by Product Type
- 7.5.5.3.2. Market size and forecast, by Active ingredients
- 7.5.5.3.3. Market size and forecast, by End User
- 7.5.5.4. Rest of Latin America
- 7.5.5.4.1. Market size and forecast, by Product Type
- 7.5.5.4.2. Market size and forecast, by Active ingredients
- 7.5.5.4.3. Market size and forecast, by End User
- 7.6. Middle East and Africa
- 7.6.1. Key market trends, growth factors and opportunities
- 7.6.2. Market size and forecast, by Product Type
- 7.6.3. Market size and forecast, by Active ingredients
- 7.6.4. Market size and forecast, by End User
- 7.6.5. Market size and forecast, by country
- 7.6.5.1. Gcc
- 7.6.5.1.1. Market size and forecast, by Product Type
- 7.6.5.1.2. Market size and forecast, by Active ingredients
- 7.6.5.1.3. Market size and forecast, by End User
- 7.6.5.2. South Africa
- 7.6.5.2.1. Market size and forecast, by Product Type
- 7.6.5.2.2. Market size and forecast, by Active ingredients
- 7.6.5.2.3. Market size and forecast, by End User
- 7.6.5.3. North Africa
- 7.6.5.3.1. Market size and forecast, by Product Type
- 7.6.5.3.2. Market size and forecast, by Active ingredients
- 7.6.5.3.3. Market size and forecast, by End User
- 7.6.5.4. Rest Of Mea
- 7.6.5.4.1. Market size and forecast, by Product Type
- 7.6.5.4.2. Market size and forecast, by Active ingredients
- 7.6.5.4.3. Market size and forecast, by End User
CHAPTER 8: COMPETITIVE LANDSCAPE
- 8.1. Introduction
- 8.2. Top winning strategies
- 8.3. Product mapping of top 10 player
- 8.4. Competitive dashboard
- 8.5. Competitive heatmap
- 8.6. Top player positioning, 2022
CHAPTER 9: COMPANY PROFILES
- 9.1. AbbVie Inc.
- 9.1.1. Company overview
- 9.1.2. Key executives
- 9.1.3. Company snapshot
- 9.1.4. Operating business segments
- 9.1.5. Product portfolio
- 9.1.6. Business performance
- 9.1.7. Key strategic moves and developments
- 9.2. Besins Healthcare SA
- 9.2.1. Company overview
- 9.2.2. Key executives
- 9.2.3. Company snapshot
- 9.2.4. Operating business segments
- 9.2.5. Product portfolio
- 9.2.6. Business performance
- 9.2.7. Key strategic moves and developments
- 9.3. Acerus Pharmaceuticals Corporation
- 9.3.1. Company overview
- 9.3.2. Key executives
- 9.3.3. Company snapshot
- 9.3.4. Operating business segments
- 9.3.5. Product portfolio
- 9.3.6. Business performance
- 9.3.7. Key strategic moves and developments
- 9.4. Amneal Pharmaceuticals Inc.
- 9.4.1. Company overview
- 9.4.2. Key executives
- 9.4.3. Company snapshot
- 9.4.4. Operating business segments
- 9.4.5. Product portfolio
- 9.4.6. Business performance
- 9.4.7. Key strategic moves and developments
- 9.5. Acrux Ltd.
- 9.5.1. Company overview
- 9.5.2. Key executives
- 9.5.3. Company snapshot
- 9.5.4. Operating business segments
- 9.5.5. Product portfolio
- 9.5.6. Business performance
- 9.5.7. Key strategic moves and developments
- 9.6. Endo International plc.
- 9.6.1. Company overview
- 9.6.2. Key executives
- 9.6.3. Company snapshot
- 9.6.4. Operating business segments
- 9.6.5. Product portfolio
- 9.6.6. Business performance
- 9.6.7. Key strategic moves and developments
- 9.7. Biote Medical LLC
- 9.7.1. Company overview
- 9.7.2. Key executives
- 9.7.3. Company snapshot
- 9.7.4. Operating business segments
- 9.7.5. Product portfolio
- 9.7.6. Business performance
- 9.7.7. Key strategic moves and developments
- 9.8. Insud Pharma S.L
- 9.8.1. Company overview
- 9.8.2. Key executives
- 9.8.3. Company snapshot
- 9.8.4. Operating business segments
- 9.8.5. Product portfolio
- 9.8.6. Business performance
- 9.8.7. Key strategic moves and developments
- 9.9. Marius Pharmaceuticals
- 9.9.1. Company overview
- 9.9.2. Key executives
- 9.9.3. Company snapshot
- 9.9.4. Operating business segments
- 9.9.5. Product portfolio
- 9.9.6. Business performance
- 9.9.7. Key strategic moves and developments
- 9.10. Pfizer Inc.
- 9.10.1. Company overview
- 9.10.2. Key executives
- 9.10.3. Company snapshot
- 9.10.4. Operating business segments
- 9.10.5. Product portfolio
- 9.10.6. Business performance
- 9.10.7. Key strategic moves and developments
LIST OF TABLES
- TABLE 01. GLOBAL TESTOSTERONE REPLACEMENT THERAPY MARKET, BY PRODUCT TYPE, 2022-2032 ($MILLION)
- TABLE 02. TESTOSTERONE REPLACEMENT THERAPY MARKET FOR INJECTABLES, BY REGION, 2022-2032 ($MILLION)
- TABLE 03. TESTOSTERONE REPLACEMENT THERAPY MARKET FOR TOPICAL, BY REGION, 2022-2032 ($MILLION)
- TABLE 04. TESTOSTERONE REPLACEMENT THERAPY MARKET FOR OTHERS, BY REGION, 2022-2032 ($MILLION)
- TABLE 05. GLOBAL TESTOSTERONE REPLACEMENT THERAPY MARKET, BY ACTIVE INGREDIENTS, 2022-2032 ($MILLION)
- TABLE 06. TESTOSTERONE REPLACEMENT THERAPY MARKET FOR TESTOSTERONE CYPIONATE, BY REGION, 2022-2032 ($MILLION)
- TABLE 07. TESTOSTERONE REPLACEMENT THERAPY MARKET FOR TESTOSTERONE, BY REGION, 2022-2032 ($MILLION)
- TABLE 08. TESTOSTERONE REPLACEMENT THERAPY MARKET FOR TESTOSTERONE ENANTHATE, BY REGION, 2022-2032 ($MILLION)
- TABLE 09. TESTOSTERONE REPLACEMENT THERAPY MARKET FOR TESTOSTERONE UNDECANOATE, BY REGION, 2022-2032 ($MILLION)
- TABLE 10. TESTOSTERONE REPLACEMENT THERAPY MARKET FOR OTHERS, BY REGION, 2022-2032 ($MILLION)
- TABLE 11. GLOBAL TESTOSTERONE REPLACEMENT THERAPY MARKET, BY END USER, 2022-2032 ($MILLION)
- TABLE 12. TESTOSTERONE REPLACEMENT THERAPY MARKET FOR HOSPITAL, BY REGION, 2022-2032 ($MILLION)
- TABLE 13. TESTOSTERONE REPLACEMENT THERAPY MARKET FOR CLINICS, BY REGION, 2022-2032 ($MILLION)
- TABLE 14. TESTOSTERONE REPLACEMENT THERAPY MARKET, BY REGION, 2022-2032 ($MILLION)
- TABLE 15. NORTH AMERICA TESTOSTERONE REPLACEMENT THERAPY MARKET, BY PRODUCT TYPE, 2022-2032 ($MILLION)
- TABLE 16. NORTH AMERICA TESTOSTERONE REPLACEMENT THERAPY MARKET, BY ACTIVE INGREDIENTS, 2022-2032 ($MILLION)
- TABLE 17. NORTH AMERICA TESTOSTERONE REPLACEMENT THERAPY MARKET, BY END USER, 2022-2032 ($MILLION)
- TABLE 18. NORTH AMERICA TESTOSTERONE REPLACEMENT THERAPY MARKET, BY COUNTRY, 2022-2032 ($MILLION)
- TABLE 19. U.S. TESTOSTERONE REPLACEMENT THERAPY MARKET, BY PRODUCT TYPE, 2022-2032 ($MILLION)
- TABLE 20. U.S. TESTOSTERONE REPLACEMENT THERAPY MARKET, BY ACTIVE INGREDIENTS, 2022-2032 ($MILLION)
- TABLE 21. U.S. TESTOSTERONE REPLACEMENT THERAPY MARKET, BY END USER, 2022-2032 ($MILLION)
- TABLE 22. CANADA TESTOSTERONE REPLACEMENT THERAPY MARKET, BY PRODUCT TYPE, 2022-2032 ($MILLION)
- TABLE 23. CANADA TESTOSTERONE REPLACEMENT THERAPY MARKET, BY ACTIVE INGREDIENTS, 2022-2032 ($MILLION)
- TABLE 24. CANADA TESTOSTERONE REPLACEMENT THERAPY MARKET, BY END USER, 2022-2032 ($MILLION)
- TABLE 25. MEXICO TESTOSTERONE REPLACEMENT THERAPY MARKET, BY PRODUCT TYPE, 2022-2032 ($MILLION)
- TABLE 26. MEXICO TESTOSTERONE REPLACEMENT THERAPY MARKET, BY ACTIVE INGREDIENTS, 2022-2032 ($MILLION)
- TABLE 27. MEXICO TESTOSTERONE REPLACEMENT THERAPY MARKET, BY END USER, 2022-2032 ($MILLION)
- TABLE 28. EUROPE TESTOSTERONE REPLACEMENT THERAPY MARKET, BY PRODUCT TYPE, 2022-2032 ($MILLION)
- TABLE 29. EUROPE TESTOSTERONE REPLACEMENT THERAPY MARKET, BY ACTIVE INGREDIENTS, 2022-2032 ($MILLION)
- TABLE 30. EUROPE TESTOSTERONE REPLACEMENT THERAPY MARKET, BY END USER, 2022-2032 ($MILLION)
- TABLE 31. EUROPE TESTOSTERONE REPLACEMENT THERAPY MARKET, BY COUNTRY, 2022-2032 ($MILLION)
- TABLE 32. GERMANY TESTOSTERONE REPLACEMENT THERAPY MARKET, BY PRODUCT TYPE, 2022-2032 ($MILLION)
- TABLE 33. GERMANY TESTOSTERONE REPLACEMENT THERAPY MARKET, BY ACTIVE INGREDIENTS, 2022-2032 ($MILLION)
- TABLE 34. GERMANY TESTOSTERONE REPLACEMENT THERAPY MARKET, BY END USER, 2022-2032 ($MILLION)
- TABLE 35. FRANCE TESTOSTERONE REPLACEMENT THERAPY MARKET, BY PRODUCT TYPE, 2022-2032 ($MILLION)
- TABLE 36. FRANCE TESTOSTERONE REPLACEMENT THERAPY MARKET, BY ACTIVE INGREDIENTS, 2022-2032 ($MILLION)
- TABLE 37. FRANCE TESTOSTERONE REPLACEMENT THERAPY MARKET, BY END USER, 2022-2032 ($MILLION)
- TABLE 38. UK TESTOSTERONE REPLACEMENT THERAPY MARKET, BY PRODUCT TYPE, 2022-2032 ($MILLION)
- TABLE 39. UK TESTOSTERONE REPLACEMENT THERAPY MARKET, BY ACTIVE INGREDIENTS, 2022-2032 ($MILLION)
- TABLE 40. UK TESTOSTERONE REPLACEMENT THERAPY MARKET, BY END USER, 2022-2032 ($MILLION)
- TABLE 41. ITALY TESTOSTERONE REPLACEMENT THERAPY MARKET, BY PRODUCT TYPE, 2022-2032 ($MILLION)
- TABLE 42. ITALY TESTOSTERONE REPLACEMENT THERAPY MARKET, BY ACTIVE INGREDIENTS, 2022-2032 ($MILLION)
- TABLE 43. ITALY TESTOSTERONE REPLACEMENT THERAPY MARKET, BY END USER, 2022-2032 ($MILLION)
- TABLE 44. SPAIN TESTOSTERONE REPLACEMENT THERAPY MARKET, BY PRODUCT TYPE, 2022-2032 ($MILLION)
- TABLE 45. SPAIN TESTOSTERONE REPLACEMENT THERAPY MARKET, BY ACTIVE INGREDIENTS, 2022-2032 ($MILLION)
- TABLE 46. SPAIN TESTOSTERONE REPLACEMENT THERAPY MARKET, BY END USER, 2022-2032 ($MILLION)
- TABLE 47. REST OF EUROPE TESTOSTERONE REPLACEMENT THERAPY MARKET, BY PRODUCT TYPE, 2022-2032 ($MILLION)
- TABLE 48. REST OF EUROPE TESTOSTERONE REPLACEMENT THERAPY MARKET, BY ACTIVE INGREDIENTS, 2022-2032 ($MILLION)
- TABLE 49. REST OF EUROPE TESTOSTERONE REPLACEMENT THERAPY MARKET, BY END USER, 2022-2032 ($MILLION)
- TABLE 50. ASIA-PACIFIC TESTOSTERONE REPLACEMENT THERAPY MARKET, BY PRODUCT TYPE, 2022-2032 ($MILLION)
- TABLE 51. ASIA-PACIFIC TESTOSTERONE REPLACEMENT THERAPY MARKET, BY ACTIVE INGREDIENTS, 2022-2032 ($MILLION)
- TABLE 52. ASIA-PACIFIC TESTOSTERONE REPLACEMENT THERAPY MARKET, BY END USER, 2022-2032 ($MILLION)
- TABLE 53. ASIA-PACIFIC TESTOSTERONE REPLACEMENT THERAPY MARKET, BY COUNTRY, 2022-2032 ($MILLION)
- TABLE 54. JAPAN TESTOSTERONE REPLACEMENT THERAPY MARKET, BY PRODUCT TYPE, 2022-2032 ($MILLION)
- TABLE 55. JAPAN TESTOSTERONE REPLACEMENT THERAPY MARKET, BY ACTIVE INGREDIENTS, 2022-2032 ($MILLION)
- TABLE 56. JAPAN TESTOSTERONE REPLACEMENT THERAPY MARKET, BY END USER, 2022-2032 ($MILLION)
- TABLE 57. CHINA TESTOSTERONE REPLACEMENT THERAPY MARKET, BY PRODUCT TYPE, 2022-2032 ($MILLION)
- TABLE 58. CHINA TESTOSTERONE REPLACEMENT THERAPY MARKET, BY ACTIVE INGREDIENTS, 2022-2032 ($MILLION)
- TABLE 59. CHINA TESTOSTERONE REPLACEMENT THERAPY MARKET, BY END USER, 2022-2032 ($MILLION)
- TABLE 60. INDIA TESTOSTERONE REPLACEMENT THERAPY MARKET, BY PRODUCT TYPE, 2022-2032 ($MILLION)
- TABLE 61. INDIA TESTOSTERONE REPLACEMENT THERAPY MARKET, BY ACTIVE INGREDIENTS, 2022-2032 ($MILLION)
- TABLE 62. INDIA TESTOSTERONE REPLACEMENT THERAPY MARKET, BY END USER, 2022-2032 ($MILLION)
- TABLE 63. AUSTRALIA TESTOSTERONE REPLACEMENT THERAPY MARKET, BY PRODUCT TYPE, 2022-2032 ($MILLION)
- TABLE 64. AUSTRALIA TESTOSTERONE REPLACEMENT THERAPY MARKET, BY ACTIVE INGREDIENTS, 2022-2032 ($MILLION)
- TABLE 65. AUSTRALIA TESTOSTERONE REPLACEMENT THERAPY MARKET, BY END USER, 2022-2032 ($MILLION)
- TABLE 66. SOUTH KOREA TESTOSTERONE REPLACEMENT THERAPY MARKET, BY PRODUCT TYPE, 2022-2032 ($MILLION)
- TABLE 67. SOUTH KOREA TESTOSTERONE REPLACEMENT THERAPY MARKET, BY ACTIVE INGREDIENTS, 2022-2032 ($MILLION)
- TABLE 68. SOUTH KOREA TESTOSTERONE REPLACEMENT THERAPY MARKET, BY END USER, 2022-2032 ($MILLION)
- TABLE 69. REST OF ASIA-PACIFIC TESTOSTERONE REPLACEMENT THERAPY MARKET, BY PRODUCT TYPE, 2022-2032 ($MILLION)
- TABLE 70. REST OF ASIA-PACIFIC TESTOSTERONE REPLACEMENT THERAPY MARKET, BY ACTIVE INGREDIENTS, 2022-2032 ($MILLION)
- TABLE 71. REST OF ASIA-PACIFIC TESTOSTERONE REPLACEMENT THERAPY MARKET, BY END USER, 2022-2032 ($MILLION)
- TABLE 72. LATIN AMERICA TESTOSTERONE REPLACEMENT THERAPY MARKET, BY PRODUCT TYPE, 2022-2032 ($MILLION)
- TABLE 73. LATIN AMERICA TESTOSTERONE REPLACEMENT THERAPY MARKET, BY ACTIVE INGREDIENTS, 2022-2032 ($MILLION)
- TABLE 74. LATIN AMERICA TESTOSTERONE REPLACEMENT THERAPY MARKET, BY END USER, 2022-2032 ($MILLION)
- TABLE 75. LATIN AMERICA TESTOSTERONE REPLACEMENT THERAPY MARKET, BY COUNTRY, 2022-2032 ($MILLION)
- TABLE 76. BRAZIL TESTOSTERONE REPLACEMENT THERAPY MARKET, BY PRODUCT TYPE, 2022-2032 ($MILLION)
- TABLE 77. BRAZIL TESTOSTERONE REPLACEMENT THERAPY MARKET, BY ACTIVE INGREDIENTS, 2022-2032 ($MILLION)
- TABLE 78. BRAZIL TESTOSTERONE REPLACEMENT THERAPY MARKET, BY END USER, 2022-2032 ($MILLION)
- TABLE 79. COLOMBIA TESTOSTERONE REPLACEMENT THERAPY MARKET, BY PRODUCT TYPE, 2022-2032 ($MILLION)
- TABLE 80. COLOMBIA TESTOSTERONE REPLACEMENT THERAPY MARKET, BY ACTIVE INGREDIENTS, 2022-2032 ($MILLION)
- TABLE 81. COLOMBIA TESTOSTERONE REPLACEMENT THERAPY MARKET, BY END USER, 2022-2032 ($MILLION)
- TABLE 82. ARGENTINA TESTOSTERONE REPLACEMENT THERAPY MARKET, BY PRODUCT TYPE, 2022-2032 ($MILLION)
- TABLE 83. ARGENTINA TESTOSTERONE REPLACEMENT THERAPY MARKET, BY ACTIVE INGREDIENTS, 2022-2032 ($MILLION)
- TABLE 84. ARGENTINA TESTOSTERONE REPLACEMENT THERAPY MARKET, BY END USER, 2022-2032 ($MILLION)
- TABLE 85. REST OF LATIN AMERICA TESTOSTERONE REPLACEMENT THERAPY MARKET, BY PRODUCT TYPE, 2022-2032 ($MILLION)
- TABLE 86. REST OF LATIN AMERICA TESTOSTERONE REPLACEMENT THERAPY MARKET, BY ACTIVE INGREDIENTS, 2022-2032 ($MILLION)
- TABLE 87. REST OF LATIN AMERICA TESTOSTERONE REPLACEMENT THERAPY MARKET, BY END USER, 2022-2032 ($MILLION)
- TABLE 88. MIDDLE EAST AND AFRICA TESTOSTERONE REPLACEMENT THERAPY MARKET, BY PRODUCT TYPE, 2022-2032 ($MILLION)
- TABLE 89. MIDDLE EAST AND AFRICA TESTOSTERONE REPLACEMENT THERAPY MARKET, BY ACTIVE INGREDIENTS, 2022-2032 ($MILLION)
- TABLE 90. MIDDLE EAST AND AFRICA TESTOSTERONE REPLACEMENT THERAPY MARKET, BY END USER, 2022-2032 ($MILLION)
- TABLE 91. MIDDLE EAST AND AFRICA TESTOSTERONE REPLACEMENT THERAPY MARKET, BY COUNTRY, 2022-2032 ($MILLION)
- TABLE 92. GCC TESTOSTERONE REPLACEMENT THERAPY MARKET, BY PRODUCT TYPE, 2022-2032 ($MILLION)
- TABLE 93. GCC TESTOSTERONE REPLACEMENT THERAPY MARKET, BY ACTIVE INGREDIENTS, 2022-2032 ($MILLION)
- TABLE 94. GCC TESTOSTERONE REPLACEMENT THERAPY MARKET, BY END USER, 2022-2032 ($MILLION)
- TABLE 95. SOUTH AFRICA TESTOSTERONE REPLACEMENT THERAPY MARKET, BY PRODUCT TYPE, 2022-2032 ($MILLION)
- TABLE 96. SOUTH AFRICA TESTOSTERONE REPLACEMENT THERAPY MARKET, BY ACTIVE INGREDIENTS, 2022-2032 ($MILLION)
- TABLE 97. SOUTH AFRICA TESTOSTERONE REPLACEMENT THERAPY MARKET, BY END USER, 2022-2032 ($MILLION)
- TABLE 98. NORTH AFRICA TESTOSTERONE REPLACEMENT THERAPY MARKET, BY PRODUCT TYPE, 2022-2032 ($MILLION)
- TABLE 99. NORTH AFRICA TESTOSTERONE REPLACEMENT THERAPY MARKET, BY ACTIVE INGREDIENTS, 2022-2032 ($MILLION)
- TABLE 100. NORTH AFRICA TESTOSTERONE REPLACEMENT THERAPY MARKET, BY END USER, 2022-2032 ($MILLION)
- TABLE 101. REST OF MEA TESTOSTERONE REPLACEMENT THERAPY MARKET, BY PRODUCT TYPE, 2022-2032 ($MILLION)
- TABLE 102. REST OF MEA TESTOSTERONE REPLACEMENT THERAPY MARKET, BY ACTIVE INGREDIENTS, 2022-2032 ($MILLION)
- TABLE 103. REST OF MEA TESTOSTERONE REPLACEMENT THERAPY MARKET, BY END USER, 2022-2032 ($MILLION)
- TABLE 104. ABBVIE INC.: KEY EXECUTIVES
- TABLE 105. ABBVIE INC.: COMPANY SNAPSHOT
- TABLE 106. ABBVIE INC.: PRODUCT SEGMENTS
- TABLE 107. ABBVIE INC.: SERVICE SEGMENTS
- TABLE 108. ABBVIE INC.: PRODUCT PORTFOLIO
- TABLE 109. ABBVIE INC.: KEY STRATERGIES
- TABLE 110. BESINS HEALTHCARE SA: KEY EXECUTIVES
- TABLE 111. BESINS HEALTHCARE SA: COMPANY SNAPSHOT
- TABLE 112. BESINS HEALTHCARE SA: PRODUCT SEGMENTS
- TABLE 113. BESINS HEALTHCARE SA: SERVICE SEGMENTS
- TABLE 114. BESINS HEALTHCARE SA: PRODUCT PORTFOLIO
- TABLE 115. BESINS HEALTHCARE SA: KEY STRATERGIES
- TABLE 116. ACERUS PHARMACEUTICALS CORPORATION: KEY EXECUTIVES
- TABLE 117. ACERUS PHARMACEUTICALS CORPORATION: COMPANY SNAPSHOT
- TABLE 118. ACERUS PHARMACEUTICALS CORPORATION: PRODUCT SEGMENTS
- TABLE 119. ACERUS PHARMACEUTICALS CORPORATION: SERVICE SEGMENTS
- TABLE 120. ACERUS PHARMACEUTICALS CORPORATION: PRODUCT PORTFOLIO
- TABLE 121. ACERUS PHARMACEUTICALS CORPORATION: KEY STRATERGIES
- TABLE 122. AMNEAL PHARMACEUTICALS INC.: KEY EXECUTIVES
- TABLE 123. AMNEAL PHARMACEUTICALS INC.: COMPANY SNAPSHOT
- TABLE 124. AMNEAL PHARMACEUTICALS INC.: PRODUCT SEGMENTS
- TABLE 125. AMNEAL PHARMACEUTICALS INC.: SERVICE SEGMENTS
- TABLE 126. AMNEAL PHARMACEUTICALS INC.: PRODUCT PORTFOLIO
- TABLE 127. AMNEAL PHARMACEUTICALS INC.: KEY STRATERGIES
- TABLE 128. ACRUX LTD.: KEY EXECUTIVES
- TABLE 129. ACRUX LTD.: COMPANY SNAPSHOT
- TABLE 130. ACRUX LTD.: PRODUCT SEGMENTS
- TABLE 131. ACRUX LTD.: SERVICE SEGMENTS
- TABLE 132. ACRUX LTD.: PRODUCT PORTFOLIO
- TABLE 133. ACRUX LTD.: KEY STRATERGIES
- TABLE 134. ENDO INTERNATIONAL PLC.: KEY EXECUTIVES
- TABLE 135. ENDO INTERNATIONAL PLC.: COMPANY SNAPSHOT
- TABLE 136. ENDO INTERNATIONAL PLC.: PRODUCT SEGMENTS
- TABLE 137. ENDO INTERNATIONAL PLC.: SERVICE SEGMENTS
- TABLE 138. ENDO INTERNATIONAL PLC.: PRODUCT PORTFOLIO
- TABLE 139. ENDO INTERNATIONAL PLC.: KEY STRATERGIES
- TABLE 140. BIOTE MEDICAL LLC: KEY EXECUTIVES
- TABLE 141. BIOTE MEDICAL LLC: COMPANY SNAPSHOT
- TABLE 142. BIOTE MEDICAL LLC: PRODUCT SEGMENTS
- TABLE 143. BIOTE MEDICAL LLC: SERVICE SEGMENTS
- TABLE 144. BIOTE MEDICAL LLC: PRODUCT PORTFOLIO
- TABLE 145. BIOTE MEDICAL LLC: KEY STRATERGIES
- TABLE 146. INSUD PHARMA S.L: KEY EXECUTIVES
- TABLE 147. INSUD PHARMA S.L: COMPANY SNAPSHOT
- TABLE 148. INSUD PHARMA S.L: PRODUCT SEGMENTS
- TABLE 149. INSUD PHARMA S.L: SERVICE SEGMENTS
- TABLE 150. INSUD PHARMA S.L: PRODUCT PORTFOLIO
- TABLE 151. INSUD PHARMA S.L: KEY STRATERGIES
- TABLE 152. MARIUS PHARMACEUTICALS: KEY EXECUTIVES
- TABLE 153. MARIUS PHARMACEUTICALS: COMPANY SNAPSHOT
- TABLE 154. MARIUS PHARMACEUTICALS: PRODUCT SEGMENTS
- TABLE 155. MARIUS PHARMACEUTICALS: SERVICE SEGMENTS
- TABLE 156. MARIUS PHARMACEUTICALS: PRODUCT PORTFOLIO
- TABLE 157. MARIUS PHARMACEUTICALS: KEY STRATERGIES
- TABLE 158. PFIZER INC.: KEY EXECUTIVES
- TABLE 159. PFIZER INC.: COMPANY SNAPSHOT
- TABLE 160. PFIZER INC.: PRODUCT SEGMENTS
- TABLE 161. PFIZER INC.: SERVICE SEGMENTS
- TABLE 162. PFIZER INC.: PRODUCT PORTFOLIO
- TABLE 163. PFIZER INC.: KEY STRATERGIES
LIST OF FIGURES
- FIGURE 01. TESTOSTERONE REPLACEMENT THERAPY MARKET, 2022-2032
- FIGURE 02. SEGMENTATION OF TESTOSTERONE REPLACEMENT THERAPY MARKET,2022-2032
- FIGURE 03. TOP IMPACTING FACTORS IN TESTOSTERONE REPLACEMENT THERAPY MARKET
- FIGURE 04. TOP INVESTMENT POCKETS IN TESTOSTERONE REPLACEMENT THERAPY MARKET (2023-2032)
- FIGURE 05. BARGAINING POWER OF SUPPLIERS
- FIGURE 06. BARGAINING POWER OF BUYERS
- FIGURE 07. THREAT OF SUBSTITUTION
- FIGURE 08. THREAT OF SUBSTITUTION
- FIGURE 09. COMPETITIVE RIVALRY
- FIGURE 10. GLOBAL TESTOSTERONE REPLACEMENT THERAPY MARKET:DRIVERS, RESTRAINTS AND OPPORTUNITIES
- FIGURE 11. TESTOSTERONE REPLACEMENT THERAPY MARKET, BY PRODUCT TYPE, 2022 AND 2032(%)
- FIGURE 12. COMPARATIVE SHARE ANALYSIS OF TESTOSTERONE REPLACEMENT THERAPY MARKET FOR INJECTABLES, BY COUNTRY 2022 AND 2032(%)
- FIGURE 13. COMPARATIVE SHARE ANALYSIS OF TESTOSTERONE REPLACEMENT THERAPY MARKET FOR TOPICAL, BY COUNTRY 2022 AND 2032(%)
- FIGURE 14. COMPARATIVE SHARE ANALYSIS OF TESTOSTERONE REPLACEMENT THERAPY MARKET FOR OTHERS, BY COUNTRY 2022 AND 2032(%)
- FIGURE 15. TESTOSTERONE REPLACEMENT THERAPY MARKET, BY ACTIVE INGREDIENTS, 2022 AND 2032(%)
- FIGURE 16. COMPARATIVE SHARE ANALYSIS OF TESTOSTERONE REPLACEMENT THERAPY MARKET FOR TESTOSTERONE CYPIONATE, BY COUNTRY 2022 AND 2032(%)
- FIGURE 17. COMPARATIVE SHARE ANALYSIS OF TESTOSTERONE REPLACEMENT THERAPY MARKET FOR TESTOSTERONE, BY COUNTRY 2022 AND 2032(%)
- FIGURE 18. COMPARATIVE SHARE ANALYSIS OF TESTOSTERONE REPLACEMENT THERAPY MARKET FOR TESTOSTERONE ENANTHATE, BY COUNTRY 2022 AND 2032(%)
- FIGURE 19. COMPARATIVE SHARE ANALYSIS OF TESTOSTERONE REPLACEMENT THERAPY MARKET FOR TESTOSTERONE UNDECANOATE, BY COUNTRY 2022 AND 2032(%)
- FIGURE 20. COMPARATIVE SHARE ANALYSIS OF TESTOSTERONE REPLACEMENT THERAPY MARKET FOR OTHERS, BY COUNTRY 2022 AND 2032(%)
- FIGURE 21. TESTOSTERONE REPLACEMENT THERAPY MARKET, BY END USER, 2022 AND 2032(%)
- FIGURE 22. COMPARATIVE SHARE ANALYSIS OF TESTOSTERONE REPLACEMENT THERAPY MARKET FOR HOSPITAL, BY COUNTRY 2022 AND 2032(%)
- FIGURE 23. COMPARATIVE SHARE ANALYSIS OF TESTOSTERONE REPLACEMENT THERAPY MARKET FOR CLINICS, BY COUNTRY 2022 AND 2032(%)
- FIGURE 24. TESTOSTERONE REPLACEMENT THERAPY MARKET BY REGION, 2022 AND 2032(%)
- FIGURE 25. U.S. TESTOSTERONE REPLACEMENT THERAPY MARKET, 2022-2032 ($MILLION)
- FIGURE 26. CANADA TESTOSTERONE REPLACEMENT THERAPY MARKET, 2022-2032 ($MILLION)
- FIGURE 27. MEXICO TESTOSTERONE REPLACEMENT THERAPY MARKET, 2022-2032 ($MILLION)
- FIGURE 28. GERMANY TESTOSTERONE REPLACEMENT THERAPY MARKET, 2022-2032 ($MILLION)
- FIGURE 29. FRANCE TESTOSTERONE REPLACEMENT THERAPY MARKET, 2022-2032 ($MILLION)
- FIGURE 30. UK TESTOSTERONE REPLACEMENT THERAPY MARKET, 2022-2032 ($MILLION)
- FIGURE 31. ITALY TESTOSTERONE REPLACEMENT THERAPY MARKET, 2022-2032 ($MILLION)
- FIGURE 32. SPAIN TESTOSTERONE REPLACEMENT THERAPY MARKET, 2022-2032 ($MILLION)
- FIGURE 33. REST OF EUROPE TESTOSTERONE REPLACEMENT THERAPY MARKET, 2022-2032 ($MILLION)
- FIGURE 34. JAPAN TESTOSTERONE REPLACEMENT THERAPY MARKET, 2022-2032 ($MILLION)
- FIGURE 35. CHINA TESTOSTERONE REPLACEMENT THERAPY MARKET, 2022-2032 ($MILLION)
- FIGURE 36. INDIA TESTOSTERONE REPLACEMENT THERAPY MARKET, 2022-2032 ($MILLION)
- FIGURE 37. AUSTRALIA TESTOSTERONE REPLACEMENT THERAPY MARKET, 2022-2032 ($MILLION)
- FIGURE 38. SOUTH KOREA TESTOSTERONE REPLACEMENT THERAPY MARKET, 2022-2032 ($MILLION)
- FIGURE 39. REST OF ASIA-PACIFIC TESTOSTERONE REPLACEMENT THERAPY MARKET, 2022-2032 ($MILLION)
- FIGURE 40. BRAZIL TESTOSTERONE REPLACEMENT THERAPY MARKET, 2022-2032 ($MILLION)
- FIGURE 41. COLOMBIA TESTOSTERONE REPLACEMENT THERAPY MARKET, 2022-2032 ($MILLION)
- FIGURE 42. ARGENTINA TESTOSTERONE REPLACEMENT THERAPY MARKET, 2022-2032 ($MILLION)
- FIGURE 43. REST OF LATIN AMERICA TESTOSTERONE REPLACEMENT THERAPY MARKET, 2022-2032 ($MILLION)
- FIGURE 44. GCC TESTOSTERONE REPLACEMENT THERAPY MARKET, 2022-2032 ($MILLION)
- FIGURE 45. SOUTH AFRICA TESTOSTERONE REPLACEMENT THERAPY MARKET, 2022-2032 ($MILLION)
- FIGURE 46. NORTH AFRICA TESTOSTERONE REPLACEMENT THERAPY MARKET, 2022-2032 ($MILLION)
- FIGURE 47. REST OF MEA TESTOSTERONE REPLACEMENT THERAPY MARKET, 2022-2032 ($MILLION)
- FIGURE 48. TOP WINNING STRATEGIES, BY YEAR
- FIGURE 49. TOP WINNING STRATEGIES, BY DEVELOPMENT
- FIGURE 50. TOP WINNING STRATEGIES, BY COMPANY
- FIGURE 51. PRODUCT MAPPING OF TOP 10 PLAYERS
- FIGURE 52. COMPETITIVE DASHBOARD
- FIGURE 53. COMPETITIVE HEATMAP: TESTOSTERONE REPLACEMENT THERAPY MARKET
- FIGURE 54. TOP PLAYER POSITIONING, 2022
 睪固酮替代疗法市场-全球产业规模、份额、趋势、机会和预测,按适应症、产品类型、药物活性、配销通路、地区和竞争进行细分,2020 年至 2030 年
 男性荷尔蒙补充疗法市场(按治疗方法、应用和最终用户划分)—2025-2030 年全球预测
 睪固酮注射剂市场报告:2031 年趋势、预测和竞争分析睪固酮助推器市场报告:趋势、预测和竞争分析(至 2031 年)
 2025-2033 年按产品类型、活性成分、最终用户和地区分類的睾酮替代疗法市场报告
 睾酮替代疗法市场机会、成长动力、行业趋势分析和 2025 - 2034 年预测
 睪固酮替代疗法市场规模、份额、成长分析、按产品类型、按活性成分、按最终用户、按地区 - 行业预测,2024-2031 年睪固酮增强补充品市场规模、份额、趋势分析报告:按成分类型、格式、分销管道、地区和细分市场预测,2024-2030 年