


 |
市场调查报告书
商品编码
1472300
汽车复合材料市场:按纤维类型、树脂类型和应用分类:2023-2032 年全球机会分析和产业预测Automotive Composites Market By Fiber Type (Glass Fiber, Carbon Fiber, Others), By Resin Type (Thermoset, Thermoplastic), By Application (Exterior, Interior, Others): Global Opportunity Analysis and Industry Forecast, 2023-2032 |
||||||
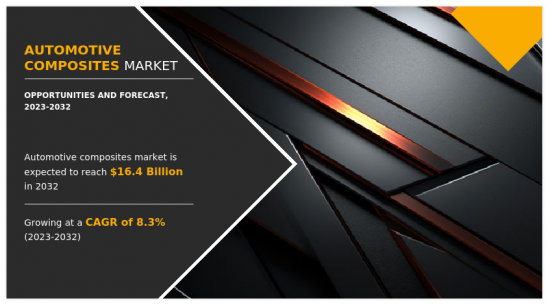
2022年全球汽车复合材料市场价值为74亿美元,预计到2032年将达到164亿美元,2023年至2032年复合年增长率为8.3%。
汽车复合材料是汽车中使用的先进材料,它将碳纤维和玻璃纤维等各种成分与树脂基体混合在一起。与铁和铝等传统材料相比,这些复合材料具有优异的强度重量比。用于车身面板、底盘和结构元件,以提高性能、耐用性和安全性。透过减轻重量和增加刚度,汽车复合材料有助于提高燃油经济性和降低排放气体,从而实现永续性和环境责任的行业目标。其多功能性可实现创新的设计解决方案,并加速下一代汽车的开发,在竞争日益激烈的汽车产业中,优先考虑效率、安全性和环境相容性。
永续性已成为影响穿戴式领域材料选择和开发的关键驱动因素。技术进步和材料创新在扩大汽车复合材料的功能和适用性方面发挥了关键作用。透过不断的研究和开发,工程师和科学家突破了复合材料的界限,提高了其机械性能、耐用性和可製造性。自动沉积技术和积层製造等先进製造流程简化了製造流程并降低了成本,使汽车製造商更容易获得复合材料。此外,奈米技术和智慧材料的整合具有释放汽车复合材料新功能和性能改进的巨大潜力。随着技术创新不断推动复合材料的发展,复合材料在各种汽车应用中的采用预计将加速。
此外,设计弹性和美观性是汽车复合材料的关键差异化因素,为设计师提供了前所未有的自由度来创造具有视觉衝击力和动态效率的车辆。将复合材料模製成复杂形状并整合独特设计元素的能力使汽车製造商能够区分其产品并增强品牌和身份验证。此外,复合材料可以整合空气动力学和结构增强等功能特性,而不会影响设计的美观。随着消费者偏好独特、个人化的汽车,复合材料提供的设计弹性将在塑造未来汽车设计趋势方面发挥关键作用。
然而,虽然复合材料比金属提供更大的设计弹性,但它们也带来了独特的设计和工程挑战。将复合材料融入汽车结构需要先进的设计和模拟工具来优化材料使用并确保结构完整性。此外,复合材料在各种负载条件下的表现与金属不同,需要专业的工程知识才能提供有效的设计解决方案。汽车复合材料缺乏标准化设计指南和测试通讯协定进一步使设计过程复杂化并延长了开发前置作业时间。
另一方面,由于可支配收入的增加、都市化和基础设施的发展,新兴经济体的汽车复合材料市场拥有开拓的潜力。随着这些地区汽车需求的成长,有将轻质复合材料引入汽车製造过程的重大机会。透过与当地汽车製造商合作并投资基础设施开拓,复合材料供应商可以进入新兴市场并利用这些地区快速成长的汽车工业。
其他参与汽车复合材料製造的主要企业包括 Magna、Mar-Bal、Plasan、UFP Technologies、Base Group、3B Fiberglass 和 Delphi Auto。全球汽车复合材料市场报告涵盖了这些主要企业的概况以及详细的竞争分析。
相关人员的主要利益
- 该报告定量分析了2022年至2032年汽车复合材料市场的细分市场、当前趋势、估计/趋势和动态,并确定了汽车复合材料市场的强大机会。
- 它提供市场研究以及与市场驱动因素、市场限制和市场机会相关的资讯。
- 波特的五力分析揭示了买家和供应商的潜力,帮助相关人员做出利润驱动的业务决策并加强供应商和买家网路。
- 对汽车复合材料市场细分的详细分析有助于识别市场机会。
- 每个地区的主要国家都根据其对全球市场的收益贡献绘製了地图。
- 市场参与企业定位有助于基准化分析,并提供对市场参与企业当前地位的清晰了解。
- 该报告包括对区域和全球汽车复合材料市场趋势、主要企业、细分市场、应用细分和市场成长策略的分析。
可以使用此报告进行客製化(需要额外费用和时间表)
- 製造能力
- 按地区分類的新参与企业
- 科技趋势分析
- 按产品/细分市场对参与企业进行市场区隔分析
- 新产品开发/主要企业产品矩阵
- 国家、区域和全球各级的患者/流行病学资料
- 监管指引
- 根据客户兴趣新增其他公司简介
- 按国家或地区进行的附加分析 – 市场规模和预测
- 平均售价分析/价位分析
- 扩大公司简介列表
- 历史市场资料
- 导入/汇出分析/资料
- 主要参与企业的详细资料(Excel格式,包括位置、联络资讯、供应商/供应商网路等)
- 客户/消费者/原料供应商名单 - 价值链分析
- 全球/区域/国家层级参与企业的市场占有率分析
- SWOT分析
- 销售市场规模及预测
目录
第一章简介
第 2 章执行摘要
第三章市场概况
- 市场定义和范围
- 主要发现
- 影响因素
- 关键投资机会
- 波特五力分析
- 市场动态
- 促进因素
- 抑制因素
- 机会
- 价值链分析
- 价格分析
- 关键监管分析
- 专利情况
第四章汽车复合材料市场:依纤维类型
- 概述
- 玻璃纤维
- 碳纤维
- 其他的
第五章汽车复合材料市场:依树脂类型
- 概述
- 热固性树脂
- 热塑性树脂
第六章汽车复合材料市场:依应用分类
- 概述
- 外部的
- 内部的
- 其他的
第七章汽车复合材料市场:依地区
- 概述
- 北美洲
- 美国
- 加拿大
- 墨西哥
- 欧洲
- 德国
- 英国
- 法国
- 西班牙
- 义大利
- 其他的
- 亚太地区
- 中国
- 印度
- 日本
- 韩国
- 澳洲
- 其他的
- 拉丁美洲/中东/非洲
- 巴西
- 沙乌地阿拉伯
- 南非
- 其他的
第八章 竞争格局
- 介绍
- 关键成功策略
- 10家主要企业产品图谱
- 竞争对手仪表板
- 竞争热图
- 2022年主要企业定位
第九章 公司简介
- TORAY INDUSTRIES, INC.
- SGL Carbon SE
- Teijin Limited
- TEIJIN LIMITED.
- Hexcel Corporation
- Owens Corning
- Mitsubishi Chemical Holdings Corporation
- Gurit Holding AG
- Solvay SA
- TenCate Advanced Composites
- Huntsman Corporation
The global automotive composite market was valued at $7.4 billion in 2022 and is estimated to reach $16.4 billion by 2032, exhibiting a CAGR of 8.3% from 2023 to 2032.
Automotive composites are advanced materials used in vehicles, blending various components such as carbon or glass fibers with resin matrix. These composites offer superior strength-to-weight ratios as compared to traditional materials such as steel or aluminum. Employed in body panels, chassis, and structural elements, they enhance performance, durability, and safety. By reducing weight and increasing stiffness, automotive composites contribute to improved fuel efficiency and lower emissions, aligning with industry goals for sustainability and environmental responsibility. Their versatility allows for innovative design solutions, fostering the development of next-generation vehicles that prioritize efficiency, safety, and eco-friendliness in an increasingly competitive automotive landscape.
Sustainability has emerged as a key driver influencing the selection and development of materials in the wearable Technological advancements and material innovations have played a pivotal role in expanding the capabilities and applicability of automotive composites. Through continuous research and development, engineers and scientists have pushed the boundaries of composite materials, enhancing their mechanical properties, durability, and manufacturability. Advanced manufacturing processes, such as automated layup techniques and additive manufacturing, have streamlined production processes and lowered costs, making composites more accessible to automakers. Furthermore, the integration of nanotechnology and smart materials holds immense promise for unlocking new functionalities and performance enhancements in automotive composites. As innovation continues to drive the evolution of composite materials, their adoption across diverse automotive applications is poised to accelerate.
Furthermore, design flexibility and aesthetics represent key differentiators for automotive composites, offering designers unprecedented freedom to create visually striking and aerodynamically efficient vehicles. The ability to mold composites into complex shapes and integrate unique design elements has enabled automakers to differentiate their products and enhance brand identity. Moreover, composites allow for the integration of functional features, such as aerodynamic enhancements and structural reinforcements, without compromising design aesthetics. As consumer preferences gravitate towards distinctive and personalized vehicles, the design flexibility offered by composites will play a pivotal role in shaping future automotive design trends.
However, while composites offer superior design flexibility as compared to metals, they also present unique challenges in terms of design and engineering. Integrating composites into vehicle structures requires advanced design and simulation tools to optimize material usage and ensure structural integrity. Moreover, composites behave differently under various loading conditions as compared to metals, necessitating specialized engineering expertise for effective design solutions. Lack of standardized design guidelines and testing protocols for automotive composites further complicates the design process and increases development lead times.
On the contrary, emerging economies represent untapped potential for the automotive composites market, driven by rise in disposable incomes, urbanization, and infrastructural developments. As these regions experience growing demand for automobiles, there exists a significant opportunity to introduce lightweight composite materials into vehicle manufacturing processes. Collaborating with local automotive manufacturers and investing in infrastructure development can enable composite material suppliers to penetrate emerging markets and capitalize on the burgeoning automotive industry in these regions.
The global automotive composites market profiles leading players that include Toray Industries, Inc., SGL Carbon SE, Teijin Limited, Hexcel Corporation, Owens Corning, Mitsubishi Chemical Holdings Corporation, Gurit Holding AG, Solvay S.A., TenCate Advanced Composites, and Huntsman Corporation.
The global automotive composites market profiles leading players such as Toray Industries, Inc., SGL Carbon SE, Teijin Limited, Hexcel Corporation, Owens Corning, Mitsubishi Chemical Holdings Corporation, Gurit Holding AG, Solvay S.A., TenCate Advanced Composites, and Huntsman Corporation.
Other key players involved in the manufacturing of automotive composites include Magna, Mar-Bal, Plasan, UFP Technologies, Base Group, 3B Fiberglass, Delphi Auto, and others. The global automotive composites market report provides in-depth competitive analysis as well as profiles of these major players.
Key Benefits For Stakeholders
- This report provides a quantitative analysis of the market segments, current trends, estimations, and dynamics of the automotive composites market analysis from 2022 to 2032 to identify the prevailing automotive composites market opportunities.
- The market research is offered along with information related to key drivers, restraints, and opportunities.
- Porter's five forces analysis highlights the potency of buyers and suppliers to enable stakeholders make profit-oriented business decisions and strengthen their supplier-buyer network.
- In-depth analysis of the automotive composites market segmentation assists to determine the prevailing market opportunities.
- Major countries in each region are mapped according to their revenue contribution to the global market.
- Market player positioning facilitates benchmarking and provides a clear understanding of the present position of the market players.
- The report includes the analysis of the regional as well as global automotive composites market trends, key players, market segments, application areas, and market growth strategies.
Additional benefits you will get with this purchase are:
- Quarterly Update and* (only available with a corporate license, on listed price)
- 5 additional Company Profile of client Choice pre- or Post-purchase, as a free update.
- Free Upcoming Version on the Purchase of Five and Enterprise User License.
- 16 analyst hours of support* (post-purchase, if you find additional data requirements upon review of the report, you may receive support amounting to 16 analyst hours to solve questions, and post-sale queries)
- 15% Free Customization* (in case the scope or segment of the report does not match your requirements, 15% is equivalent to 3 working days of free work, applicable once)
- Free data Pack on the Five and Enterprise User License. (Excel version of the report)
- Free Updated report if the report is 6-12 months old or older.
- 24-hour priority response*
- Free Industry updates and white papers.
Possible Customization with this report (with additional cost and timeline, please talk to the sales executive to know more)
- Manufacturing Capacity
- Upcoming/New Entrant by Regions
- Technology Trend Analysis
- Market share analysis of players by products/segments
- New Product Development/ Product Matrix of Key Players
- Patient/epidemiology data at country, region, global level
- Regulatory Guidelines
- Additional company profiles with specific to client's interest
- Additional country or region analysis- market size and forecast
- Average Selling Price Analysis / Price Point Analysis
- Expanded list for Company Profiles
- Historic market data
- Import Export Analysis/Data
- Key player details (including location, contact details, supplier/vendor network etc. in excel format)
- List of customers/consumers/raw material suppliers- value chain analysis
- Market share analysis of players at global/region/country level
- SWOT Analysis
- Volume Market Size and Forecast
Key Market Segments
By Fiber Type
- Glass Fiber
- Carbon Fiber
- Others
By Resin Type
- Thermoset
- Thermoplastic
By Application
- Exterior
- Interior
- Others
By Region
- North America
- U.S.
- Canada
- Mexico
- Europe
- Germany
- UK
- France
- Spain
- Italy
- Rest of Europe
- Asia-Pacific
- China
- India
- Japan
- South Korea
- Australia
- Rest of Asia-Pacific
- LAMEA
- Brazil
- Saudi Arabia
- South Africa
- Rest of LAMEA
Key Market Players:
- TORAY INDUSTRIES, INC.
- SGL Carbon SE
- Teijin Limited
- TEIJIN LIMITED.
- Hexcel Corporation
- Owens Corning
- Mitsubishi Chemical Holdings Corporation
- Gurit Holding AG
- Solvay S.A.
- TenCate Advanced Composites
- Huntsman Corporation
TABLE OF CONTENTS
CHAPTER 1: INTRODUCTION
- 1.1. Report description
- 1.2. Key market segments
- 1.3. Key benefits to the stakeholders
- 1.4. Research methodology
- 1.4.1. Primary research
- 1.4.2. Secondary research
- 1.4.3. Analyst tools and models
CHAPTER 2: EXECUTIVE SUMMARY
- 2.1. CXO perspective
CHAPTER 3: MARKET OVERVIEW
- 3.1. Market definition and scope
- 3.2. Key findings
- 3.2.1. Top impacting factors
- 3.2.2. Top investment pockets
- 3.3. Porter's five forces analysis
- 3.4. Market dynamics
- 3.4.1. Drivers
- 3.4.2. Restraints
- 3.4.3. Opportunities
- 3.5. Value Chain Analysis
- 3.6. Pricing Analysis
- 3.7. Key Regulation Analysis
- 3.8. Patent Landscape
CHAPTER 4: AUTOMOTIVE COMPOSITES MARKET, BY FIBER TYPE
- 4.1. Overview
- 4.1.1. Market size and forecast
- 4.2. Glass Fiber
- 4.2.1. Key market trends, growth factors and opportunities
- 4.2.2. Market size and forecast, by region
- 4.2.3. Market share analysis by country
- 4.3. Carbon Fiber
- 4.3.1. Key market trends, growth factors and opportunities
- 4.3.2. Market size and forecast, by region
- 4.3.3. Market share analysis by country
- 4.4. Others
- 4.4.1. Key market trends, growth factors and opportunities
- 4.4.2. Market size and forecast, by region
- 4.4.3. Market share analysis by country
CHAPTER 5: AUTOMOTIVE COMPOSITES MARKET, BY RESIN TYPE
- 5.1. Overview
- 5.1.1. Market size and forecast
- 5.2. Thermoset
- 5.2.1. Key market trends, growth factors and opportunities
- 5.2.2. Market size and forecast, by region
- 5.2.3. Market share analysis by country
- 5.3. Thermoplastic
- 5.3.1. Key market trends, growth factors and opportunities
- 5.3.2. Market size and forecast, by region
- 5.3.3. Market share analysis by country
CHAPTER 6: AUTOMOTIVE COMPOSITES MARKET, BY APPLICATION
- 6.1. Overview
- 6.1.1. Market size and forecast
- 6.2. Exterior
- 6.2.1. Key market trends, growth factors and opportunities
- 6.2.2. Market size and forecast, by region
- 6.2.3. Market share analysis by country
- 6.3. Interior
- 6.3.1. Key market trends, growth factors and opportunities
- 6.3.2. Market size and forecast, by region
- 6.3.3. Market share analysis by country
- 6.4. Others
- 6.4.1. Key market trends, growth factors and opportunities
- 6.4.2. Market size and forecast, by region
- 6.4.3. Market share analysis by country
CHAPTER 7: AUTOMOTIVE COMPOSITES MARKET, BY REGION
- 7.1. Overview
- 7.1.1. Market size and forecast By Region
- 7.2. North America
- 7.2.1. Key market trends, growth factors and opportunities
- 7.2.2. Market size and forecast, by Fiber Type
- 7.2.3. Market size and forecast, by Resin Type
- 7.2.4. Market size and forecast, by Application
- 7.2.5. Market size and forecast, by country
- 7.2.5.1. U.S.
- 7.2.5.1.1. Market size and forecast, by Fiber Type
- 7.2.5.1.2. Market size and forecast, by Resin Type
- 7.2.5.1.3. Market size and forecast, by Application
- 7.2.5.2. Canada
- 7.2.5.2.1. Market size and forecast, by Fiber Type
- 7.2.5.2.2. Market size and forecast, by Resin Type
- 7.2.5.2.3. Market size and forecast, by Application
- 7.2.5.3. Mexico
- 7.2.5.3.1. Market size and forecast, by Fiber Type
- 7.2.5.3.2. Market size and forecast, by Resin Type
- 7.2.5.3.3. Market size and forecast, by Application
- 7.3. Europe
- 7.3.1. Key market trends, growth factors and opportunities
- 7.3.2. Market size and forecast, by Fiber Type
- 7.3.3. Market size and forecast, by Resin Type
- 7.3.4. Market size and forecast, by Application
- 7.3.5. Market size and forecast, by country
- 7.3.5.1. Germany
- 7.3.5.1.1. Market size and forecast, by Fiber Type
- 7.3.5.1.2. Market size and forecast, by Resin Type
- 7.3.5.1.3. Market size and forecast, by Application
- 7.3.5.2. UK
- 7.3.5.2.1. Market size and forecast, by Fiber Type
- 7.3.5.2.2. Market size and forecast, by Resin Type
- 7.3.5.2.3. Market size and forecast, by Application
- 7.3.5.3. France
- 7.3.5.3.1. Market size and forecast, by Fiber Type
- 7.3.5.3.2. Market size and forecast, by Resin Type
- 7.3.5.3.3. Market size and forecast, by Application
- 7.3.5.4. Spain
- 7.3.5.4.1. Market size and forecast, by Fiber Type
- 7.3.5.4.2. Market size and forecast, by Resin Type
- 7.3.5.4.3. Market size and forecast, by Application
- 7.3.5.5. Italy
- 7.3.5.5.1. Market size and forecast, by Fiber Type
- 7.3.5.5.2. Market size and forecast, by Resin Type
- 7.3.5.5.3. Market size and forecast, by Application
- 7.3.5.6. Rest of Europe
- 7.3.5.6.1. Market size and forecast, by Fiber Type
- 7.3.5.6.2. Market size and forecast, by Resin Type
- 7.3.5.6.3. Market size and forecast, by Application
- 7.4. Asia-Pacific
- 7.4.1. Key market trends, growth factors and opportunities
- 7.4.2. Market size and forecast, by Fiber Type
- 7.4.3. Market size and forecast, by Resin Type
- 7.4.4. Market size and forecast, by Application
- 7.4.5. Market size and forecast, by country
- 7.4.5.1. China
- 7.4.5.1.1. Market size and forecast, by Fiber Type
- 7.4.5.1.2. Market size and forecast, by Resin Type
- 7.4.5.1.3. Market size and forecast, by Application
- 7.4.5.2. India
- 7.4.5.2.1. Market size and forecast, by Fiber Type
- 7.4.5.2.2. Market size and forecast, by Resin Type
- 7.4.5.2.3. Market size and forecast, by Application
- 7.4.5.3. Japan
- 7.4.5.3.1. Market size and forecast, by Fiber Type
- 7.4.5.3.2. Market size and forecast, by Resin Type
- 7.4.5.3.3. Market size and forecast, by Application
- 7.4.5.4. South Korea
- 7.4.5.4.1. Market size and forecast, by Fiber Type
- 7.4.5.4.2. Market size and forecast, by Resin Type
- 7.4.5.4.3. Market size and forecast, by Application
- 7.4.5.5. Australia
- 7.4.5.5.1. Market size and forecast, by Fiber Type
- 7.4.5.5.2. Market size and forecast, by Resin Type
- 7.4.5.5.3. Market size and forecast, by Application
- 7.4.5.6. Rest of Asia-Pacific
- 7.4.5.6.1. Market size and forecast, by Fiber Type
- 7.4.5.6.2. Market size and forecast, by Resin Type
- 7.4.5.6.3. Market size and forecast, by Application
- 7.5. LAMEA
- 7.5.1. Key market trends, growth factors and opportunities
- 7.5.2. Market size and forecast, by Fiber Type
- 7.5.3. Market size and forecast, by Resin Type
- 7.5.4. Market size and forecast, by Application
- 7.5.5. Market size and forecast, by country
- 7.5.5.1. Brazil
- 7.5.5.1.1. Market size and forecast, by Fiber Type
- 7.5.5.1.2. Market size and forecast, by Resin Type
- 7.5.5.1.3. Market size and forecast, by Application
- 7.5.5.2. Saudi Arabia
- 7.5.5.2.1. Market size and forecast, by Fiber Type
- 7.5.5.2.2. Market size and forecast, by Resin Type
- 7.5.5.2.3. Market size and forecast, by Application
- 7.5.5.3. South Africa
- 7.5.5.3.1. Market size and forecast, by Fiber Type
- 7.5.5.3.2. Market size and forecast, by Resin Type
- 7.5.5.3.3. Market size and forecast, by Application
- 7.5.5.4. Rest of LAMEA
- 7.5.5.4.1. Market size and forecast, by Fiber Type
- 7.5.5.4.2. Market size and forecast, by Resin Type
- 7.5.5.4.3. Market size and forecast, by Application
CHAPTER 8: COMPETITIVE LANDSCAPE
- 8.1. Introduction
- 8.2. Top winning strategies
- 8.3. Product mapping of top 10 player
- 8.4. Competitive dashboard
- 8.5. Competitive heatmap
- 8.6. Top player positioning, 2022
CHAPTER 9: COMPANY PROFILES
- 9.1. TORAY INDUSTRIES, INC.
- 9.1.1. Company overview
- 9.1.2. Key executives
- 9.1.3. Company snapshot
- 9.1.4. Operating business segments
- 9.1.5. Product portfolio
- 9.1.6. Business performance
- 9.1.7. Key strategic moves and developments
- 9.2. SGL Carbon SE
- 9.2.1. Company overview
- 9.2.2. Key executives
- 9.2.3. Company snapshot
- 9.2.4. Operating business segments
- 9.2.5. Product portfolio
- 9.2.6. Business performance
- 9.2.7. Key strategic moves and developments
- 9.3. Teijin Limited
- 9.3.1. Company overview
- 9.3.2. Key executives
- 9.3.3. Company snapshot
- 9.3.4. Operating business segments
- 9.3.5. Product portfolio
- 9.3.6. Business performance
- 9.3.7. Key strategic moves and developments
- 9.4. TEIJIN LIMITED.
- 9.4.1. Company overview
- 9.4.2. Key executives
- 9.4.3. Company snapshot
- 9.4.4. Operating business segments
- 9.4.5. Product portfolio
- 9.4.6. Business performance
- 9.4.7. Key strategic moves and developments
- 9.5. Hexcel Corporation
- 9.5.1. Company overview
- 9.5.2. Key executives
- 9.5.3. Company snapshot
- 9.5.4. Operating business segments
- 9.5.5. Product portfolio
- 9.5.6. Business performance
- 9.5.7. Key strategic moves and developments
- 9.6. Owens Corning
- 9.6.1. Company overview
- 9.6.2. Key executives
- 9.6.3. Company snapshot
- 9.6.4. Operating business segments
- 9.6.5. Product portfolio
- 9.6.6. Business performance
- 9.6.7. Key strategic moves and developments
- 9.7. Mitsubishi Chemical Holdings Corporation
- 9.7.1. Company overview
- 9.7.2. Key executives
- 9.7.3. Company snapshot
- 9.7.4. Operating business segments
- 9.7.5. Product portfolio
- 9.7.6. Business performance
- 9.7.7. Key strategic moves and developments
- 9.8. Gurit Holding AG
- 9.8.1. Company overview
- 9.8.2. Key executives
- 9.8.3. Company snapshot
- 9.8.4. Operating business segments
- 9.8.5. Product portfolio
- 9.8.6. Business performance
- 9.8.7. Key strategic moves and developments
- 9.9. Solvay S.A.
- 9.9.1. Company overview
- 9.9.2. Key executives
- 9.9.3. Company snapshot
- 9.9.4. Operating business segments
- 9.9.5. Product portfolio
- 9.9.6. Business performance
- 9.9.7. Key strategic moves and developments
- 9.10. TenCate Advanced Composites
- 9.10.1. Company overview
- 9.10.2. Key executives
- 9.10.3. Company snapshot
- 9.10.4. Operating business segments
- 9.10.5. Product portfolio
- 9.10.6. Business performance
- 9.10.7. Key strategic moves and developments
- 9.11. Huntsman Corporation
- 9.11.1. Company overview
- 9.11.2. Key executives
- 9.11.3. Company snapshot
- 9.11.4. Operating business segments
- 9.11.5. Product portfolio
- 9.11.6. Business performance
- 9.11.7. Key strategic moves and developments
LIST OF TABLES
- TABLE 01. GLOBAL AUTOMOTIVE COMPOSITES MARKET, BY FIBER TYPE, 2022-2032 ($MILLION)
- TABLE 02. AUTOMOTIVE COMPOSITES MARKET FOR GLASS FIBER, BY REGION, 2022-2032 ($MILLION)
- TABLE 03. AUTOMOTIVE COMPOSITES MARKET FOR CARBON FIBER, BY REGION, 2022-2032 ($MILLION)
- TABLE 04. AUTOMOTIVE COMPOSITES MARKET FOR OTHERS, BY REGION, 2022-2032 ($MILLION)
- TABLE 05. GLOBAL AUTOMOTIVE COMPOSITES MARKET, BY RESIN TYPE, 2022-2032 ($MILLION)
- TABLE 06. AUTOMOTIVE COMPOSITES MARKET FOR THERMOSET, BY REGION, 2022-2032 ($MILLION)
- TABLE 07. AUTOMOTIVE COMPOSITES MARKET FOR THERMOPLASTIC, BY REGION, 2022-2032 ($MILLION)
- TABLE 08. GLOBAL AUTOMOTIVE COMPOSITES MARKET, BY APPLICATION, 2022-2032 ($MILLION)
- TABLE 09. AUTOMOTIVE COMPOSITES MARKET FOR EXTERIOR, BY REGION, 2022-2032 ($MILLION)
- TABLE 10. AUTOMOTIVE COMPOSITES MARKET FOR INTERIOR, BY REGION, 2022-2032 ($MILLION)
- TABLE 11. AUTOMOTIVE COMPOSITES MARKET FOR OTHERS, BY REGION, 2022-2032 ($MILLION)
- TABLE 12. AUTOMOTIVE COMPOSITES MARKET, BY REGION, 2022-2032 ($MILLION)
- TABLE 13. NORTH AMERICA AUTOMOTIVE COMPOSITES MARKET, BY FIBER TYPE, 2022-2032 ($MILLION)
- TABLE 14. NORTH AMERICA AUTOMOTIVE COMPOSITES MARKET, BY RESIN TYPE, 2022-2032 ($MILLION)
- TABLE 15. NORTH AMERICA AUTOMOTIVE COMPOSITES MARKET, BY APPLICATION, 2022-2032 ($MILLION)
- TABLE 16. NORTH AMERICA AUTOMOTIVE COMPOSITES MARKET, BY COUNTRY, 2022-2032 ($MILLION)
- TABLE 17. U.S. AUTOMOTIVE COMPOSITES MARKET, BY FIBER TYPE, 2022-2032 ($MILLION)
- TABLE 18. U.S. AUTOMOTIVE COMPOSITES MARKET, BY RESIN TYPE, 2022-2032 ($MILLION)
- TABLE 19. U.S. AUTOMOTIVE COMPOSITES MARKET, BY APPLICATION, 2022-2032 ($MILLION)
- TABLE 20. CANADA AUTOMOTIVE COMPOSITES MARKET, BY FIBER TYPE, 2022-2032 ($MILLION)
- TABLE 21. CANADA AUTOMOTIVE COMPOSITES MARKET, BY RESIN TYPE, 2022-2032 ($MILLION)
- TABLE 22. CANADA AUTOMOTIVE COMPOSITES MARKET, BY APPLICATION, 2022-2032 ($MILLION)
- TABLE 23. MEXICO AUTOMOTIVE COMPOSITES MARKET, BY FIBER TYPE, 2022-2032 ($MILLION)
- TABLE 24. MEXICO AUTOMOTIVE COMPOSITES MARKET, BY RESIN TYPE, 2022-2032 ($MILLION)
- TABLE 25. MEXICO AUTOMOTIVE COMPOSITES MARKET, BY APPLICATION, 2022-2032 ($MILLION)
- TABLE 26. EUROPE AUTOMOTIVE COMPOSITES MARKET, BY FIBER TYPE, 2022-2032 ($MILLION)
- TABLE 27. EUROPE AUTOMOTIVE COMPOSITES MARKET, BY RESIN TYPE, 2022-2032 ($MILLION)
- TABLE 28. EUROPE AUTOMOTIVE COMPOSITES MARKET, BY APPLICATION, 2022-2032 ($MILLION)
- TABLE 29. EUROPE AUTOMOTIVE COMPOSITES MARKET, BY COUNTRY, 2022-2032 ($MILLION)
- TABLE 30. GERMANY AUTOMOTIVE COMPOSITES MARKET, BY FIBER TYPE, 2022-2032 ($MILLION)
- TABLE 31. GERMANY AUTOMOTIVE COMPOSITES MARKET, BY RESIN TYPE, 2022-2032 ($MILLION)
- TABLE 32. GERMANY AUTOMOTIVE COMPOSITES MARKET, BY APPLICATION, 2022-2032 ($MILLION)
- TABLE 33. UK AUTOMOTIVE COMPOSITES MARKET, BY FIBER TYPE, 2022-2032 ($MILLION)
- TABLE 34. UK AUTOMOTIVE COMPOSITES MARKET, BY RESIN TYPE, 2022-2032 ($MILLION)
- TABLE 35. UK AUTOMOTIVE COMPOSITES MARKET, BY APPLICATION, 2022-2032 ($MILLION)
- TABLE 36. FRANCE AUTOMOTIVE COMPOSITES MARKET, BY FIBER TYPE, 2022-2032 ($MILLION)
- TABLE 37. FRANCE AUTOMOTIVE COMPOSITES MARKET, BY RESIN TYPE, 2022-2032 ($MILLION)
- TABLE 38. FRANCE AUTOMOTIVE COMPOSITES MARKET, BY APPLICATION, 2022-2032 ($MILLION)
- TABLE 39. SPAIN AUTOMOTIVE COMPOSITES MARKET, BY FIBER TYPE, 2022-2032 ($MILLION)
- TABLE 40. SPAIN AUTOMOTIVE COMPOSITES MARKET, BY RESIN TYPE, 2022-2032 ($MILLION)
- TABLE 41. SPAIN AUTOMOTIVE COMPOSITES MARKET, BY APPLICATION, 2022-2032 ($MILLION)
- TABLE 42. ITALY AUTOMOTIVE COMPOSITES MARKET, BY FIBER TYPE, 2022-2032 ($MILLION)
- TABLE 43. ITALY AUTOMOTIVE COMPOSITES MARKET, BY RESIN TYPE, 2022-2032 ($MILLION)
- TABLE 44. ITALY AUTOMOTIVE COMPOSITES MARKET, BY APPLICATION, 2022-2032 ($MILLION)
- TABLE 45. REST OF EUROPE AUTOMOTIVE COMPOSITES MARKET, BY FIBER TYPE, 2022-2032 ($MILLION)
- TABLE 46. REST OF EUROPE AUTOMOTIVE COMPOSITES MARKET, BY RESIN TYPE, 2022-2032 ($MILLION)
- TABLE 47. REST OF EUROPE AUTOMOTIVE COMPOSITES MARKET, BY APPLICATION, 2022-2032 ($MILLION)
- TABLE 48. ASIA-PACIFIC AUTOMOTIVE COMPOSITES MARKET, BY FIBER TYPE, 2022-2032 ($MILLION)
- TABLE 49. ASIA-PACIFIC AUTOMOTIVE COMPOSITES MARKET, BY RESIN TYPE, 2022-2032 ($MILLION)
- TABLE 50. ASIA-PACIFIC AUTOMOTIVE COMPOSITES MARKET, BY APPLICATION, 2022-2032 ($MILLION)
- TABLE 51. ASIA-PACIFIC AUTOMOTIVE COMPOSITES MARKET, BY COUNTRY, 2022-2032 ($MILLION)
- TABLE 52. CHINA AUTOMOTIVE COMPOSITES MARKET, BY FIBER TYPE, 2022-2032 ($MILLION)
- TABLE 53. CHINA AUTOMOTIVE COMPOSITES MARKET, BY RESIN TYPE, 2022-2032 ($MILLION)
- TABLE 54. CHINA AUTOMOTIVE COMPOSITES MARKET, BY APPLICATION, 2022-2032 ($MILLION)
- TABLE 55. INDIA AUTOMOTIVE COMPOSITES MARKET, BY FIBER TYPE, 2022-2032 ($MILLION)
- TABLE 56. INDIA AUTOMOTIVE COMPOSITES MARKET, BY RESIN TYPE, 2022-2032 ($MILLION)
- TABLE 57. INDIA AUTOMOTIVE COMPOSITES MARKET, BY APPLICATION, 2022-2032 ($MILLION)
- TABLE 58. JAPAN AUTOMOTIVE COMPOSITES MARKET, BY FIBER TYPE, 2022-2032 ($MILLION)
- TABLE 59. JAPAN AUTOMOTIVE COMPOSITES MARKET, BY RESIN TYPE, 2022-2032 ($MILLION)
- TABLE 60. JAPAN AUTOMOTIVE COMPOSITES MARKET, BY APPLICATION, 2022-2032 ($MILLION)
- TABLE 61. SOUTH KOREA AUTOMOTIVE COMPOSITES MARKET, BY FIBER TYPE, 2022-2032 ($MILLION)
- TABLE 62. SOUTH KOREA AUTOMOTIVE COMPOSITES MARKET, BY RESIN TYPE, 2022-2032 ($MILLION)
- TABLE 63. SOUTH KOREA AUTOMOTIVE COMPOSITES MARKET, BY APPLICATION, 2022-2032 ($MILLION)
- TABLE 64. AUSTRALIA AUTOMOTIVE COMPOSITES MARKET, BY FIBER TYPE, 2022-2032 ($MILLION)
- TABLE 65. AUSTRALIA AUTOMOTIVE COMPOSITES MARKET, BY RESIN TYPE, 2022-2032 ($MILLION)
- TABLE 66. AUSTRALIA AUTOMOTIVE COMPOSITES MARKET, BY APPLICATION, 2022-2032 ($MILLION)
- TABLE 67. REST OF ASIA-PACIFIC AUTOMOTIVE COMPOSITES MARKET, BY FIBER TYPE, 2022-2032 ($MILLION)
- TABLE 68. REST OF ASIA-PACIFIC AUTOMOTIVE COMPOSITES MARKET, BY RESIN TYPE, 2022-2032 ($MILLION)
- TABLE 69. REST OF ASIA-PACIFIC AUTOMOTIVE COMPOSITES MARKET, BY APPLICATION, 2022-2032 ($MILLION)
- TABLE 70. LAMEA AUTOMOTIVE COMPOSITES MARKET, BY FIBER TYPE, 2022-2032 ($MILLION)
- TABLE 71. LAMEA AUTOMOTIVE COMPOSITES MARKET, BY RESIN TYPE, 2022-2032 ($MILLION)
- TABLE 72. LAMEA AUTOMOTIVE COMPOSITES MARKET, BY APPLICATION, 2022-2032 ($MILLION)
- TABLE 73. LAMEA AUTOMOTIVE COMPOSITES MARKET, BY COUNTRY, 2022-2032 ($MILLION)
- TABLE 74. BRAZIL AUTOMOTIVE COMPOSITES MARKET, BY FIBER TYPE, 2022-2032 ($MILLION)
- TABLE 75. BRAZIL AUTOMOTIVE COMPOSITES MARKET, BY RESIN TYPE, 2022-2032 ($MILLION)
- TABLE 76. BRAZIL AUTOMOTIVE COMPOSITES MARKET, BY APPLICATION, 2022-2032 ($MILLION)
- TABLE 77. SAUDI ARABIA AUTOMOTIVE COMPOSITES MARKET, BY FIBER TYPE, 2022-2032 ($MILLION)
- TABLE 78. SAUDI ARABIA AUTOMOTIVE COMPOSITES MARKET, BY RESIN TYPE, 2022-2032 ($MILLION)
- TABLE 79. SAUDI ARABIA AUTOMOTIVE COMPOSITES MARKET, BY APPLICATION, 2022-2032 ($MILLION)
- TABLE 80. SOUTH AFRICA AUTOMOTIVE COMPOSITES MARKET, BY FIBER TYPE, 2022-2032 ($MILLION)
- TABLE 81. SOUTH AFRICA AUTOMOTIVE COMPOSITES MARKET, BY RESIN TYPE, 2022-2032 ($MILLION)
- TABLE 82. SOUTH AFRICA AUTOMOTIVE COMPOSITES MARKET, BY APPLICATION, 2022-2032 ($MILLION)
- TABLE 83. REST OF LAMEA AUTOMOTIVE COMPOSITES MARKET, BY FIBER TYPE, 2022-2032 ($MILLION)
- TABLE 84. REST OF LAMEA AUTOMOTIVE COMPOSITES MARKET, BY RESIN TYPE, 2022-2032 ($MILLION)
- TABLE 85. REST OF LAMEA AUTOMOTIVE COMPOSITES MARKET, BY APPLICATION, 2022-2032 ($MILLION)
- TABLE 86. TORAY INDUSTRIES, INC.: KEY EXECUTIVES
- TABLE 87. TORAY INDUSTRIES, INC.: COMPANY SNAPSHOT
- TABLE 88. TORAY INDUSTRIES, INC.: PRODUCT SEGMENTS
- TABLE 89. TORAY INDUSTRIES, INC.: SERVICE SEGMENTS
- TABLE 90. TORAY INDUSTRIES, INC.: PRODUCT PORTFOLIO
- TABLE 91. TORAY INDUSTRIES, INC.: KEY STRATERGIES
- TABLE 92. SGL CARBON SE: KEY EXECUTIVES
- TABLE 93. SGL CARBON SE: COMPANY SNAPSHOT
- TABLE 94. SGL CARBON SE: PRODUCT SEGMENTS
- TABLE 95. SGL CARBON SE: SERVICE SEGMENTS
- TABLE 96. SGL CARBON SE: PRODUCT PORTFOLIO
- TABLE 97. SGL CARBON SE: KEY STRATERGIES
- TABLE 98. TEIJIN LIMITED: KEY EXECUTIVES
- TABLE 99. TEIJIN LIMITED: COMPANY SNAPSHOT
- TABLE 100. TEIJIN LIMITED: PRODUCT SEGMENTS
- TABLE 101. TEIJIN LIMITED: SERVICE SEGMENTS
- TABLE 102. TEIJIN LIMITED: PRODUCT PORTFOLIO
- TABLE 103. TEIJIN LIMITED: KEY STRATERGIES
- TABLE 104. TEIJIN LIMITED.: KEY EXECUTIVES
- TABLE 105. TEIJIN LIMITED.: COMPANY SNAPSHOT
- TABLE 106. TEIJIN LIMITED.: PRODUCT SEGMENTS
- TABLE 107. TEIJIN LIMITED.: SERVICE SEGMENTS
- TABLE 108. TEIJIN LIMITED.: PRODUCT PORTFOLIO
- TABLE 109. TEIJIN LIMITED.: KEY STRATERGIES
- TABLE 110. HEXCEL CORPORATION: KEY EXECUTIVES
- TABLE 111. HEXCEL CORPORATION: COMPANY SNAPSHOT
- TABLE 112. HEXCEL CORPORATION: PRODUCT SEGMENTS
- TABLE 113. HEXCEL CORPORATION: SERVICE SEGMENTS
- TABLE 114. HEXCEL CORPORATION: PRODUCT PORTFOLIO
- TABLE 115. HEXCEL CORPORATION: KEY STRATERGIES
- TABLE 116. OWENS CORNING: KEY EXECUTIVES
- TABLE 117. OWENS CORNING: COMPANY SNAPSHOT
- TABLE 118. OWENS CORNING: PRODUCT SEGMENTS
- TABLE 119. OWENS CORNING: SERVICE SEGMENTS
- TABLE 120. OWENS CORNING: PRODUCT PORTFOLIO
- TABLE 121. OWENS CORNING: KEY STRATERGIES
- TABLE 122. MITSUBISHI CHEMICAL HOLDINGS CORPORATION: KEY EXECUTIVES
- TABLE 123. MITSUBISHI CHEMICAL HOLDINGS CORPORATION: COMPANY SNAPSHOT
- TABLE 124. MITSUBISHI CHEMICAL HOLDINGS CORPORATION: PRODUCT SEGMENTS
- TABLE 125. MITSUBISHI CHEMICAL HOLDINGS CORPORATION: SERVICE SEGMENTS
- TABLE 126. MITSUBISHI CHEMICAL HOLDINGS CORPORATION: PRODUCT PORTFOLIO
- TABLE 127. MITSUBISHI CHEMICAL HOLDINGS CORPORATION: KEY STRATERGIES
- TABLE 128. GURIT HOLDING AG: KEY EXECUTIVES
- TABLE 129. GURIT HOLDING AG: COMPANY SNAPSHOT
- TABLE 130. GURIT HOLDING AG: PRODUCT SEGMENTS
- TABLE 131. GURIT HOLDING AG: SERVICE SEGMENTS
- TABLE 132. GURIT HOLDING AG: PRODUCT PORTFOLIO
- TABLE 133. GURIT HOLDING AG: KEY STRATERGIES
- TABLE 134. SOLVAY S.A.: KEY EXECUTIVES
- TABLE 135. SOLVAY S.A.: COMPANY SNAPSHOT
- TABLE 136. SOLVAY S.A.: PRODUCT SEGMENTS
- TABLE 137. SOLVAY S.A.: SERVICE SEGMENTS
- TABLE 138. SOLVAY S.A.: PRODUCT PORTFOLIO
- TABLE 139. SOLVAY S.A.: KEY STRATERGIES
- TABLE 140. TENCATE ADVANCED COMPOSITES: KEY EXECUTIVES
- TABLE 141. TENCATE ADVANCED COMPOSITES: COMPANY SNAPSHOT
- TABLE 142. TENCATE ADVANCED COMPOSITES: PRODUCT SEGMENTS
- TABLE 143. TENCATE ADVANCED COMPOSITES: SERVICE SEGMENTS
- TABLE 144. TENCATE ADVANCED COMPOSITES: PRODUCT PORTFOLIO
- TABLE 145. TENCATE ADVANCED COMPOSITES: KEY STRATERGIES
- TABLE 146. HUNTSMAN CORPORATION: KEY EXECUTIVES
- TABLE 147. HUNTSMAN CORPORATION: COMPANY SNAPSHOT
- TABLE 148. HUNTSMAN CORPORATION: PRODUCT SEGMENTS
- TABLE 149. HUNTSMAN CORPORATION: SERVICE SEGMENTS
- TABLE 150. HUNTSMAN CORPORATION: PRODUCT PORTFOLIO
- TABLE 151. HUNTSMAN CORPORATION: KEY STRATERGIES
LIST OF FIGURES
- FIGURE 01. AUTOMOTIVE COMPOSITES MARKET, 2022-2032
- FIGURE 02. SEGMENTATION OF AUTOMOTIVE COMPOSITES MARKET,2022-2032
- FIGURE 03. TOP IMPACTING FACTORS IN AUTOMOTIVE COMPOSITES MARKET
- FIGURE 04. TOP INVESTMENT POCKETS IN AUTOMOTIVE COMPOSITES MARKET (2023-2032)
- FIGURE 05. BARGAINING POWER OF SUPPLIERS
- FIGURE 06. BARGAINING POWER OF BUYERS
- FIGURE 07. THREAT OF SUBSTITUTION
- FIGURE 08. THREAT OF SUBSTITUTION
- FIGURE 09. COMPETITIVE RIVALRY
- FIGURE 10. GLOBAL AUTOMOTIVE COMPOSITES MARKET:DRIVERS, RESTRAINTS AND OPPORTUNITIES
- FIGURE 11. PRICING ANALYSIS: AUTOMOTIVE COMPOSITES MARKET 2022 AND 2032
- FIGURE 12. IMPACT OF KEY REGULATION: AUTOMOTIVE COMPOSITES MARKET
- FIGURE 13. PATENT ANALYSIS BY COMPANY
- FIGURE 14. PATENT ANALYSIS BY COUNTRY
- FIGURE 15. AUTOMOTIVE COMPOSITES MARKET, BY FIBER TYPE, 2022 AND 2032(%)
- FIGURE 16. COMPARATIVE SHARE ANALYSIS OF AUTOMOTIVE COMPOSITES MARKET FOR GLASS FIBER, BY COUNTRY 2022 AND 2032(%)
- FIGURE 17. COMPARATIVE SHARE ANALYSIS OF AUTOMOTIVE COMPOSITES MARKET FOR CARBON FIBER, BY COUNTRY 2022 AND 2032(%)
- FIGURE 18. COMPARATIVE SHARE ANALYSIS OF AUTOMOTIVE COMPOSITES MARKET FOR OTHERS, BY COUNTRY 2022 AND 2032(%)
- FIGURE 19. AUTOMOTIVE COMPOSITES MARKET, BY RESIN TYPE, 2022 AND 2032(%)
- FIGURE 20. COMPARATIVE SHARE ANALYSIS OF AUTOMOTIVE COMPOSITES MARKET FOR THERMOSET, BY COUNTRY 2022 AND 2032(%)
- FIGURE 21. COMPARATIVE SHARE ANALYSIS OF AUTOMOTIVE COMPOSITES MARKET FOR THERMOPLASTIC, BY COUNTRY 2022 AND 2032(%)
- FIGURE 22. AUTOMOTIVE COMPOSITES MARKET, BY APPLICATION, 2022 AND 2032(%)
- FIGURE 23. COMPARATIVE SHARE ANALYSIS OF AUTOMOTIVE COMPOSITES MARKET FOR EXTERIOR, BY COUNTRY 2022 AND 2032(%)
- FIGURE 24. COMPARATIVE SHARE ANALYSIS OF AUTOMOTIVE COMPOSITES MARKET FOR INTERIOR, BY COUNTRY 2022 AND 2032(%)
- FIGURE 25. COMPARATIVE SHARE ANALYSIS OF AUTOMOTIVE COMPOSITES MARKET FOR OTHERS, BY COUNTRY 2022 AND 2032(%)
- FIGURE 26. AUTOMOTIVE COMPOSITES MARKET BY REGION, 2022 AND 2032(%)
- FIGURE 27. U.S. AUTOMOTIVE COMPOSITES MARKET, 2022-2032 ($MILLION)
- FIGURE 28. CANADA AUTOMOTIVE COMPOSITES MARKET, 2022-2032 ($MILLION)
- FIGURE 29. MEXICO AUTOMOTIVE COMPOSITES MARKET, 2022-2032 ($MILLION)
- FIGURE 30. GERMANY AUTOMOTIVE COMPOSITES MARKET, 2022-2032 ($MILLION)
- FIGURE 31. UK AUTOMOTIVE COMPOSITES MARKET, 2022-2032 ($MILLION)
- FIGURE 32. FRANCE AUTOMOTIVE COMPOSITES MARKET, 2022-2032 ($MILLION)
- FIGURE 33. SPAIN AUTOMOTIVE COMPOSITES MARKET, 2022-2032 ($MILLION)
- FIGURE 34. ITALY AUTOMOTIVE COMPOSITES MARKET, 2022-2032 ($MILLION)
- FIGURE 35. REST OF EUROPE AUTOMOTIVE COMPOSITES MARKET, 2022-2032 ($MILLION)
- FIGURE 36. CHINA AUTOMOTIVE COMPOSITES MARKET, 2022-2032 ($MILLION)
- FIGURE 37. INDIA AUTOMOTIVE COMPOSITES MARKET, 2022-2032 ($MILLION)
- FIGURE 38. JAPAN AUTOMOTIVE COMPOSITES MARKET, 2022-2032 ($MILLION)
- FIGURE 39. SOUTH KOREA AUTOMOTIVE COMPOSITES MARKET, 2022-2032 ($MILLION)
- FIGURE 40. AUSTRALIA AUTOMOTIVE COMPOSITES MARKET, 2022-2032 ($MILLION)
- FIGURE 41. REST OF ASIA-PACIFIC AUTOMOTIVE COMPOSITES MARKET, 2022-2032 ($MILLION)
- FIGURE 42. BRAZIL AUTOMOTIVE COMPOSITES MARKET, 2022-2032 ($MILLION)
- FIGURE 43. SAUDI ARABIA AUTOMOTIVE COMPOSITES MARKET, 2022-2032 ($MILLION)
- FIGURE 44. SOUTH AFRICA AUTOMOTIVE COMPOSITES MARKET, 2022-2032 ($MILLION)
- FIGURE 45. REST OF LAMEA AUTOMOTIVE COMPOSITES MARKET, 2022-2032 ($MILLION)
- FIGURE 46. TOP WINNING STRATEGIES, BY YEAR
- FIGURE 47. TOP WINNING STRATEGIES, BY DEVELOPMENT
- FIGURE 48. TOP WINNING STRATEGIES, BY COMPANY
- FIGURE 49. PRODUCT MAPPING OF TOP 10 PLAYERS
- FIGURE 50. COMPETITIVE DASHBOARD
- FIGURE 51. COMPETITIVE HEATMAP: AUTOMOTIVE COMPOSITES MARKET
- FIGURE 52. TOP PLAYER POSITIONING, 2022
 汽车先进高抗拉强度钢 (AHSS) 市场 - 全球及区域分析:按产品、应用和国家 - 分析与预测(2025 年至 2034 年)
 2025年全球汽车复合材料市场报告2025年全球汽车弹性体市场报告
 全球汽车复合材料市场研究报告 - 产业分析、规模、份额、成长、趋势和预测 2025 年至 2033 年全球汽车弹性体市场研究报告 - 产业分析、规模、份额、成长、趋势和预测 2025 年至 2033 年
 汽车聚合物复合材料市场规模、占有率、趋势、行业分析报告(按材料、製造工艺、产品、应用、最终用户和地区)- 2025-2034 年市场预测
 汽车聚合物复合材料市场(按树脂类型、产品、製造流程、应用、最终用途和地区划分)2025 年至 2033 年
 汽车复合材料市场规模、份额及成长分析(按车型、纤维类型、製造工艺、树脂类型、应用及地区)- 2025-2032 年产业预测汽车合成橡胶市场规模、份额和成长分析(按类型、应用、车辆类型和地区)- 2025-2032 年产业预测全球汽车复合材料市场(2018-2034)