


 |
市场调查报告书
商品编码
1472328
按类型和应用分類的全球海底电池市场:机会分析和产业预测(2024-2033)Submarine Battery Market By Type (Lead-acid batteries, Lithium-ion batteries, Silver-zinc batteries, Nickel-cadmium batteries, Others), By Application (Civil, Military): Global Opportunity Analysis and Industry Forecast, 2024-2033 |
||||||
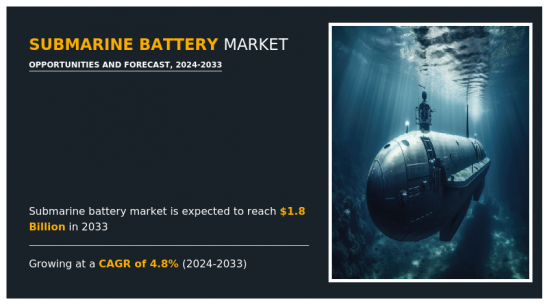
2023年全球海底电池市场规模为11亿美元,预计2033年将达18亿美元,2024年至2033年复合年增长率为4.8%。
潜水艇电池市场是指涉及专门为潜艇设计的电池的生产、分销和维护的行业。这些电池对于为潜艇上的各种系统供电非常重要,包括推进、导航、通讯和生命维持。潜水艇电池通常是可充电的,并且通常基于铅酸、镍镉 (NiCd) 和锂离子等先进技术。潜舰电池市场受到海军舰队现代化和扩张、潜舰技术进步以及对水下航行器再生能源来源日益关注等因素的推动。
电池性能的技术进步在推动潜艇电池需求方面发挥着至关重要的作用。随着全球国防环境的变化,潜艇的隐身性、耐用性和能力都被期望提高,这需要能够满足这些严格要求的电池。电池管理系统 (BMS) 的进步有助于提高整体效能和安全性。这些系统监控温度、电压和充电状态等各种参数,以优化电池运作并防止过热和过度充电等潜在危险。所有这些因素预计将在预测期内推动海底电池市场的需求。
高昂的初始投资成本是限制海底电池市场成长的主要因素。开发和采购潜艇电池所需的高昂初始成本对于海军组织和国防承包商,尤其是那些预算有限的组织和国防承包商来说可能是一个挑战。这些成本包括先进电池技术的采购、相关基础设施升级以及将这些电池有效地实施到潜艇系统中所需的整合工作。此外,潜舰电池的特殊性质加剧了高昂的初始投资成本。潜水艇需要能够承受水下作业的严酷环境的电池,包括极端压力、温度变化和长时间断电。满足这些严格的要求需要使用最先进的材料和製造工艺,从而显着增加製造成本。所有这些因素都阻碍了海底电池市场的成长。
对无人水下航行器日益增长的需求为潜艇电池市场带来了巨大的机会。无人水下航行器,包括各种水下无人机和自主航行器,越来越多地用于各种应用,包括海洋研究、水下测绘、环境监测和海上安全行动。潜水艇电池是无人潜航器的关键组成部分,提供在水下推进无人潜航器并保持舰载系统长时间运作所需的电力。随着无人潜航器的功能和应用不断扩大,对能够有效支援其任务的高性能电池的需求也不断增加。所有这些因素预计将在预测期内为海底电池市场提供新的成长机会。
海底电池市场按类型、最终用途行业和地区细分。依类型划分,市场分为铅酸电池、锂离子电池、银锌电池、镍镉电池等。根据应用,市场分为民用和军用。从区域来看,分析涵盖北美、欧洲、亚太地区和拉丁美洲/中东/非洲。预计到 2023 年,锂离子电池领域将在全球海底电池市场占有率中占据主导地位,并在预测期内保持其主导地位。军事领域预计将在 2023 年占据市场主导地位,并在海底电池市场预测期内保持主导地位。预计亚太地区将在 2023 年主导市场,并在预测期内保持主导地位。
相关人员的主要利益
- 本报告定量分析了 2023 年至 2033 年海底电池市场分析的细分市场、当前趋势、估计/趋势和动态,以确定海底电池市场的强大机会。
- 我们提供市场研究以及与市场驱动因素、市场限制和市场机会相关的资讯。
- 波特的五力分析强调买家和供应商帮助相关人员做出利润驱动的商业决策并加强供应商-买家网路的潜力。
- 潜水艇电池市场细分的详细分析有助于识别市场机会。
- 每个地区的主要国家都根据其对全球市场的收益贡献绘製了地图。
- 市场公司定位有助于基准化分析并提供对市场公司当前地位的清晰了解。
- 该报告包括对区域和全球海底电池市场趋势、主要企业、细分市场、应用领域和市场成长策略的分析。
使用此报告可以进行报告客製化(请联络销售人员以了解额外费用和时间表)
- 根据客户兴趣加入公司简介
- 按国家或地区进行的附加分析 – 市场规模和预测
- 主要企业详细资料(Excel 格式,包括位置、联络资讯、供应商/供应商网路等)
- 客户/消费者/原料供应商名单:价值链分析
- 全球/区域/国家层级公司的市场占有率分析
- SWOT分析
目录
第一章简介
第 2 章执行摘要
第三章市场概况
- 市场定义和范围
- 主要发现
- 影响因素
- 主要投资机会
- 波特五力分析
- 市场动态
- 促进因素
- 抑制因素
- 机会
- 价值链分析
第四章海底电池市场:依类型
- 概述
- 铅酸蓄电池
- 锂离子电池
- 银/锌电池
- 镍镉电池
- 其他的
第五章海底电池市场:依应用分类
- 概述
- 民用
- 军事用途
第六章海底电池市场:依地区
- 概述
- 北美洲
- 美国
- 加拿大
- 墨西哥
- 欧洲
- 德国
- 英国
- 法国
- 义大利
- 西班牙
- 其他的
- 亚太地区
- 中国
- 日本
- 印度
- 韩国
- 澳洲
- 其他的
- 拉丁美洲/中东/非洲
- 巴西
- 沙乌地阿拉伯
- 南非
- 其他的
第七章 竞争格局
- 介绍
- 关键成功策略
- 10家主要企业产品图谱
- 竞争对手仪表板
- 竞争热图
- 主要企业定位(2023年)
第八章 公司简介
- EnerSys
- Ever Exceed Corporation
- EXIDE INDUSTRIES LTD.
- GS Yuasa Corporation
- HBL POWER SYSTEMS LIMITED
- Korea Special Battery Co., Ltd.
- Kokam Battery
- Epsilor-Electric Fuel Ltd.
- ZIBO TORCH ENERGY CO., LTD.
- TOSHIBA CORPORATION
The global submarine battery market was valued at $1.1 billion in 2023, and is projected to reach $1.8 billion by 2033, registering a CAGR of 4.8% from 2024 to 2033.
The submarine battery market refers to the industry involved in manufacturing, distribution, and maintenance of batteries specifically designed for use in submarines. These batteries are crucial for powering various systems on board submarines, such as propulsion, navigation, communication, and life support Submarine batteries are typically rechargeable and are often based on advanced technologies such as lead-acid, nickel-cadmium (NiCd), or lithium-ion. The market for submarine batteries is driven by factors such as the modernization and expansion of naval fleets, advancements in submarine technology, and the increasing focus on renewable energy sources for underwater vehicles.
Technological advancements in battery performance play a pivotal role in driving the demand for submarine batteries. Submarines are anticipated to operate with increased stealth, endurance, and capability as the world's defense environment changes, requiring batteries that can fulfill these demanding requirements. Advancements in battery management systems (BMS) contribute to enhancing overall performance and safety. These systems monitor various parameters such as temperature, voltage, and state of charge to optimize battery operation and prevent potential hazards such as overheating or overcharging. All these factors are expected to drive the demand for submarine battery market during the forecast period.
High initial investment costs represent a significant restraint on the growth of the submarine battery market. The development and acquisition of submarine batteries entail substantial upfront expenses, which can pose challenges for naval organizations and defense contractors, particularly those with constrained budgets. These costs include the procurement of advanced battery technologies as well as the associated infrastructure upgrades and integration efforts required to implement these batteries into submarine systems effectively. Furthermore, high initial investment costs are exacerbated by the specialized nature of submarine batteries. Submarines demand batteries tailored to withstand the rigors of underwater operations, including extreme pressures, temperature variations, and prolonged periods of disuse. Meeting these stringent requirements necessitates the use of cutting-edge materials and manufacturing processes, driving up production costs significantly. All these factors hamper the submarine battery market growth.
Rise in demand for unmanned underwater vehicles presents significant opportunities for the submarine battery market. Unmanned underwater vehicles, which include a variety of underwater drones and autonomous vehicles, are increasingly utilized for a range of applications including oceanographic research, underwater mapping, environmental monitoring, and maritime security operations. Submarine batteries are a critical component of UUVs, providing the power needed to propel these vehicles through the water and operate their onboard systems for extended periods. As the capabilities and applications of UUVs continue to expand, so does the demand for high-performance batteries that can support their missions effectively. All these factors are anticipated to offer new growth opportunities for the submarine battery market during the forecast period.
The submarine battery market is segmented on the basis of type, end-use industry, and region. On the basis of type, the market is divided into lead-acid batteries, lithium-ion batteries, silver-zinc batteries, nickel-cadmium batteries, and others. On the basis of application, the market is segmented into civil and military. Region-wise, the market is analyzed across North America, Europe, Asia-Pacific, and LAMEA.
The submarine battery market is segmented on the basis of type, end-use industry, and region. On the basis of type, the market is divided into lead-acid batteries, lithium-ion batteries, silver-zinc batteries, nickel-cadmium batteries, and others. On the basis of application, the market is segmented into civil and military. Region-wise, the market is analyzed across North America, Europe, Asia-Pacific, and LAMEA. Lithium-ion batteries segment dominated global submarine battery market share in 2023 and is expected to maintain its dominance during the forecast period. On the basis of application, the market is segmented into civil and military. The military segment dominated the market in 2023 and is expected to maintain its dominance during the submarine battery market forecast period.Region-wise, the submarine battery market analysis is done across North America, Europe, Asia-Pacific, and LAMEA. Asia-Pacific dominated market in 2023 and is expected to maintain its dominance during the forecast period.
Key players in the submarine battery market include ENERSYS., Ever Exceed Corporation, EXIDE INDUSTRIES LTD, GS Yuasa Corporation, HBL Power Systems Limited, Korea Special Battery Co., Ltd., Kokam Battery., Epsilor-Electric Fuel Ltd., ZIBO TORCH ENERGY CO., LTD., and Toshiba Corporation. Apart from these major players, there are other key players in the submarine battery market. These include LG Chem Ltd., Samsung SDI Co., Ltd., Mitsubishi Electric Corporation, Hindustan Aeronautics Limited (HAL), Rolls-Royce Holdings plc, and General Dynamics Corporation.
Key Benefits For Stakeholders
- This report provides a quantitative analysis of the market segments, current trends, estimations, and dynamics of the submarine battery market analysis from 2023 to 2033 to identify the prevailing submarine battery market opportunities.
- The market research is offered along with information related to key drivers, restraints, and opportunities.
- Porter's five forces analysis highlights the potency of buyers and suppliers to enable stakeholders make profit-oriented business decisions and strengthen their supplier-buyer network.
- In-depth analysis of the submarine battery market segmentation assists to determine the prevailing market opportunities.
- Major countries in each region are mapped according to their revenue contribution to the global market.
- Market player positioning facilitates benchmarking and provides a clear understanding of the present position of the market players.
- The report includes the analysis of the regional as well as global submarine battery market trends, key players, market segments, application areas, and market growth strategies.
Additional benefits you will get with this purchase are:
- Quarterly Update and* (only available with a corporate license, on listed price)
- 5 additional Company Profile of client Choice pre- or Post-purchase, as a free update.
- Free Upcoming Version on the Purchase of Five and Enterprise User License.
- 16 analyst hours of support* (post-purchase, if you find additional data requirements upon review of the report, you may receive support amounting to 16 analyst hours to solve questions, and post-sale queries)
- 15% Free Customization* (in case the scope or segment of the report does not match your requirements, 15% is equivalent to 3 working days of free work, applicable once)
- Free data Pack on the Five and Enterprise User License. (Excel version of the report)
- Free Updated report if the report is 6-12 months old or older.
- 24-hour priority response*
- Free Industry updates and white papers.
Possible Customization with this report (with additional cost and timeline, please talk to the sales executive to know more)
- Additional company profiles with specific to client's interest
- Additional country or region analysis- market size and forecast
- Key player details (including location, contact details, supplier/vendor network etc. in excel format)
- List of customers/consumers/raw material suppliers- value chain analysis
- Market share analysis of players at global/region/country level
- SWOT Analysis
Key Market Segments
By Type
- Silver-zinc batteries
- Nickel-cadmium batteries
- Lead-acid batteries
- Lithium-ion batteries
- Others
By Application
- Civil
- Military
By Region
- North America
- U.S.
- Canada
- Mexico
- Europe
- Germany
- UK
- France
- Italy
- Spain
- Rest of Europe
- Asia-Pacific
- China
- Japan
- India
- South Korea
- Australia
- Rest of Asia-Pacific
- LAMEA
- Brazil
- Saudi Arabia
- South Africa
- Rest of Asia-Pacific
Key Market Players:
- EnerSys
- Ever Exceed Corporation
- EXIDE INDUSTRIES LTD.
- GS Yuasa Corporation
- HBL POWER SYSTEMS LIMITED
- Korea Special Battery Co., Ltd.
- Kokam Battery
- Epsilor-Electric Fuel Ltd.
- ZIBO TORCH ENERGY CO., LTD.
- TOSHIBA CORPORATION
TABLE OF CONTENTS
CHAPTER 1: INTRODUCTION
- 1.1. Report description
- 1.2. Key market segments
- 1.3. Key benefits to the stakeholders
- 1.4. Research methodology
- 1.4.1. Primary research
- 1.4.2. Secondary research
- 1.4.3. Analyst tools and models
CHAPTER 2: EXECUTIVE SUMMARY
- 2.1. CXO perspective
CHAPTER 3: MARKET OVERVIEW
- 3.1. Market definition and scope
- 3.2. Key findings
- 3.2.1. Top impacting factors
- 3.2.2. Top investment pockets
- 3.3. Porter's five forces analysis
- 3.4. Market dynamics
- 3.4.1. Drivers
- 3.4.2. Restraints
- 3.4.3. Opportunities
- 3.5. Value Chain Analysis
CHAPTER 4: SUBMARINE BATTERY MARKET, BY TYPE
- 4.1. Overview
- 4.1.1. Market size and forecast
- 4.2. Lead-acid batteries
- 4.2.1. Key market trends, growth factors and opportunities
- 4.2.2. Market size and forecast, by region
- 4.2.3. Market share analysis by country
- 4.3. Lithium-ion batteries
- 4.3.1. Key market trends, growth factors and opportunities
- 4.3.2. Market size and forecast, by region
- 4.3.3. Market share analysis by country
- 4.4. Silver-zinc batteries
- 4.4.1. Key market trends, growth factors and opportunities
- 4.4.2. Market size and forecast, by region
- 4.4.3. Market share analysis by country
- 4.5. Nickel-cadmium batteries
- 4.5.1. Key market trends, growth factors and opportunities
- 4.5.2. Market size and forecast, by region
- 4.5.3. Market share analysis by country
- 4.6. Others
- 4.6.1. Key market trends, growth factors and opportunities
- 4.6.2. Market size and forecast, by region
- 4.6.3. Market share analysis by country
CHAPTER 5: SUBMARINE BATTERY MARKET, BY APPLICATION
- 5.1. Overview
- 5.1.1. Market size and forecast
- 5.2. Civil
- 5.2.1. Key market trends, growth factors and opportunities
- 5.2.2. Market size and forecast, by region
- 5.2.3. Market share analysis by country
- 5.3. Military
- 5.3.1. Key market trends, growth factors and opportunities
- 5.3.2. Market size and forecast, by region
- 5.3.3. Market share analysis by country
CHAPTER 6: SUBMARINE BATTERY MARKET, BY REGION
- 6.1. Overview
- 6.1.1. Market size and forecast By Region
- 6.2. North America
- 6.2.1. Key market trends, growth factors and opportunities
- 6.2.2. Market size and forecast, by Type
- 6.2.3. Market size and forecast, by Application
- 6.2.4. Market size and forecast, by country
- 6.2.4.1. U.S.
- 6.2.4.1.1. Market size and forecast, by Type
- 6.2.4.1.2. Market size and forecast, by Application
- 6.2.4.2. Canada
- 6.2.4.2.1. Market size and forecast, by Type
- 6.2.4.2.2. Market size and forecast, by Application
- 6.2.4.3. Mexico
- 6.2.4.3.1. Market size and forecast, by Type
- 6.2.4.3.2. Market size and forecast, by Application
- 6.3. Europe
- 6.3.1. Key market trends, growth factors and opportunities
- 6.3.2. Market size and forecast, by Type
- 6.3.3. Market size and forecast, by Application
- 6.3.4. Market size and forecast, by country
- 6.3.4.1. Germany
- 6.3.4.1.1. Market size and forecast, by Type
- 6.3.4.1.2. Market size and forecast, by Application
- 6.3.4.2. UK
- 6.3.4.2.1. Market size and forecast, by Type
- 6.3.4.2.2. Market size and forecast, by Application
- 6.3.4.3. France
- 6.3.4.3.1. Market size and forecast, by Type
- 6.3.4.3.2. Market size and forecast, by Application
- 6.3.4.4. Italy
- 6.3.4.4.1. Market size and forecast, by Type
- 6.3.4.4.2. Market size and forecast, by Application
- 6.3.4.5. Spain
- 6.3.4.5.1. Market size and forecast, by Type
- 6.3.4.5.2. Market size and forecast, by Application
- 6.3.4.6. Rest of Europe
- 6.3.4.6.1. Market size and forecast, by Type
- 6.3.4.6.2. Market size and forecast, by Application
- 6.4. Asia-Pacific
- 6.4.1. Key market trends, growth factors and opportunities
- 6.4.2. Market size and forecast, by Type
- 6.4.3. Market size and forecast, by Application
- 6.4.4. Market size and forecast, by country
- 6.4.4.1. China
- 6.4.4.1.1. Market size and forecast, by Type
- 6.4.4.1.2. Market size and forecast, by Application
- 6.4.4.2. Japan
- 6.4.4.2.1. Market size and forecast, by Type
- 6.4.4.2.2. Market size and forecast, by Application
- 6.4.4.3. India
- 6.4.4.3.1. Market size and forecast, by Type
- 6.4.4.3.2. Market size and forecast, by Application
- 6.4.4.4. South Korea
- 6.4.4.4.1. Market size and forecast, by Type
- 6.4.4.4.2. Market size and forecast, by Application
- 6.4.4.5. Australia
- 6.4.4.5.1. Market size and forecast, by Type
- 6.4.4.5.2. Market size and forecast, by Application
- 6.4.4.6. Rest of Asia-Pacific
- 6.4.4.6.1. Market size and forecast, by Type
- 6.4.4.6.2. Market size and forecast, by Application
- 6.5. LAMEA
- 6.5.1. Key market trends, growth factors and opportunities
- 6.5.2. Market size and forecast, by Type
- 6.5.3. Market size and forecast, by Application
- 6.5.4. Market size and forecast, by country
- 6.5.4.1. Brazil
- 6.5.4.1.1. Market size and forecast, by Type
- 6.5.4.1.2. Market size and forecast, by Application
- 6.5.4.2. Saudi Arabia
- 6.5.4.2.1. Market size and forecast, by Type
- 6.5.4.2.2. Market size and forecast, by Application
- 6.5.4.3. South Africa
- 6.5.4.3.1. Market size and forecast, by Type
- 6.5.4.3.2. Market size and forecast, by Application
- 6.5.4.4. Rest of Asia-Pacific
- 6.5.4.4.1. Market size and forecast, by Type
- 6.5.4.4.2. Market size and forecast, by Application
CHAPTER 7: COMPETITIVE LANDSCAPE
- 7.1. Introduction
- 7.2. Top winning strategies
- 7.3. Product mapping of top 10 player
- 7.4. Competitive dashboard
- 7.5. Competitive heatmap
- 7.6. Top player positioning, 2023
CHAPTER 8: COMPANY PROFILES
- 8.1. EnerSys
- 8.1.1. Company overview
- 8.1.2. Key executives
- 8.1.3. Company snapshot
- 8.1.4. Operating business segments
- 8.1.5. Product portfolio
- 8.1.6. Business performance
- 8.1.7. Key strategic moves and developments
- 8.2. Ever Exceed Corporation
- 8.2.1. Company overview
- 8.2.2. Key executives
- 8.2.3. Company snapshot
- 8.2.4. Operating business segments
- 8.2.5. Product portfolio
- 8.2.6. Business performance
- 8.2.7. Key strategic moves and developments
- 8.3. EXIDE INDUSTRIES LTD.
- 8.3.1. Company overview
- 8.3.2. Key executives
- 8.3.3. Company snapshot
- 8.3.4. Operating business segments
- 8.3.5. Product portfolio
- 8.3.6. Business performance
- 8.3.7. Key strategic moves and developments
- 8.4. GS Yuasa Corporation
- 8.4.1. Company overview
- 8.4.2. Key executives
- 8.4.3. Company snapshot
- 8.4.4. Operating business segments
- 8.4.5. Product portfolio
- 8.4.6. Business performance
- 8.4.7. Key strategic moves and developments
- 8.5. HBL POWER SYSTEMS LIMITED
- 8.5.1. Company overview
- 8.5.2. Key executives
- 8.5.3. Company snapshot
- 8.5.4. Operating business segments
- 8.5.5. Product portfolio
- 8.5.6. Business performance
- 8.5.7. Key strategic moves and developments
- 8.6. Korea Special Battery Co., Ltd.
- 8.6.1. Company overview
- 8.6.2. Key executives
- 8.6.3. Company snapshot
- 8.6.4. Operating business segments
- 8.6.5. Product portfolio
- 8.6.6. Business performance
- 8.6.7. Key strategic moves and developments
- 8.7. Kokam Battery
- 8.7.1. Company overview
- 8.7.2. Key executives
- 8.7.3. Company snapshot
- 8.7.4. Operating business segments
- 8.7.5. Product portfolio
- 8.7.6. Business performance
- 8.7.7. Key strategic moves and developments
- 8.8. Epsilor-Electric Fuel Ltd.
- 8.8.1. Company overview
- 8.8.2. Key executives
- 8.8.3. Company snapshot
- 8.8.4. Operating business segments
- 8.8.5. Product portfolio
- 8.8.6. Business performance
- 8.8.7. Key strategic moves and developments
- 8.9. ZIBO TORCH ENERGY CO., LTD.
- 8.9.1. Company overview
- 8.9.2. Key executives
- 8.9.3. Company snapshot
- 8.9.4. Operating business segments
- 8.9.5. Product portfolio
- 8.9.6. Business performance
- 8.9.7. Key strategic moves and developments
- 8.10. TOSHIBA CORPORATION
- 8.10.1. Company overview
- 8.10.2. Key executives
- 8.10.3. Company snapshot
- 8.10.4. Operating business segments
- 8.10.5. Product portfolio
- 8.10.6. Business performance
- 8.10.7. Key strategic moves and developments
LIST OF TABLES
- TABLE 01. GLOBAL SUBMARINE BATTERY MARKET, BY TYPE, 2023-2033 ($MILLION)
- TABLE 02. SUBMARINE BATTERY MARKET FOR LEAD-ACID BATTERIES, BY REGION, 2023-2033 ($MILLION)
- TABLE 03. SUBMARINE BATTERY MARKET FOR LITHIUM-ION BATTERIES, BY REGION, 2023-2033 ($MILLION)
- TABLE 04. SUBMARINE BATTERY MARKET FOR SILVER-ZINC BATTERIES, BY REGION, 2023-2033 ($MILLION)
- TABLE 05. SUBMARINE BATTERY MARKET FOR NICKEL-CADMIUM BATTERIES, BY REGION, 2023-2033 ($MILLION)
- TABLE 06. SUBMARINE BATTERY MARKET FOR OTHERS, BY REGION, 2023-2033 ($MILLION)
- TABLE 07. GLOBAL SUBMARINE BATTERY MARKET, BY APPLICATION, 2023-2033 ($MILLION)
- TABLE 08. SUBMARINE BATTERY MARKET FOR CIVIL, BY REGION, 2023-2033 ($MILLION)
- TABLE 09. SUBMARINE BATTERY MARKET FOR MILITARY, BY REGION, 2023-2033 ($MILLION)
- TABLE 10. SUBMARINE BATTERY MARKET, BY REGION, 2023-2033 ($MILLION)
- TABLE 11. NORTH AMERICA SUBMARINE BATTERY MARKET, BY TYPE, 2023-2033 ($MILLION)
- TABLE 12. NORTH AMERICA SUBMARINE BATTERY MARKET, BY APPLICATION, 2023-2033 ($MILLION)
- TABLE 13. NORTH AMERICA SUBMARINE BATTERY MARKET, BY COUNTRY, 2023-2033 ($MILLION)
- TABLE 14. U.S. SUBMARINE BATTERY MARKET, BY TYPE, 2023-2033 ($MILLION)
- TABLE 15. U.S. SUBMARINE BATTERY MARKET, BY APPLICATION, 2023-2033 ($MILLION)
- TABLE 16. CANADA SUBMARINE BATTERY MARKET, BY TYPE, 2023-2033 ($MILLION)
- TABLE 17. CANADA SUBMARINE BATTERY MARKET, BY APPLICATION, 2023-2033 ($MILLION)
- TABLE 18. MEXICO SUBMARINE BATTERY MARKET, BY TYPE, 2023-2033 ($MILLION)
- TABLE 19. MEXICO SUBMARINE BATTERY MARKET, BY APPLICATION, 2023-2033 ($MILLION)
- TABLE 20. EUROPE SUBMARINE BATTERY MARKET, BY TYPE, 2023-2033 ($MILLION)
- TABLE 21. EUROPE SUBMARINE BATTERY MARKET, BY APPLICATION, 2023-2033 ($MILLION)
- TABLE 22. EUROPE SUBMARINE BATTERY MARKET, BY COUNTRY, 2023-2033 ($MILLION)
- TABLE 23. GERMANY SUBMARINE BATTERY MARKET, BY TYPE, 2023-2033 ($MILLION)
- TABLE 24. GERMANY SUBMARINE BATTERY MARKET, BY APPLICATION, 2023-2033 ($MILLION)
- TABLE 25. UK SUBMARINE BATTERY MARKET, BY TYPE, 2023-2033 ($MILLION)
- TABLE 26. UK SUBMARINE BATTERY MARKET, BY APPLICATION, 2023-2033 ($MILLION)
- TABLE 27. FRANCE SUBMARINE BATTERY MARKET, BY TYPE, 2023-2033 ($MILLION)
- TABLE 28. FRANCE SUBMARINE BATTERY MARKET, BY APPLICATION, 2023-2033 ($MILLION)
- TABLE 29. ITALY SUBMARINE BATTERY MARKET, BY TYPE, 2023-2033 ($MILLION)
- TABLE 30. ITALY SUBMARINE BATTERY MARKET, BY APPLICATION, 2023-2033 ($MILLION)
- TABLE 31. SPAIN SUBMARINE BATTERY MARKET, BY TYPE, 2023-2033 ($MILLION)
- TABLE 32. SPAIN SUBMARINE BATTERY MARKET, BY APPLICATION, 2023-2033 ($MILLION)
- TABLE 33. REST OF EUROPE SUBMARINE BATTERY MARKET, BY TYPE, 2023-2033 ($MILLION)
- TABLE 34. REST OF EUROPE SUBMARINE BATTERY MARKET, BY APPLICATION, 2023-2033 ($MILLION)
- TABLE 35. ASIA-PACIFIC SUBMARINE BATTERY MARKET, BY TYPE, 2023-2033 ($MILLION)
- TABLE 36. ASIA-PACIFIC SUBMARINE BATTERY MARKET, BY APPLICATION, 2023-2033 ($MILLION)
- TABLE 37. ASIA-PACIFIC SUBMARINE BATTERY MARKET, BY COUNTRY, 2023-2033 ($MILLION)
- TABLE 38. CHINA SUBMARINE BATTERY MARKET, BY TYPE, 2023-2033 ($MILLION)
- TABLE 39. CHINA SUBMARINE BATTERY MARKET, BY APPLICATION, 2023-2033 ($MILLION)
- TABLE 40. JAPAN SUBMARINE BATTERY MARKET, BY TYPE, 2023-2033 ($MILLION)
- TABLE 41. JAPAN SUBMARINE BATTERY MARKET, BY APPLICATION, 2023-2033 ($MILLION)
- TABLE 42. INDIA SUBMARINE BATTERY MARKET, BY TYPE, 2023-2033 ($MILLION)
- TABLE 43. INDIA SUBMARINE BATTERY MARKET, BY APPLICATION, 2023-2033 ($MILLION)
- TABLE 44. SOUTH KOREA SUBMARINE BATTERY MARKET, BY TYPE, 2023-2033 ($MILLION)
- TABLE 45. SOUTH KOREA SUBMARINE BATTERY MARKET, BY APPLICATION, 2023-2033 ($MILLION)
- TABLE 46. AUSTRALIA SUBMARINE BATTERY MARKET, BY TYPE, 2023-2033 ($MILLION)
- TABLE 47. AUSTRALIA SUBMARINE BATTERY MARKET, BY APPLICATION, 2023-2033 ($MILLION)
- TABLE 48. REST OF ASIA-PACIFIC SUBMARINE BATTERY MARKET, BY TYPE, 2023-2033 ($MILLION)
- TABLE 49. REST OF ASIA-PACIFIC SUBMARINE BATTERY MARKET, BY APPLICATION, 2023-2033 ($MILLION)
- TABLE 50. LAMEA SUBMARINE BATTERY MARKET, BY TYPE, 2023-2033 ($MILLION)
- TABLE 51. LAMEA SUBMARINE BATTERY MARKET, BY APPLICATION, 2023-2033 ($MILLION)
- TABLE 52. LAMEA SUBMARINE BATTERY MARKET, BY COUNTRY, 2023-2033 ($MILLION)
- TABLE 53. BRAZIL SUBMARINE BATTERY MARKET, BY TYPE, 2023-2033 ($MILLION)
- TABLE 54. BRAZIL SUBMARINE BATTERY MARKET, BY APPLICATION, 2023-2033 ($MILLION)
- TABLE 55. SAUDI ARABIA SUBMARINE BATTERY MARKET, BY TYPE, 2023-2033 ($MILLION)
- TABLE 56. SAUDI ARABIA SUBMARINE BATTERY MARKET, BY APPLICATION, 2023-2033 ($MILLION)
- TABLE 57. SOUTH AFRICA SUBMARINE BATTERY MARKET, BY TYPE, 2023-2033 ($MILLION)
- TABLE 58. SOUTH AFRICA SUBMARINE BATTERY MARKET, BY APPLICATION, 2023-2033 ($MILLION)
- TABLE 59. REST OF ASIA-PACIFIC SUBMARINE BATTERY MARKET, BY TYPE, 2023-2033 ($MILLION)
- TABLE 60. REST OF ASIA-PACIFIC SUBMARINE BATTERY MARKET, BY APPLICATION, 2023-2033 ($MILLION)
- TABLE 61. ENERSYS: KEY EXECUTIVES
- TABLE 62. ENERSYS: COMPANY SNAPSHOT
- TABLE 63. ENERSYS: PRODUCT SEGMENTS
- TABLE 64. ENERSYS: SERVICE SEGMENTS
- TABLE 65. ENERSYS: PRODUCT PORTFOLIO
- TABLE 66. ENERSYS: KEY STRATERGIES
- TABLE 67. EVER EXCEED CORPORATION: KEY EXECUTIVES
- TABLE 68. EVER EXCEED CORPORATION: COMPANY SNAPSHOT
- TABLE 69. EVER EXCEED CORPORATION: PRODUCT SEGMENTS
- TABLE 70. EVER EXCEED CORPORATION: SERVICE SEGMENTS
- TABLE 71. EVER EXCEED CORPORATION: PRODUCT PORTFOLIO
- TABLE 72. EVER EXCEED CORPORATION: KEY STRATERGIES
- TABLE 73. EXIDE INDUSTRIES LTD.: KEY EXECUTIVES
- TABLE 74. EXIDE INDUSTRIES LTD.: COMPANY SNAPSHOT
- TABLE 75. EXIDE INDUSTRIES LTD.: PRODUCT SEGMENTS
- TABLE 76. EXIDE INDUSTRIES LTD.: SERVICE SEGMENTS
- TABLE 77. EXIDE INDUSTRIES LTD.: PRODUCT PORTFOLIO
- TABLE 78. EXIDE INDUSTRIES LTD.: KEY STRATERGIES
- TABLE 79. GS YUASA CORPORATION: KEY EXECUTIVES
- TABLE 80. GS YUASA CORPORATION: COMPANY SNAPSHOT
- TABLE 81. GS YUASA CORPORATION: PRODUCT SEGMENTS
- TABLE 82. GS YUASA CORPORATION: SERVICE SEGMENTS
- TABLE 83. GS YUASA CORPORATION: PRODUCT PORTFOLIO
- TABLE 84. GS YUASA CORPORATION: KEY STRATERGIES
- TABLE 85. HBL POWER SYSTEMS LIMITED: KEY EXECUTIVES
- TABLE 86. HBL POWER SYSTEMS LIMITED: COMPANY SNAPSHOT
- TABLE 87. HBL POWER SYSTEMS LIMITED: PRODUCT SEGMENTS
- TABLE 88. HBL POWER SYSTEMS LIMITED: SERVICE SEGMENTS
- TABLE 89. HBL POWER SYSTEMS LIMITED: PRODUCT PORTFOLIO
- TABLE 90. HBL POWER SYSTEMS LIMITED: KEY STRATERGIES
- TABLE 91. KOREA SPECIAL BATTERY CO., LTD.: KEY EXECUTIVES
- TABLE 92. KOREA SPECIAL BATTERY CO., LTD.: COMPANY SNAPSHOT
- TABLE 93. KOREA SPECIAL BATTERY CO., LTD.: PRODUCT SEGMENTS
- TABLE 94. KOREA SPECIAL BATTERY CO., LTD.: SERVICE SEGMENTS
- TABLE 95. KOREA SPECIAL BATTERY CO., LTD.: PRODUCT PORTFOLIO
- TABLE 96. KOREA SPECIAL BATTERY CO., LTD.: KEY STRATERGIES
- TABLE 97. KOKAM BATTERY: KEY EXECUTIVES
- TABLE 98. KOKAM BATTERY: COMPANY SNAPSHOT
- TABLE 99. KOKAM BATTERY: PRODUCT SEGMENTS
- TABLE 100. KOKAM BATTERY: SERVICE SEGMENTS
- TABLE 101. KOKAM BATTERY: PRODUCT PORTFOLIO
- TABLE 102. KOKAM BATTERY: KEY STRATERGIES
- TABLE 103. EPSILOR-ELECTRIC FUEL LTD.: KEY EXECUTIVES
- TABLE 104. EPSILOR-ELECTRIC FUEL LTD.: COMPANY SNAPSHOT
- TABLE 105. EPSILOR-ELECTRIC FUEL LTD.: PRODUCT SEGMENTS
- TABLE 106. EPSILOR-ELECTRIC FUEL LTD.: SERVICE SEGMENTS
- TABLE 107. EPSILOR-ELECTRIC FUEL LTD.: PRODUCT PORTFOLIO
- TABLE 108. EPSILOR-ELECTRIC FUEL LTD.: KEY STRATERGIES
- TABLE 109. ZIBO TORCH ENERGY CO., LTD.: KEY EXECUTIVES
- TABLE 110. ZIBO TORCH ENERGY CO., LTD.: COMPANY SNAPSHOT
- TABLE 111. ZIBO TORCH ENERGY CO., LTD.: PRODUCT SEGMENTS
- TABLE 112. ZIBO TORCH ENERGY CO., LTD.: SERVICE SEGMENTS
- TABLE 113. ZIBO TORCH ENERGY CO., LTD.: PRODUCT PORTFOLIO
- TABLE 114. ZIBO TORCH ENERGY CO., LTD.: KEY STRATERGIES
- TABLE 115. TOSHIBA CORPORATION: KEY EXECUTIVES
- TABLE 116. TOSHIBA CORPORATION: COMPANY SNAPSHOT
- TABLE 117. TOSHIBA CORPORATION: PRODUCT SEGMENTS
- TABLE 118. TOSHIBA CORPORATION: SERVICE SEGMENTS
- TABLE 119. TOSHIBA CORPORATION: PRODUCT PORTFOLIO
- TABLE 120. TOSHIBA CORPORATION: KEY STRATERGIES
LIST OF FIGURES
- FIGURE 01. SUBMARINE BATTERY MARKET, 2023-2033
- FIGURE 02. SEGMENTATION OF SUBMARINE BATTERY MARKET,2023-2033
- FIGURE 03. TOP IMPACTING FACTORS IN SUBMARINE BATTERY MARKET
- FIGURE 04. TOP INVESTMENT POCKETS IN SUBMARINE BATTERY MARKET (2024-2033)
- FIGURE 05. BARGAINING POWER OF SUPPLIERS
- FIGURE 06. BARGAINING POWER OF BUYERS
- FIGURE 07. THREAT OF SUBSTITUTION
- FIGURE 08. THREAT OF SUBSTITUTION
- FIGURE 09. COMPETITIVE RIVALRY
- FIGURE 10. GLOBAL SUBMARINE BATTERY MARKET:DRIVERS, RESTRAINTS AND OPPORTUNITIES
- FIGURE 11. SUBMARINE BATTERY MARKET, BY TYPE, 2023 AND 2033(%)
- FIGURE 12. COMPARATIVE SHARE ANALYSIS OF SUBMARINE BATTERY MARKET FOR LEAD-ACID BATTERIES, BY COUNTRY 2023 AND 2033(%)
- FIGURE 13. COMPARATIVE SHARE ANALYSIS OF SUBMARINE BATTERY MARKET FOR LITHIUM-ION BATTERIES, BY COUNTRY 2023 AND 2033(%)
- FIGURE 14. COMPARATIVE SHARE ANALYSIS OF SUBMARINE BATTERY MARKET FOR SILVER-ZINC BATTERIES, BY COUNTRY 2023 AND 2033(%)
- FIGURE 15. COMPARATIVE SHARE ANALYSIS OF SUBMARINE BATTERY MARKET FOR NICKEL-CADMIUM BATTERIES, BY COUNTRY 2023 AND 2033(%)
- FIGURE 16. COMPARATIVE SHARE ANALYSIS OF SUBMARINE BATTERY MARKET FOR OTHERS, BY COUNTRY 2023 AND 2033(%)
- FIGURE 17. SUBMARINE BATTERY MARKET, BY APPLICATION, 2023 AND 2033(%)
- FIGURE 18. COMPARATIVE SHARE ANALYSIS OF SUBMARINE BATTERY MARKET FOR CIVIL, BY COUNTRY 2023 AND 2033(%)
- FIGURE 19. COMPARATIVE SHARE ANALYSIS OF SUBMARINE BATTERY MARKET FOR MILITARY, BY COUNTRY 2023 AND 2033(%)
- FIGURE 20. SUBMARINE BATTERY MARKET BY REGION, 2023 AND 2033(%)
- FIGURE 21. U.S. SUBMARINE BATTERY MARKET, 2023-2033 ($MILLION)
- FIGURE 22. CANADA SUBMARINE BATTERY MARKET, 2023-2033 ($MILLION)
- FIGURE 23. MEXICO SUBMARINE BATTERY MARKET, 2023-2033 ($MILLION)
- FIGURE 24. GERMANY SUBMARINE BATTERY MARKET, 2023-2033 ($MILLION)
- FIGURE 25. UK SUBMARINE BATTERY MARKET, 2023-2033 ($MILLION)
- FIGURE 26. FRANCE SUBMARINE BATTERY MARKET, 2023-2033 ($MILLION)
- FIGURE 27. ITALY SUBMARINE BATTERY MARKET, 2023-2033 ($MILLION)
- FIGURE 28. SPAIN SUBMARINE BATTERY MARKET, 2023-2033 ($MILLION)
- FIGURE 29. REST OF EUROPE SUBMARINE BATTERY MARKET, 2023-2033 ($MILLION)
- FIGURE 30. CHINA SUBMARINE BATTERY MARKET, 2023-2033 ($MILLION)
- FIGURE 31. JAPAN SUBMARINE BATTERY MARKET, 2023-2033 ($MILLION)
- FIGURE 32. INDIA SUBMARINE BATTERY MARKET, 2023-2033 ($MILLION)
- FIGURE 33. SOUTH KOREA SUBMARINE BATTERY MARKET, 2023-2033 ($MILLION)
- FIGURE 34. AUSTRALIA SUBMARINE BATTERY MARKET, 2023-2033 ($MILLION)
- FIGURE 35. REST OF ASIA-PACIFIC SUBMARINE BATTERY MARKET, 2023-2033 ($MILLION)
- FIGURE 36. BRAZIL SUBMARINE BATTERY MARKET, 2023-2033 ($MILLION)
- FIGURE 37. SAUDI ARABIA SUBMARINE BATTERY MARKET, 2023-2033 ($MILLION)
- FIGURE 38. SOUTH AFRICA SUBMARINE BATTERY MARKET, 2023-2033 ($MILLION)
- FIGURE 39. REST OF ASIA-PACIFIC SUBMARINE BATTERY MARKET, 2023-2033 ($MILLION)
- FIGURE 40. TOP WINNING STRATEGIES, BY YEAR
- FIGURE 41. TOP WINNING STRATEGIES, BY DEVELOPMENT
- FIGURE 42. TOP WINNING STRATEGIES, BY COMPANY
- FIGURE 43. PRODUCT MAPPING OF TOP 10 PLAYERS
- FIGURE 44. COMPETITIVE DASHBOARD
- FIGURE 45. COMPETITIVE HEATMAP: SUBMARINE BATTERY MARKET
- FIGURE 46. TOP PLAYER POSITIONING, 2023


