


 |
市场调查报告书
商品编码
1472329
清洁能源市场:按类型、按应用划分:2023-2032 年全球机会分析与产业预测Clean Energy Market By Type (Wind Energy, Solar Energy, Geothermal Energy, Biomass, Others), By Application (Residential, Commercial, Industrial): Global Opportunity Analysis and Industry Forecast, 2023-2032 |
||||||
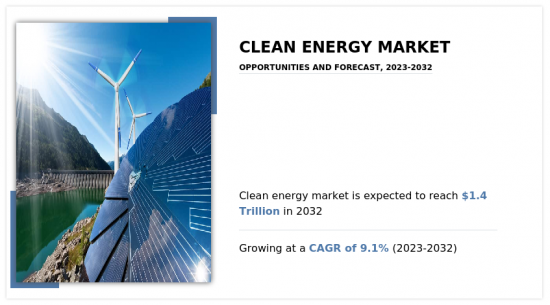
预计2022年全球清洁能源市场价值将达到6,000亿美元,2032年将达到1.4兆美元,2023年至2032年复合年增长率为9.1%。
介绍
清洁能源是一种永续的消费来源,不仅考虑到环境影响,还考虑到社会和经济方面。永续能源实践确保能源资源得到负责任的管理,以满足当代人的需求,同时又不损害子孙后代满足自身需求的能力。这包括能源效率、能源节约和公平获取能源等考虑因素。
市场动态
国家能源安全意识的增强正在推动清洁能源市场的成长。在地缘政治紧张局势和与石化燃料相关的供应链脆弱性的背景下,政府和企业正在转向太阳能、风能和水力发电等可再生能源发电。透过实现能源来源多样化和减少对进口燃料的依赖,各国正在增强能源安全并降低能源供应中断的风险。上述因素将成为加速采用清洁能源技术并刺激能源储存解决方案、智慧电网基础设施和分散式发电系统创新的驱动力,使能源系统更具抵御潜在风险的能力。
儘管清洁能源的发展势头不断增强,但来自石化燃料的竞争仍然是市场扩张的主要动力。根深蒂固的基础设施、成熟的供应链以及历史上较低的石化燃料价格对可再生能源技术的普及构成了挑战。此外,许多地区石化燃料产业的政治影响和对传统能源来源的补贴阻碍了清洁能源解决方案的竞争。为了克服这一阻碍因素,应共同努力,透过取消石化燃料补贴、引入碳定价机制和发展清洁能源技术,创造公平的竞争环境并实现与传统能源来源的成本平价。
可再生能源融资是推动清洁能源市场成长的关键机会。随着可再生能源技术的成本持续下降,投资者被清洁能源计划的财务可行性和长期永续性所吸引。绿色债券、计划融资结构和官民合作关係等创新资金筹措机制正在为大规模可再生能源部署筹集资金。此外,税额扣抵和可再生能源证书等政策奖励也鼓励对清洁能源基础设施的投资。这些资本的流入将促进创新,加速采用,为清洁能源解决方案释放新市场,并加速向低碳能源未来的过渡。
分部概览
清洁能源市场分为类型、应用和区域。依类型划分,市场分为太阳能、风力发电、地热能、生质能等。依用途分为住宅、商业用房和工业用房。按地区划分,对北美、欧洲、亚太地区和拉丁美洲地区市场进行了分析。
区域分析
亚太地区可再生能源大幅成长1.62%至13.75%,相对变动13%。相反,中东地区下降了0.95%,比2020年下降了22%。北美小幅成长13.44%,欧盟和非洲均略有成长。另一方面,南美洲的销售额下降了3%,至37.78%。这些波动凸显了全球向可再生能源转型的进展和挑战,而再生能源转型受到区域权力关係和政策倡议的影响。
相关人员的主要利益
- 该报告定量提供了2022年至2032年清洁能源市场分析的细分市场、当前趋势、预测和趋势分析,并识别了清洁能源市场的强大机会。
- 我们提供市场研究以及与市场驱动因素、市场限制和市场机会相关的资讯。
- 波特的五力分析强调买家和供应商帮助相关人员做出利润驱动的商业决策并加强供应商-买家网路的力量。
- 对清洁能源市场细分的详细分析有助于确定市场机会。
- 每个地区的主要国家都根据其对全球市场的收益贡献绘製了地图。
- 市场参与者定位有助于基准化分析,并提供对市场参与者当前位置的清晰了解。
- 该报告包括对区域和全球清洁能源市场趋势、主要企业、细分市场、应用领域和市场成长策略的分析。
可以使用此报告进行客製化(需要额外费用和时间表)
- 资本投资明细
- 投资机会
- 按地区分類的新参与企业
- 科技趋势分析
- 按产品/细分市场对参与者进行市场区隔分析
- 新产品开发/主要厂商产品矩阵
- 监管指引
- 策略建议
- 根据客户兴趣新增其他公司简介
- 按国家或地区进行的附加分析 – 市场规模和预测
- 公司简介的扩充列表
- 历史市场资料
- 导入/汇出分析/资料
- SWOT分析
- 成交量市场规模及预测
目录
第一章简介
第 2 章执行摘要
第三章市场概况
- 市场定义和范围
- 主要发现
- 影响因素
- 主要投资机会
- 波特五力分析
- 市场动态
- 促进因素
- 抑制因素
- 机会
- 价值链分析
- 关键监管分析
第四章清洁能源市场:依类型
- 概述
- 风力发电
- 太阳能
- 地热能
- 生物量
- 其他的
第五章清洁能源市场:依应用分类
- 概述
- 住宅
- 商业的
- 工业的
第六章 清洁能源市场:依地区
- 概述
- 北美洲
- 美国
- 加拿大
- 墨西哥
- 欧洲
- 德国
- 法国
- 义大利
- 西班牙
- 英国
- 其他的
- 亚太地区
- 中国
- 日本
- 印度
- 韩国
- 澳洲
- 其他的
- 拉丁美洲/中东/非洲
- 巴西
- 沙乌地阿拉伯
- 南非
- 其他的
第七章 竞争格局
- 介绍
- 关键成功策略
- 10家主要企业产品图谱
- 竞争对手仪表板
- 竞争热图
- 2022年主要企业定位
第八章 公司简介
- JinkoSolar Holding Co., Ltd.
- Suzlon Energy Ltd
- Yingli Green Energy Holding Company Limited
- Suntech Power Holdings Co., Ltd.
- JA Solar Holdings Co. Ltd.
- Goldwind Science and Technology Co., Ltd.
- Vestas Wind Systems A/S
- Alstom SA
- Constellation Energy Corporation
- NTPC LIMITED
The global clean energy market was valued at $0.6 trillion in 2022, and is projected to reach $1.4 trillion by 2032, growing at a CAGR of 9.1% from 2023 to 2032.
Introduction
Clean energy is a sustainable source that can be consumed, considering not only its environmental impact but also its social and economic dimensions. Sustainable energy practices ensure that energy resources are managed responsibly to meet present needs without compromising the ability of future generations to meet their own needs. This includes considerations such as energy efficiency, conservation, and equitable access to energy resources.
Market Dynamics
The growing awareness regarding national energy security is propelling the growth of the clean energy market. With geopolitical tensions and supply chain vulnerabilities associated with fossil fuels, governments, and corporations are turning to renewable energy sources such as solar, wind, and hydroelectric power generation. By diversifying energy sources and reducing reliance on imported fuels, countries enhance their energy security and mitigate the risks of disruptions to their energy supplies. The abovementioned factors act as driving forces in accelerating the deployment of clean energy technologies and spurring innovation in energy storage solutions, smart grid infrastructure, and distributed generation systems, thereby strengthening the resilience of energy systems against potential risks.
Despite the growing momentum behind clean energy, competition with fossil fuels remains a significant restraint on market expansion. The entrenched infrastructure, established supply chains, and historically low prices of fossil fuels present challenges to the widespread adoption of renewable energy technologies. Moreover, the political influence of fossil fuel industries and the subsidization of traditional energy sources in many regions hinder the competitiveness of clean energy solutions. Overcoming this restraint requires concerted efforts to level the playing field through the removal of fossil fuel subsidies, implementation of carbon pricing mechanisms, and advancements in clean energy technologies to achieve cost parity with conventional energy sources.
Renewable energy financing represents a key opportunity to drive the clean energy market growth. As the costs of renewable energy technologies continue to decline, investors are attracted to the financial viability and long-term sustainability of clean energy projects. Innovative financing mechanisms such as green bonds, project finance structures, and public-private partnerships are mobilizing capital for renewable energy deployment at a large scale. Furthermore, policy incentives such as feed-in tariffs, tax credits, and renewable energy certificates are encouraging investment in clean energy infrastructure. This influx of financing is driving innovation, accelerating deployment, and unlocking new markets for clean energy solutions, thereby catalyzing the transition towards a low-carbon energy future.
Segments overview
The clean energy market is segmented into type, application, and region. On the basis of type, the market is divided into solar energy, wind energy, geothermal energy, biomass, and others. On the basis of application, the market is segregated into residential, commercial, and industrial. On the basis of region, the market is analyzed across North America, Europe, Asia-Pacific, and LAMEA.
Region Analysis
In Asia Pacific renewable energy saw a substantial increase of 1.62% reaching 13.75%, reflecting a 13% relative change. Conversely, the Middle East experienced a decrease of 0.95%, down by 22% from 2020. North America observed a moderate increase to 13.44%, while the European Union and Africa each saw marginal gains. South America, however, witnessed a decline to 37.78%, down by 3%. These fluctuations highlight both progress and challenges in the global transition to renewable energy sources, influenced by regional dynamics and policy initiatives.
The major players operating in the clean energy market include JinkoSolar Holding Co., Ltd., Suzlon Energy Ltd., Yingli Green Energy Holding Company Ltd., Suntech Power Holdings Co., Ltd., JA Solar Holdings, Goldwind Science and Technology Co., Ltd., Vestas Wind Systems A/S, Alstom SA, Constellation Energy Corporation, and NTPC Limited.
Key Benefits For Stakeholders
- This report provides a quantitative analysis of the market segments, current trends, estimations, and dynamics of the clean energy market analysis from 2022 to 2032 to identify the prevailing clean energy market opportunities.
- The market research is offered along with information related to key drivers, restraints, and opportunities.
- Porter's five forces analysis highlights the potency of buyers and suppliers to enable stakeholders make profit-oriented business decisions and strengthen their supplier-buyer network.
- In-depth analysis of the clean energy market segmentation assists to determine the prevailing market opportunities.
- Major countries in each region are mapped according to their revenue contribution to the global market.
- Market player positioning facilitates benchmarking and provides a clear understanding of the present position of the market players.
- The report includes the analysis of the regional as well as global clean energy market trends, key players, market segments, application areas, and market growth strategies.
Additional benefits you will get with this purchase are:
- Quarterly Update and* (only available with a corporate license, on listed price)
- 5 additional Company Profile of client Choice pre- or Post-purchase, as a free update.
- Free Upcoming Version on the Purchase of Five and Enterprise User License.
- 16 analyst hours of support* (post-purchase, if you find additional data requirements upon review of the report, you may receive support amounting to 16 analyst hours to solve questions, and post-sale queries)
- 15% Free Customization* (in case the scope or segment of the report does not match your requirements, 15% is equivalent to 3 working days of free work, applicable once)
- Free data Pack on the Five and Enterprise User License. (Excel version of the report)
- Free Updated report if the report is 6-12 months old or older.
- 24-hour priority response*
- Free Industry updates and white papers.
Possible Customization with this report (with additional cost and timeline, please talk to the sales executive to know more)
- Capital Investment breakdown
- Investment Opportunities
- Upcoming/New Entrant by Regions
- Technology Trend Analysis
- Market share analysis of players by products/segments
- New Product Development/ Product Matrix of Key Players
- Regulatory Guidelines
- Strategic Recommendations
- Additional company profiles with specific to client's interest
- Additional country or region analysis- market size and forecast
- Expanded list for Company Profiles
- Historic market data
- Import Export Analysis/Data
- SWOT Analysis
- Volume Market Size and Forecast
Key Market Segments
By Type
- Wind Energy
- Solar Energy
- Geothermal Energy
- Biomass
- Others
By Application
- Residential
- Commercial
- Industrial
By Region
- North America
- U.S.
- Canada
- Mexico
- Europe
- Germany
- France
- Italy
- Spain
- UK
- Rest of Europe
- Asia-Pacific
- China
- Japan
- India
- South Korea
- Australia
- Rest of Asia-Pacific
- LAMEA
- Brazil
- Saudi Arabia
- South Africa
- Rest of LAMEA
Key Market Players:
- JinkoSolar Holding Co., Ltd.
- Suzlon Energy Ltd
- Yingli Green Energy Holding Company Limited
- Suntech Power Holdings Co., Ltd.
- JA Solar Holdings Co. Ltd.
- Goldwind Science and Technology Co., Ltd.
- Vestas Wind Systems A/S
- Alstom SA
- Constellation Energy Corporation
- NTPC LIMITED
TABLE OF CONTENTS
CHAPTER 1: INTRODUCTION
- 1.1. Report description
- 1.2. Key market segments
- 1.3. Key benefits to the stakeholders
- 1.4. Research methodology
- 1.4.1. Primary research
- 1.4.2. Secondary research
- 1.4.3. Analyst tools and models
CHAPTER 2: EXECUTIVE SUMMARY
- 2.1. CXO perspective
CHAPTER 3: MARKET OVERVIEW
- 3.1. Market definition and scope
- 3.2. Key findings
- 3.2.1. Top impacting factors
- 3.2.2. Top investment pockets
- 3.3. Porter's five forces analysis
- 3.4. Market dynamics
- 3.4.1. Drivers
- 3.4.2. Restraints
- 3.4.3. Opportunities
- 3.5. Value Chain Analysis
- 3.6. Key Regulation Analysis
CHAPTER 4: CLEAN ENERGY MARKET, BY TYPE
- 4.1. Overview
- 4.1.1. Market size and forecast
- 4.2. Wind Energy
- 4.2.1. Key market trends, growth factors and opportunities
- 4.2.2. Market size and forecast, by region
- 4.2.3. Market share analysis by country
- 4.3. Solar Energy
- 4.3.1. Key market trends, growth factors and opportunities
- 4.3.2. Market size and forecast, by region
- 4.3.3. Market share analysis by country
- 4.4. Geothermal Energy
- 4.4.1. Key market trends, growth factors and opportunities
- 4.4.2. Market size and forecast, by region
- 4.4.3. Market share analysis by country
- 4.5. Biomass
- 4.5.1. Key market trends, growth factors and opportunities
- 4.5.2. Market size and forecast, by region
- 4.5.3. Market share analysis by country
- 4.6. Others
- 4.6.1. Key market trends, growth factors and opportunities
- 4.6.2. Market size and forecast, by region
- 4.6.3. Market share analysis by country
CHAPTER 5: CLEAN ENERGY MARKET, BY APPLICATION
- 5.1. Overview
- 5.1.1. Market size and forecast
- 5.2. Residential
- 5.2.1. Key market trends, growth factors and opportunities
- 5.2.2. Market size and forecast, by region
- 5.2.3. Market share analysis by country
- 5.3. Commercial
- 5.3.1. Key market trends, growth factors and opportunities
- 5.3.2. Market size and forecast, by region
- 5.3.3. Market share analysis by country
- 5.4. Industrial
- 5.4.1. Key market trends, growth factors and opportunities
- 5.4.2. Market size and forecast, by region
- 5.4.3. Market share analysis by country
CHAPTER 6: CLEAN ENERGY MARKET, BY REGION
- 6.1. Overview
- 6.1.1. Market size and forecast By Region
- 6.2. North America
- 6.2.1. Key market trends, growth factors and opportunities
- 6.2.2. Market size and forecast, by Type
- 6.2.3. Market size and forecast, by Application
- 6.2.4. Market size and forecast, by country
- 6.2.4.1. U.S.
- 6.2.4.1.1. Market size and forecast, by Type
- 6.2.4.1.2. Market size and forecast, by Application
- 6.2.4.2. Canada
- 6.2.4.2.1. Market size and forecast, by Type
- 6.2.4.2.2. Market size and forecast, by Application
- 6.2.4.3. Mexico
- 6.2.4.3.1. Market size and forecast, by Type
- 6.2.4.3.2. Market size and forecast, by Application
- 6.3. Europe
- 6.3.1. Key market trends, growth factors and opportunities
- 6.3.2. Market size and forecast, by Type
- 6.3.3. Market size and forecast, by Application
- 6.3.4. Market size and forecast, by country
- 6.3.4.1. Germany
- 6.3.4.1.1. Market size and forecast, by Type
- 6.3.4.1.2. Market size and forecast, by Application
- 6.3.4.2. France
- 6.3.4.2.1. Market size and forecast, by Type
- 6.3.4.2.2. Market size and forecast, by Application
- 6.3.4.3. Italy
- 6.3.4.3.1. Market size and forecast, by Type
- 6.3.4.3.2. Market size and forecast, by Application
- 6.3.4.4. Spain
- 6.3.4.4.1. Market size and forecast, by Type
- 6.3.4.4.2. Market size and forecast, by Application
- 6.3.4.5. UK
- 6.3.4.5.1. Market size and forecast, by Type
- 6.3.4.5.2. Market size and forecast, by Application
- 6.3.4.6. Rest of Europe
- 6.3.4.6.1. Market size and forecast, by Type
- 6.3.4.6.2. Market size and forecast, by Application
- 6.4. Asia-Pacific
- 6.4.1. Key market trends, growth factors and opportunities
- 6.4.2. Market size and forecast, by Type
- 6.4.3. Market size and forecast, by Application
- 6.4.4. Market size and forecast, by country
- 6.4.4.1. China
- 6.4.4.1.1. Market size and forecast, by Type
- 6.4.4.1.2. Market size and forecast, by Application
- 6.4.4.2. Japan
- 6.4.4.2.1. Market size and forecast, by Type
- 6.4.4.2.2. Market size and forecast, by Application
- 6.4.4.3. India
- 6.4.4.3.1. Market size and forecast, by Type
- 6.4.4.3.2. Market size and forecast, by Application
- 6.4.4.4. South Korea
- 6.4.4.4.1. Market size and forecast, by Type
- 6.4.4.4.2. Market size and forecast, by Application
- 6.4.4.5. Australia
- 6.4.4.5.1. Market size and forecast, by Type
- 6.4.4.5.2. Market size and forecast, by Application
- 6.4.4.6. Rest of Asia-Pacific
- 6.4.4.6.1. Market size and forecast, by Type
- 6.4.4.6.2. Market size and forecast, by Application
- 6.5. LAMEA
- 6.5.1. Key market trends, growth factors and opportunities
- 6.5.2. Market size and forecast, by Type
- 6.5.3. Market size and forecast, by Application
- 6.5.4. Market size and forecast, by country
- 6.5.4.1. Brazil
- 6.5.4.1.1. Market size and forecast, by Type
- 6.5.4.1.2. Market size and forecast, by Application
- 6.5.4.2. Saudi Arabia
- 6.5.4.2.1. Market size and forecast, by Type
- 6.5.4.2.2. Market size and forecast, by Application
- 6.5.4.3. South Africa
- 6.5.4.3.1. Market size and forecast, by Type
- 6.5.4.3.2. Market size and forecast, by Application
- 6.5.4.4. Rest of LAMEA
- 6.5.4.4.1. Market size and forecast, by Type
- 6.5.4.4.2. Market size and forecast, by Application
CHAPTER 7: COMPETITIVE LANDSCAPE
- 7.1. Introduction
- 7.2. Top winning strategies
- 7.3. Product mapping of top 10 player
- 7.4. Competitive dashboard
- 7.5. Competitive heatmap
- 7.6. Top player positioning, 2022
CHAPTER 8: COMPANY PROFILES
- 8.1. JinkoSolar Holding Co., Ltd.
- 8.1.1. Company overview
- 8.1.2. Key executives
- 8.1.3. Company snapshot
- 8.1.4. Operating business segments
- 8.1.5. Product portfolio
- 8.1.6. Business performance
- 8.1.7. Key strategic moves and developments
- 8.2. Suzlon Energy Ltd
- 8.2.1. Company overview
- 8.2.2. Key executives
- 8.2.3. Company snapshot
- 8.2.4. Operating business segments
- 8.2.5. Product portfolio
- 8.2.6. Business performance
- 8.2.7. Key strategic moves and developments
- 8.3. Yingli Green Energy Holding Company Limited
- 8.3.1. Company overview
- 8.3.2. Key executives
- 8.3.3. Company snapshot
- 8.3.4. Operating business segments
- 8.3.5. Product portfolio
- 8.3.6. Business performance
- 8.3.7. Key strategic moves and developments
- 8.4. Suntech Power Holdings Co., Ltd.
- 8.4.1. Company overview
- 8.4.2. Key executives
- 8.4.3. Company snapshot
- 8.4.4. Operating business segments
- 8.4.5. Product portfolio
- 8.4.6. Business performance
- 8.4.7. Key strategic moves and developments
- 8.5. JA Solar Holdings Co. Ltd.
- 8.5.1. Company overview
- 8.5.2. Key executives
- 8.5.3. Company snapshot
- 8.5.4. Operating business segments
- 8.5.5. Product portfolio
- 8.5.6. Business performance
- 8.5.7. Key strategic moves and developments
- 8.6. Goldwind Science and Technology Co., Ltd.
- 8.6.1. Company overview
- 8.6.2. Key executives
- 8.6.3. Company snapshot
- 8.6.4. Operating business segments
- 8.6.5. Product portfolio
- 8.6.6. Business performance
- 8.6.7. Key strategic moves and developments
- 8.7. Vestas Wind Systems A/S
- 8.7.1. Company overview
- 8.7.2. Key executives
- 8.7.3. Company snapshot
- 8.7.4. Operating business segments
- 8.7.5. Product portfolio
- 8.7.6. Business performance
- 8.7.7. Key strategic moves and developments
- 8.8. Alstom SA
- 8.8.1. Company overview
- 8.8.2. Key executives
- 8.8.3. Company snapshot
- 8.8.4. Operating business segments
- 8.8.5. Product portfolio
- 8.8.6. Business performance
- 8.8.7. Key strategic moves and developments
- 8.9. Constellation Energy Corporation
- 8.9.1. Company overview
- 8.9.2. Key executives
- 8.9.3. Company snapshot
- 8.9.4. Operating business segments
- 8.9.5. Product portfolio
- 8.9.6. Business performance
- 8.9.7. Key strategic moves and developments
- 8.10. NTPC LIMITED
- 8.10.1. Company overview
- 8.10.2. Key executives
- 8.10.3. Company snapshot
- 8.10.4. Operating business segments
- 8.10.5. Product portfolio
- 8.10.6. Business performance
- 8.10.7. Key strategic moves and developments
LIST OF TABLES
- TABLE 01. GLOBAL CLEAN ENERGY MARKET, BY TYPE, 2022-2032 ($BILLION)
- TABLE 02. CLEAN ENERGY MARKET FOR WIND ENERGY, BY REGION, 2022-2032 ($BILLION)
- TABLE 03. CLEAN ENERGY MARKET FOR SOLAR ENERGY, BY REGION, 2022-2032 ($BILLION)
- TABLE 04. CLEAN ENERGY MARKET FOR GEOTHERMAL ENERGY, BY REGION, 2022-2032 ($BILLION)
- TABLE 05. CLEAN ENERGY MARKET FOR BIOMASS, BY REGION, 2022-2032 ($BILLION)
- TABLE 06. CLEAN ENERGY MARKET FOR OTHERS, BY REGION, 2022-2032 ($BILLION)
- TABLE 07. GLOBAL CLEAN ENERGY MARKET, BY APPLICATION, 2022-2032 ($BILLION)
- TABLE 08. CLEAN ENERGY MARKET FOR RESIDENTIAL, BY REGION, 2022-2032 ($BILLION)
- TABLE 09. CLEAN ENERGY MARKET FOR COMMERCIAL, BY REGION, 2022-2032 ($BILLION)
- TABLE 10. CLEAN ENERGY MARKET FOR INDUSTRIAL, BY REGION, 2022-2032 ($BILLION)
- TABLE 11. CLEAN ENERGY MARKET, BY REGION, 2022-2032 ($BILLION)
- TABLE 12. NORTH AMERICA CLEAN ENERGY MARKET, BY TYPE, 2022-2032 ($BILLION)
- TABLE 13. NORTH AMERICA CLEAN ENERGY MARKET, BY APPLICATION, 2022-2032 ($BILLION)
- TABLE 14. NORTH AMERICA CLEAN ENERGY MARKET, BY COUNTRY, 2022-2032 ($BILLION)
- TABLE 15. U.S. CLEAN ENERGY MARKET, BY TYPE, 2022-2032 ($BILLION)
- TABLE 16. U.S. CLEAN ENERGY MARKET, BY APPLICATION, 2022-2032 ($BILLION)
- TABLE 17. CANADA CLEAN ENERGY MARKET, BY TYPE, 2022-2032 ($BILLION)
- TABLE 18. CANADA CLEAN ENERGY MARKET, BY APPLICATION, 2022-2032 ($BILLION)
- TABLE 19. MEXICO CLEAN ENERGY MARKET, BY TYPE, 2022-2032 ($BILLION)
- TABLE 20. MEXICO CLEAN ENERGY MARKET, BY APPLICATION, 2022-2032 ($BILLION)
- TABLE 21. EUROPE CLEAN ENERGY MARKET, BY TYPE, 2022-2032 ($BILLION)
- TABLE 22. EUROPE CLEAN ENERGY MARKET, BY APPLICATION, 2022-2032 ($BILLION)
- TABLE 23. EUROPE CLEAN ENERGY MARKET, BY COUNTRY, 2022-2032 ($BILLION)
- TABLE 24. GERMANY CLEAN ENERGY MARKET, BY TYPE, 2022-2032 ($BILLION)
- TABLE 25. GERMANY CLEAN ENERGY MARKET, BY APPLICATION, 2022-2032 ($BILLION)
- TABLE 26. FRANCE CLEAN ENERGY MARKET, BY TYPE, 2022-2032 ($BILLION)
- TABLE 27. FRANCE CLEAN ENERGY MARKET, BY APPLICATION, 2022-2032 ($BILLION)
- TABLE 28. ITALY CLEAN ENERGY MARKET, BY TYPE, 2022-2032 ($BILLION)
- TABLE 29. ITALY CLEAN ENERGY MARKET, BY APPLICATION, 2022-2032 ($BILLION)
- TABLE 30. SPAIN CLEAN ENERGY MARKET, BY TYPE, 2022-2032 ($BILLION)
- TABLE 31. SPAIN CLEAN ENERGY MARKET, BY APPLICATION, 2022-2032 ($BILLION)
- TABLE 32. UK CLEAN ENERGY MARKET, BY TYPE, 2022-2032 ($BILLION)
- TABLE 33. UK CLEAN ENERGY MARKET, BY APPLICATION, 2022-2032 ($BILLION)
- TABLE 34. REST OF EUROPE CLEAN ENERGY MARKET, BY TYPE, 2022-2032 ($BILLION)
- TABLE 35. REST OF EUROPE CLEAN ENERGY MARKET, BY APPLICATION, 2022-2032 ($BILLION)
- TABLE 36. ASIA-PACIFIC CLEAN ENERGY MARKET, BY TYPE, 2022-2032 ($BILLION)
- TABLE 37. ASIA-PACIFIC CLEAN ENERGY MARKET, BY APPLICATION, 2022-2032 ($BILLION)
- TABLE 38. ASIA-PACIFIC CLEAN ENERGY MARKET, BY COUNTRY, 2022-2032 ($BILLION)
- TABLE 39. CHINA CLEAN ENERGY MARKET, BY TYPE, 2022-2032 ($BILLION)
- TABLE 40. CHINA CLEAN ENERGY MARKET, BY APPLICATION, 2022-2032 ($BILLION)
- TABLE 41. JAPAN CLEAN ENERGY MARKET, BY TYPE, 2022-2032 ($BILLION)
- TABLE 42. JAPAN CLEAN ENERGY MARKET, BY APPLICATION, 2022-2032 ($BILLION)
- TABLE 43. INDIA CLEAN ENERGY MARKET, BY TYPE, 2022-2032 ($BILLION)
- TABLE 44. INDIA CLEAN ENERGY MARKET, BY APPLICATION, 2022-2032 ($BILLION)
- TABLE 45. SOUTH KOREA CLEAN ENERGY MARKET, BY TYPE, 2022-2032 ($BILLION)
- TABLE 46. SOUTH KOREA CLEAN ENERGY MARKET, BY APPLICATION, 2022-2032 ($BILLION)
- TABLE 47. AUSTRALIA CLEAN ENERGY MARKET, BY TYPE, 2022-2032 ($BILLION)
- TABLE 48. AUSTRALIA CLEAN ENERGY MARKET, BY APPLICATION, 2022-2032 ($BILLION)
- TABLE 49. REST OF ASIA-PACIFIC CLEAN ENERGY MARKET, BY TYPE, 2022-2032 ($BILLION)
- TABLE 50. REST OF ASIA-PACIFIC CLEAN ENERGY MARKET, BY APPLICATION, 2022-2032 ($BILLION)
- TABLE 51. LAMEA CLEAN ENERGY MARKET, BY TYPE, 2022-2032 ($BILLION)
- TABLE 52. LAMEA CLEAN ENERGY MARKET, BY APPLICATION, 2022-2032 ($BILLION)
- TABLE 53. LAMEA CLEAN ENERGY MARKET, BY COUNTRY, 2022-2032 ($BILLION)
- TABLE 54. BRAZIL CLEAN ENERGY MARKET, BY TYPE, 2022-2032 ($BILLION)
- TABLE 55. BRAZIL CLEAN ENERGY MARKET, BY APPLICATION, 2022-2032 ($BILLION)
- TABLE 56. SAUDI ARABIA CLEAN ENERGY MARKET, BY TYPE, 2022-2032 ($BILLION)
- TABLE 57. SAUDI ARABIA CLEAN ENERGY MARKET, BY APPLICATION, 2022-2032 ($BILLION)
- TABLE 58. SOUTH AFRICA CLEAN ENERGY MARKET, BY TYPE, 2022-2032 ($BILLION)
- TABLE 59. SOUTH AFRICA CLEAN ENERGY MARKET, BY APPLICATION, 2022-2032 ($BILLION)
- TABLE 60. REST OF LAMEA CLEAN ENERGY MARKET, BY TYPE, 2022-2032 ($BILLION)
- TABLE 61. REST OF LAMEA CLEAN ENERGY MARKET, BY APPLICATION, 2022-2032 ($BILLION)
- TABLE 62. JINKOSOLAR HOLDING CO., LTD.: KEY EXECUTIVES
- TABLE 63. JINKOSOLAR HOLDING CO., LTD.: COMPANY SNAPSHOT
- TABLE 64. JINKOSOLAR HOLDING CO., LTD.: PRODUCT SEGMENTS
- TABLE 65. JINKOSOLAR HOLDING CO., LTD.: SERVICE SEGMENTS
- TABLE 66. JINKOSOLAR HOLDING CO., LTD.: PRODUCT PORTFOLIO
- TABLE 67. JINKOSOLAR HOLDING CO., LTD.: KEY STRATERGIES
- TABLE 68. SUZLON ENERGY LTD: KEY EXECUTIVES
- TABLE 69. SUZLON ENERGY LTD: COMPANY SNAPSHOT
- TABLE 70. SUZLON ENERGY LTD: PRODUCT SEGMENTS
- TABLE 71. SUZLON ENERGY LTD: SERVICE SEGMENTS
- TABLE 72. SUZLON ENERGY LTD: PRODUCT PORTFOLIO
- TABLE 73. SUZLON ENERGY LTD: KEY STRATERGIES
- TABLE 74. YINGLI GREEN ENERGY HOLDING COMPANY LIMITED: KEY EXECUTIVES
- TABLE 75. YINGLI GREEN ENERGY HOLDING COMPANY LIMITED: COMPANY SNAPSHOT
- TABLE 76. YINGLI GREEN ENERGY HOLDING COMPANY LIMITED: PRODUCT SEGMENTS
- TABLE 77. YINGLI GREEN ENERGY HOLDING COMPANY LIMITED: SERVICE SEGMENTS
- TABLE 78. YINGLI GREEN ENERGY HOLDING COMPANY LIMITED: PRODUCT PORTFOLIO
- TABLE 79. YINGLI GREEN ENERGY HOLDING COMPANY LIMITED: KEY STRATERGIES
- TABLE 80. SUNTECH POWER HOLDINGS CO., LTD.: KEY EXECUTIVES
- TABLE 81. SUNTECH POWER HOLDINGS CO., LTD.: COMPANY SNAPSHOT
- TABLE 82. SUNTECH POWER HOLDINGS CO., LTD.: PRODUCT SEGMENTS
- TABLE 83. SUNTECH POWER HOLDINGS CO., LTD.: SERVICE SEGMENTS
- TABLE 84. SUNTECH POWER HOLDINGS CO., LTD.: PRODUCT PORTFOLIO
- TABLE 85. SUNTECH POWER HOLDINGS CO., LTD.: KEY STRATERGIES
- TABLE 86. JA SOLAR HOLDINGS CO. LTD.: KEY EXECUTIVES
- TABLE 87. JA SOLAR HOLDINGS CO. LTD.: COMPANY SNAPSHOT
- TABLE 88. JA SOLAR HOLDINGS CO. LTD.: PRODUCT SEGMENTS
- TABLE 89. JA SOLAR HOLDINGS CO. LTD.: SERVICE SEGMENTS
- TABLE 90. JA SOLAR HOLDINGS CO. LTD.: PRODUCT PORTFOLIO
- TABLE 91. JA SOLAR HOLDINGS CO. LTD.: KEY STRATERGIES
- TABLE 92. GOLDWIND SCIENCE AND TECHNOLOGY CO., LTD.: KEY EXECUTIVES
- TABLE 93. GOLDWIND SCIENCE AND TECHNOLOGY CO., LTD.: COMPANY SNAPSHOT
- TABLE 94. GOLDWIND SCIENCE AND TECHNOLOGY CO., LTD.: PRODUCT SEGMENTS
- TABLE 95. GOLDWIND SCIENCE AND TECHNOLOGY CO., LTD.: SERVICE SEGMENTS
- TABLE 96. GOLDWIND SCIENCE AND TECHNOLOGY CO., LTD.: PRODUCT PORTFOLIO
- TABLE 97. GOLDWIND SCIENCE AND TECHNOLOGY CO., LTD.: KEY STRATERGIES
- TABLE 98. VESTAS WIND SYSTEMS A/S: KEY EXECUTIVES
- TABLE 99. VESTAS WIND SYSTEMS A/S: COMPANY SNAPSHOT
- TABLE 100. VESTAS WIND SYSTEMS A/S: PRODUCT SEGMENTS
- TABLE 101. VESTAS WIND SYSTEMS A/S: SERVICE SEGMENTS
- TABLE 102. VESTAS WIND SYSTEMS A/S: PRODUCT PORTFOLIO
- TABLE 103. VESTAS WIND SYSTEMS A/S: KEY STRATERGIES
- TABLE 104. ALSTOM SA: KEY EXECUTIVES
- TABLE 105. ALSTOM SA: COMPANY SNAPSHOT
- TABLE 106. ALSTOM SA: PRODUCT SEGMENTS
- TABLE 107. ALSTOM SA: SERVICE SEGMENTS
- TABLE 108. ALSTOM SA: PRODUCT PORTFOLIO
- TABLE 109. ALSTOM SA: KEY STRATERGIES
- TABLE 110. CONSTELLATION ENERGY CORPORATION: KEY EXECUTIVES
- TABLE 111. CONSTELLATION ENERGY CORPORATION: COMPANY SNAPSHOT
- TABLE 112. CONSTELLATION ENERGY CORPORATION: PRODUCT SEGMENTS
- TABLE 113. CONSTELLATION ENERGY CORPORATION: SERVICE SEGMENTS
- TABLE 114. CONSTELLATION ENERGY CORPORATION: PRODUCT PORTFOLIO
- TABLE 115. CONSTELLATION ENERGY CORPORATION: KEY STRATERGIES
- TABLE 116. NTPC LIMITED: KEY EXECUTIVES
- TABLE 117. NTPC LIMITED: COMPANY SNAPSHOT
- TABLE 118. NTPC LIMITED: PRODUCT SEGMENTS
- TABLE 119. NTPC LIMITED: SERVICE SEGMENTS
- TABLE 120. NTPC LIMITED: PRODUCT PORTFOLIO
- TABLE 121. NTPC LIMITED: KEY STRATERGIES
LIST OF FIGURES
- FIGURE 01. CLEAN ENERGY MARKET, 2022-2032
- FIGURE 02. SEGMENTATION OF CLEAN ENERGY MARKET,2022-2032
- FIGURE 03. TOP IMPACTING FACTORS IN CLEAN ENERGY MARKET
- FIGURE 04. TOP INVESTMENT POCKETS IN CLEAN ENERGY MARKET (2023-2032)
- FIGURE 05. BARGAINING POWER OF SUPPLIERS
- FIGURE 06. BARGAINING POWER OF BUYERS
- FIGURE 07. THREAT OF SUBSTITUTION
- FIGURE 08. THREAT OF SUBSTITUTION
- FIGURE 09. COMPETITIVE RIVALRY
- FIGURE 10. GLOBAL CLEAN ENERGY MARKET:DRIVERS, RESTRAINTS AND OPPORTUNITIES
- FIGURE 11. IMPACT OF KEY REGULATION: CLEAN ENERGY MARKET
- FIGURE 12. CLEAN ENERGY MARKET, BY TYPE, 2022 AND 2032(%)
- FIGURE 13. COMPARATIVE SHARE ANALYSIS OF CLEAN ENERGY MARKET FOR WIND ENERGY, BY COUNTRY 2022 AND 2032(%)
- FIGURE 14. COMPARATIVE SHARE ANALYSIS OF CLEAN ENERGY MARKET FOR SOLAR ENERGY, BY COUNTRY 2022 AND 2032(%)
- FIGURE 15. COMPARATIVE SHARE ANALYSIS OF CLEAN ENERGY MARKET FOR GEOTHERMAL ENERGY, BY COUNTRY 2022 AND 2032(%)
- FIGURE 16. COMPARATIVE SHARE ANALYSIS OF CLEAN ENERGY MARKET FOR BIOMASS, BY COUNTRY 2022 AND 2032(%)
- FIGURE 17. COMPARATIVE SHARE ANALYSIS OF CLEAN ENERGY MARKET FOR OTHERS, BY COUNTRY 2022 AND 2032(%)
- FIGURE 18. CLEAN ENERGY MARKET, BY APPLICATION, 2022 AND 2032(%)
- FIGURE 19. COMPARATIVE SHARE ANALYSIS OF CLEAN ENERGY MARKET FOR RESIDENTIAL, BY COUNTRY 2022 AND 2032(%)
- FIGURE 20. COMPARATIVE SHARE ANALYSIS OF CLEAN ENERGY MARKET FOR COMMERCIAL, BY COUNTRY 2022 AND 2032(%)
- FIGURE 21. COMPARATIVE SHARE ANALYSIS OF CLEAN ENERGY MARKET FOR INDUSTRIAL, BY COUNTRY 2022 AND 2032(%)
- FIGURE 22. CLEAN ENERGY MARKET BY REGION, 2022 AND 2032(%)
- FIGURE 23. U.S. CLEAN ENERGY MARKET, 2022-2032 ($BILLION)
- FIGURE 24. CANADA CLEAN ENERGY MARKET, 2022-2032 ($BILLION)
- FIGURE 25. MEXICO CLEAN ENERGY MARKET, 2022-2032 ($BILLION)
- FIGURE 26. GERMANY CLEAN ENERGY MARKET, 2022-2032 ($BILLION)
- FIGURE 27. FRANCE CLEAN ENERGY MARKET, 2022-2032 ($BILLION)
- FIGURE 28. ITALY CLEAN ENERGY MARKET, 2022-2032 ($BILLION)
- FIGURE 29. SPAIN CLEAN ENERGY MARKET, 2022-2032 ($BILLION)
- FIGURE 30. UK CLEAN ENERGY MARKET, 2022-2032 ($BILLION)
- FIGURE 31. REST OF EUROPE CLEAN ENERGY MARKET, 2022-2032 ($BILLION)
- FIGURE 32. CHINA CLEAN ENERGY MARKET, 2022-2032 ($BILLION)
- FIGURE 33. JAPAN CLEAN ENERGY MARKET, 2022-2032 ($BILLION)
- FIGURE 34. INDIA CLEAN ENERGY MARKET, 2022-2032 ($BILLION)
- FIGURE 35. SOUTH KOREA CLEAN ENERGY MARKET, 2022-2032 ($BILLION)
- FIGURE 36. AUSTRALIA CLEAN ENERGY MARKET, 2022-2032 ($BILLION)
- FIGURE 37. REST OF ASIA-PACIFIC CLEAN ENERGY MARKET, 2022-2032 ($BILLION)
- FIGURE 38. BRAZIL CLEAN ENERGY MARKET, 2022-2032 ($BILLION)
- FIGURE 39. SAUDI ARABIA CLEAN ENERGY MARKET, 2022-2032 ($BILLION)
- FIGURE 40. SOUTH AFRICA CLEAN ENERGY MARKET, 2022-2032 ($BILLION)
- FIGURE 41. REST OF LAMEA CLEAN ENERGY MARKET, 2022-2032 ($BILLION)
- FIGURE 42. TOP WINNING STRATEGIES, BY YEAR
- FIGURE 43. TOP WINNING STRATEGIES, BY DEVELOPMENT
- FIGURE 44. TOP WINNING STRATEGIES, BY COMPANY
- FIGURE 45. PRODUCT MAPPING OF TOP 10 PLAYERS
- FIGURE 46. COMPETITIVE DASHBOARD
- FIGURE 47. COMPETITIVE HEATMAP: CLEAN ENERGY MARKET
- FIGURE 48. TOP PLAYER POSITIONING, 2022
 全球清洁能源转型市场冷凝火管化学锅炉市场机会、成长动力、产业趋势分析及 2025 - 2034 年预测
 2025年清洁能源技术全球市场报告清洁能源市场:2033 年市场分析与预测 - 按类型、按产品、按服务、按技术、按组件、按应用、按部署、按最终用户、按安装类型、按解决方案火管冷凝低温工业锅炉市场机会、成长动力、产业趋势分析及 2025 - 2034 年预测冷却仪表市场机会、成长动力、产业趋势分析与 2025 - 2034 年预测2025年至2034年冷凝式火管低温工业锅炉市场机会、成长动力、产业趋势分析与预测
 全球清洁能源基础设施市场(按基础设施类型和最终用途)- 机会分析和产业预测,2024 年至 2033 年商用冷却表市场机会、成长驱动因素、产业趋势分析与预测 2024 - 2032 年超音波冷却表市场、机会、成长动力、产业趋势分析与预测,2024-2032