


 |
市场调查报告书
商品编码
1472334
N-溴代琥珀酰亚胺市场:按内容、按应用划分:2023-2032 年全球机会分析与产业预测N-Bromosuccinimide Market By Content (Content 99, Content 98), By Application (Pharmaceutical Industry, Pesticides Industry, Others): Global Opportunity Analysis and Industry Forecast, 2023-2032 |
||||||
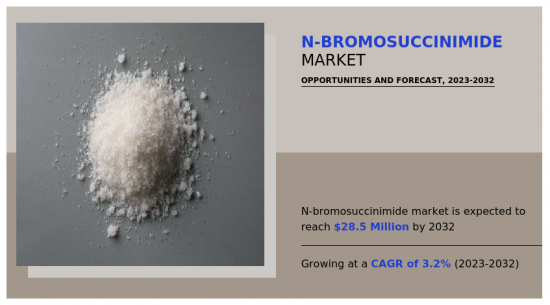
N-溴代琥珀酰亚胺市场预计2022年将达2,110万美元,2032年将达2,850万美元,2023年至2032年复合年增长率为3.2%。
N-溴代琥珀酰亚胺(NBS)是一种用途广泛的有机化合物,用于各种化学反应,特别是有机合成。它是一种白色结晶质固体,由连接到溴原子的琥珀酰亚胺环组成。 NBS 主要用作溴化剂,促进氢原子被溴原子取代的取代反应。其选择性溴化能力使其在有机化合物(包括药物和复杂分子)的合成上具有重要价值。 NBS 优于其他溴化剂,因为其温和性质可最大程度地减少不必要的副反应。由于其受控的反应活性和广泛的适用性,NBS已成为有机化学的基石。
特种化学品需求的增加预计将显着推动 N-溴代琥珀酰亚胺市场的成长。特种化学品在多种行业中发挥重要作用,包括製药、农业化学品、香料和聚合物。 NBS作为主要的溴化剂,由于其选择性溴化能力和与基材的相容性,被广泛应用于特种化学品的合成中。随着产业越来越注重开发具有特定功能的付加价值产品,对特种化学品的需求持续增长。这一趋势是由消费者偏好变化、技术进步和监管要求等因素所推动的。因此,作为特种化学品生产中的重要成分,NBS 的需求预计将大幅增加。
透过满足依赖特种化学品的行业不断增长的需求,NBS 製造商可能会看到更大的市场机会和更高的市场渗透率。此外,NBS 在各种化学製程中的多功能性和有效性使其成为特种化学品需求快速增长的首选,进一步推动了市场成长。
替代品的供应是 N-溴代琥珀酰亚胺 (NBS) 市场成长的主要挑战。 NBS 由于其选择性和高效性,在各种化学反应,特别是有机合成中通常用作溴化剂。然而,对于溴化反应存在替代试剂和方法,包括其他溴化剂,例如溴、溴盐和有机溴化物。此外,无溴方法,例如金属催化的溴化反应和自由基溴化过程,在某些应用中也可以作为NBS的替代品。
与 NBS 相比,这些替代试剂和方法可能具有成本更低、易于操作、安全性更高和环境友善等优点。例如,一些替代溴化剂可能比 NBS 更容易获得或更便宜,特别是在 NBS 生产或分销受到限制的地区。此外,在具有严格法规和永续性目标的行业中,可能会优先考虑最大限度地减少有害副产品的产生或减少对环境影响的替代品。替代品的出现不仅为消费者提供了选择,而且增加了溴化剂市场的竞争。这种竞争压力可能会限制 NBS 的市场占有率和成长前景,特别是如果替代试剂或替代方案以更低的成本提供类似的性能或具有其他优势的话。
向溴化试剂的转变为 N-溴代琥珀酰亚胺 (NBS) 市场带来了利润丰厚的机会。溴基试剂因其在各种化学反应中的多功能性和有效性而在各行业中受到高度重视。 NBS 作为主要的溴化试剂,正受益于此趋势,因为它具有独特的优势,例如选择性溴化以及与各种合成技术的兼容性。製药、农业化学品和聚合物等行业越来越依赖 NBS 等溴化试剂来满足其对高效和永续化学製程不断变化的需求。
此外,NBS 的特性使其特别适合需要精确控制溴化反应的应用,例如医药中间体和特殊化学品的合成。随着世界各地的产业认识到溴化试剂有助于提高产品品质和製程效率,预计对 NBS 的需求将大幅成长。因此,NBS 製造商有一个有利的机会,可以透过提供满足各个工业部门不断变化的需求的高品质产品和创新解决方案来利用向溴基化学的转变。
N-溴代琥珀酰亚胺市场按内容、应用和地区细分。依内容划分,市场分为99%和98%内容。依用途分为医药工业、农化工业等。按地区划分,我们研究了北美、欧洲、亚太地区和拉丁美洲地区 (LAMEA) 的市场。
相关人员的主要利益
- 本报告定量分析了 2022 年至 2032 年正溴代琥珀酰亚胺市场的细分市场、当前趋势、估计和动态,并确定了当前的正溴代琥珀酰亚胺市场机会。
- 我们提供市场研究以及与市场驱动因素、市场限制和市场机会相关的资讯。
- 波特的五力分析揭示了买方和供应商的潜力,可帮助相关人员做出以利润为导向的业务决策并加强供应商和买方网络。
- 对正溴代琥珀酰亚胺市场细分的详细分析有助于识别市场机会。
- 每个地区的主要国家都根据其对全球市场的收益贡献绘製了地图。
- 市场参与者定位有助于对标,并可以清楚了解市场参与者的当前地位。
- 该报告包括对区域和全球正溴代琥珀酰亚胺市场趋势、主要企业、细分市场、应用领域和市场成长策略的分析。
可以使用此报告进行报告客製化(可能需要额外费用和时间表)
- 产品中所含原料分析(%)
- 製造能力
- 消费者购买行为分析
- 最终用户偏好和痛点
- 投资机会
- 产品基准/产品规格及应用
- 情境分析及成长趋势比较
- 供应链分析与供应商利润
- 按地区分類的新参与企业
- 按产品/细分市场细分
- 新品开发/各大厂商产品矩阵
- 监管指引
- 策略建议
- 根据客户兴趣新增其他公司简介
- 按国家或地区进行的附加分析 – 市场规模和预测
- 平均售价分析/价格分布分析
- 公司简介的扩充列表
- 主要参与者的详细资料(Excel格式,包括位置、联络资讯、供应商/供应商网路等)
- 客户/消费者/原料供应商名单 - 价值链分析
- 全球/区域/国家层级参与者的市场占有率分析
- 产品消费分析
- SWOT分析
- 成交量市场规模及预测
目录
第一章简介
第 2 章执行摘要
第三章市场概况
- 市场定义和范围
- 主要发现
- 影响因素
- 主要投资机会
- 波特五力分析
- 市场动态
- 促进因素
- 抑制因素
- 机会
- 价值链分析
- 关键监管分析
- 专利情况
第四章 N-溴代琥珀酰亚胺市场:依内容分类
- 概述
- 内容 99
- 内容 98
第五章 N-溴代琥珀酰亚胺市场:依应用分类
- 概述
- 製药业
- 农药业
- 其他的
第六章 N-溴代琥珀酰亚胺市场:依地区
- 概述
- 北美洲
- 美国
- 加拿大
- 墨西哥
- 欧洲
- 德国
- 法国
- 英国
- 西班牙
- 义大利
- 其他的
- 亚太地区
- 中国
- 印度
- 日本
- 韩国
- 澳洲
- 其他的
- 拉丁美洲/中东/非洲
- 巴西
- 南非
- 沙乌地阿拉伯
- 其他的
第七章 竞争状况
- 介绍
- 关键成功策略
- 10家主要企业产品图谱
- 竞争对手仪表板
- 竞争热图
- 2022年主要企业定位
第八章 公司简介
- Nanjing Suru Chemical Co., Ltd
- HALIDES CHEMICALS PVT. LTD.
- Anhui Wotu Chemical Co., Ltd.
- Yizheng East Chemical Co., Ltd.
- Jiangxi Dasuo Chemical Co., Ltd
- Purecha Group
- Zhejiang Kente Catalysts Technologies Co., Ltd.
- SAMUH LAXMI CHEMICALS(BOM)P. LTD
- Resins & Allied Products Maharashtra, India
- MODY CHEMI PHARMA LTD.
The N-Bromosuccinimide market attained $21.1 million in 2022 and is projected to reach $28.5 million by 2032, growing at a CAGR of 3.2% from 2023 to 2032.
N-Bromosuccinimide (NBS) is a versatile organic compound utilized in various chemical reactions, particularly in organic synthesis. It appears as a white crystalline solid and is composed of a succinimide ring with a bromine atom attached. NBS is primarily employed as a brominating agent, facilitating substitution reactions where hydrogen atoms are replaced with bromine atoms. Its selective bromination capabilities make it valuable in synthesizing organic compounds, including pharmaceuticals and complex molecules. NBS is preferred over other brominating agents due to its mild nature, which minimizes unwanted side reactions. Its controlled reactivity and broad applicability make it a cornerstone in organic chemistry.
The increasing demand for specialty chemicals is poised to significantly drive the growth of the N-Bromosuccinimide market. Specialty chemicals play a crucial role in various industries, including pharmaceuticals, agrochemicals, flavors, fragrances, and polymers. NBS, as a key brominating agent, finds extensive use in the synthesis of specialty chemicals due to its selective bromination capabilities and compatibility with a wide range of substrates. As industries increasingly focus on developing high-value-added products with specific functionalities, the demand for specialty chemicals continues to rise. This trend is fueled by factors such as evolving consumer preferences, technological advancements, and regulatory requirements. Consequently, the demand for NBS as a vital ingredient in the production of specialty chemicals is expected to experience a notable upsurge.
Manufacturers of NBS are likely to witness expanded opportunities and increased market penetration as they cater to the growing needs of industries reliant on specialty chemicals. Moreover, the versatility and efficacy of NBS in various chemical processes position it as a preferred choice, further bolstering its market growth amidst the burgeoning demand for specialty chemicals.
The availability of alternatives poses a significant challenge to the growth of the N-Bromosuccinimide (NBS) market. NBS is commonly used as a brominating agent in various chemical reactions, particularly in organic synthesis, due to its selectivity and efficiency. However, alternative reagents and methods for bromination reactions exist, including other brominating agents such as bromine, bromine salts, and organic bromides. In addition, non-bromine-based methods such as metal-catalyzed bromination reactions or radical bromination processes offer alternatives to NBS in certain applications.
These alternative reagents and methods may offer advantages such as lower cost, easier handling, improved safety profiles, or environmental friendliness compared to NBS. For example, some alternative brominating agents may be more readily available or less expensive than NBS, particularly in regions where NBS production or distribution is limited. Furthermore, alternatives that minimize the generation of hazardous by-products or reduce environmental impact may be preferred in industries with stringent regulations or sustainability goals. The availability of alternatives not only provides consumers with options but also intensifies competition within the market for brominating agents. This competitive pressure can limit the market share and growth prospects of NBS, particularly if alternative reagents or methods offer comparable performance at a lower cost or with other advantages.
The shift towards bromine-based reagents presents a lucrative opportunity for the N-Bromosuccinimide (NBS) market. Bromine-based reagents are highly valued in various industries due to their versatility and efficacy in a wide range of chemical reactions. NBS, being a key bromine-based reagent, benefits from this trend as it offers unique advantages such as selective bromination and compatibility with diverse synthesis methodologies. Industries including pharmaceuticals, agrochemicals, and polymers increasingly rely on bromine-based reagents like NBS to meet their evolving needs for efficient and sustainable chemical processes.
Moreover, the properties of NBS make it particularly suitable for applications requiring precise control over bromination reactions, such as in the synthesis of pharmaceutical intermediates and specialty chemicals. As industries worldwide recognize the benefits of bromine-based reagents in enhancing product quality and process efficiency, the demand for NBS is expected to experience significant growth. Manufacturers of NBS are thus presented with a lucrative opportunity to capitalize on this shift towards bromine-based chemistry by offering high-quality products and innovative solutions tailored to meet the evolving demands of various industrial sectors.
The N-Bromosuccinimide market is segmented based on content, application, and region. By content, the market is bifurcated into content 99% and content 98%. By application, it is categorized into pharmaceutical industry, pesticides industry, and others. Region-wise, the market is studied across North America, Europe, Asia-Pacific, and LAMEA.
The major players operating in the global N-Bromosuccinimide market are Nanjing Suru Chemical Co., Ltd., HALIDES CHEMICALS PVT. LTD., Anhui Wotu Chemical Co., Ltd., Yizheng East Chemical Co., Ltd., Jiangxi Dasuo Chemical Co., Ltd., Purecha Group, Zhejiang Kente Catalysts Technologies Co., Ltd., SAMUH LAXMI CHEMICALS (BOM) P. LTD., Resins & Allied Products Maharashtra, India, and MODY CHEMI PHARMA LTD.
Other players include HARIKRISHNA ENTERPRISE, Global Pharma Chem., Haihang Industry, Fengchen Group Co., Ltd., Spectrum Chemical, and Clever Pathway Private Limited.
Key Benefits For Stakeholders
- This report provides a quantitative analysis of the market segments, current trends, estimations, and dynamics of the n-bromosuccinimide market analysis from 2022 to 2032 to identify the prevailing n-bromosuccinimide market opportunities.
- The market research is offered along with information related to key drivers, restraints, and opportunities.
- Porter's five forces analysis highlights the potency of buyers and suppliers to enable stakeholders make profit-oriented business decisions and strengthen their supplier-buyer network.
- In-depth analysis of the n-bromosuccinimide market segmentation assists to determine the prevailing market opportunities.
- Major countries in each region are mapped according to their revenue contribution to the global market.
- Market player positioning facilitates benchmarking and provides a clear understanding of the present position of the market players.
- The report includes the analysis of the regional as well as global n-bromosuccinimide market trends, key players, market segments, application areas, and market growth strategies.
Additional benefits you will get with this purchase are:
- Quarterly Update and* (only available with a corporate license, on listed price)
- 5 additional Company Profile of client Choice pre- or Post-purchase, as a free update.
- Free Upcoming Version on the Purchase of Five and Enterprise User License.
- 16 analyst hours of support* (post-purchase, if you find additional data requirements upon review of the report, you may receive support amounting to 16 analyst hours to solve questions, and post-sale queries)
- 15% Free Customization* (in case the scope or segment of the report does not match your requirements, 15% is equivalent to 3 working days of free work, applicable once)
- Free data Pack on the Five and Enterprise User License. (Excel version of the report)
- Free Updated report if the report is 6-12 months old or older.
- 24-hour priority response*
- Free Industry updates and white papers.
Possible Customization with this report (with additional cost and timeline, please talk to the sales executive to know more)
- Analysis of raw material in a product (by %)
- Manufacturing Capacity
- Consumer Buying Behavior Analysis
- End user preferences and pain points
- Investment Opportunities
- Product Benchmarking / Product specification and applications
- Senario Analysis & Growth Trend Comparision
- Supply Chain Analysis & Vendor Margins
- Upcoming/New Entrant by Regions
- Market share analysis of players by products/segments
- New Product Development/ Product Matrix of Key Players
- Regulatory Guidelines
- Strategic Recommedations
- Additional company profiles with specific to client's interest
- Additional country or region analysis- market size and forecast
- Average Selling Price Analysis / Price Point Analysis
- Expanded list for Company Profiles
- Key player details (including location, contact details, supplier/vendor network etc. in excel format)
- List of customers/consumers/raw material suppliers- value chain analysis
- Market share analysis of players at global/region/country level
- Product Consumption Analysis
- SWOT Analysis
- Volume Market Size and Forecast
Key Market Segments
By Content
- Content 99
- Content 98
By Application
- Pharmaceutical Industry
- Pesticides Industry
- Others
By Region
- North America
- U.S.
- Canada
- Mexico
- Europe
- Germany
- France
- UK
- Spain
- Italy
- Rest of Europe
- Asia-Pacific
- China
- India
- Japan
- South Korea
- Australia
- Rest of Asia-Pacific
- LAMEA
- Brazil
- South Africa
- Saudi Arabi
- Rest of LAMEA
Key Market Players:
- Nanjing Suru Chemical Co., Ltd
- HALIDES CHEMICALS PVT. LTD.
- Anhui Wotu Chemical Co., Ltd.
- Yizheng East Chemical Co., Ltd.
- Jiangxi Dasuo Chemical Co., Ltd
- Purecha Group
- Zhejiang Kente Catalysts Technologies Co., Ltd.
- SAMUH LAXMI CHEMICALS (BOM) P. LTD
- Resins & Allied Products Maharashtra, India
- MODY CHEMI PHARMA LTD.
TABLE OF CONTENTS
CHAPTER 1: INTRODUCTION
- 1.1. Report description
- 1.2. Key market segments
- 1.3. Key benefits to the stakeholders
- 1.4. Research methodology
- 1.4.1. Primary research
- 1.4.2. Secondary research
- 1.4.3. Analyst tools and models
CHAPTER 2: EXECUTIVE SUMMARY
- 2.1. CXO perspective
CHAPTER 3: MARKET OVERVIEW
- 3.1. Market definition and scope
- 3.2. Key findings
- 3.2.1. Top impacting factors
- 3.2.2. Top investment pockets
- 3.3. Porter's five forces analysis
- 3.4. Market dynamics
- 3.4.1. Drivers
- 3.4.2. Restraints
- 3.4.3. Opportunities
- 3.5. Value Chain Analysis
- 3.6. Key Regulation Analysis
- 3.7. Patent Landscape
CHAPTER 4: N-BROMOSUCCINIMIDE MARKET, BY CONTENT
- 4.1. Overview
- 4.1.1. Market size and forecast
- 4.2. Content 99
- 4.2.1. Key market trends, growth factors and opportunities
- 4.2.2. Market size and forecast, by region
- 4.2.3. Market share analysis by country
- 4.3. Content 98
- 4.3.1. Key market trends, growth factors and opportunities
- 4.3.2. Market size and forecast, by region
- 4.3.3. Market share analysis by country
CHAPTER 5: N-BROMOSUCCINIMIDE MARKET, BY APPLICATION
- 5.1. Overview
- 5.1.1. Market size and forecast
- 5.2. Pharmaceutical Industry
- 5.2.1. Key market trends, growth factors and opportunities
- 5.2.2. Market size and forecast, by region
- 5.2.3. Market share analysis by country
- 5.3. Pesticides Industry
- 5.3.1. Key market trends, growth factors and opportunities
- 5.3.2. Market size and forecast, by region
- 5.3.3. Market share analysis by country
- 5.4. Others
- 5.4.1. Key market trends, growth factors and opportunities
- 5.4.2. Market size and forecast, by region
- 5.4.3. Market share analysis by country
CHAPTER 6: N-BROMOSUCCINIMIDE MARKET, BY REGION
- 6.1. Overview
- 6.1.1. Market size and forecast By Region
- 6.2. North America
- 6.2.1. Key market trends, growth factors and opportunities
- 6.2.2. Market size and forecast, by Content
- 6.2.3. Market size and forecast, by Application
- 6.2.4. Market size and forecast, by country
- 6.2.4.1. U.S.
- 6.2.4.1.1. Market size and forecast, by Content
- 6.2.4.1.2. Market size and forecast, by Application
- 6.2.4.2. Canada
- 6.2.4.2.1. Market size and forecast, by Content
- 6.2.4.2.2. Market size and forecast, by Application
- 6.2.4.3. Mexico
- 6.2.4.3.1. Market size and forecast, by Content
- 6.2.4.3.2. Market size and forecast, by Application
- 6.3. Europe
- 6.3.1. Key market trends, growth factors and opportunities
- 6.3.2. Market size and forecast, by Content
- 6.3.3. Market size and forecast, by Application
- 6.3.4. Market size and forecast, by country
- 6.3.4.1. Germany
- 6.3.4.1.1. Market size and forecast, by Content
- 6.3.4.1.2. Market size and forecast, by Application
- 6.3.4.2. France
- 6.3.4.2.1. Market size and forecast, by Content
- 6.3.4.2.2. Market size and forecast, by Application
- 6.3.4.3. UK
- 6.3.4.3.1. Market size and forecast, by Content
- 6.3.4.3.2. Market size and forecast, by Application
- 6.3.4.4. Spain
- 6.3.4.4.1. Market size and forecast, by Content
- 6.3.4.4.2. Market size and forecast, by Application
- 6.3.4.5. Italy
- 6.3.4.5.1. Market size and forecast, by Content
- 6.3.4.5.2. Market size and forecast, by Application
- 6.3.4.6. Rest of Europe
- 6.3.4.6.1. Market size and forecast, by Content
- 6.3.4.6.2. Market size and forecast, by Application
- 6.4. Asia-Pacific
- 6.4.1. Key market trends, growth factors and opportunities
- 6.4.2. Market size and forecast, by Content
- 6.4.3. Market size and forecast, by Application
- 6.4.4. Market size and forecast, by country
- 6.4.4.1. China
- 6.4.4.1.1. Market size and forecast, by Content
- 6.4.4.1.2. Market size and forecast, by Application
- 6.4.4.2. India
- 6.4.4.2.1. Market size and forecast, by Content
- 6.4.4.2.2. Market size and forecast, by Application
- 6.4.4.3. Japan
- 6.4.4.3.1. Market size and forecast, by Content
- 6.4.4.3.2. Market size and forecast, by Application
- 6.4.4.4. South Korea
- 6.4.4.4.1. Market size and forecast, by Content
- 6.4.4.4.2. Market size and forecast, by Application
- 6.4.4.5. Australia
- 6.4.4.5.1. Market size and forecast, by Content
- 6.4.4.5.2. Market size and forecast, by Application
- 6.4.4.6. Rest of Asia-Pacific
- 6.4.4.6.1. Market size and forecast, by Content
- 6.4.4.6.2. Market size and forecast, by Application
- 6.5. LAMEA
- 6.5.1. Key market trends, growth factors and opportunities
- 6.5.2. Market size and forecast, by Content
- 6.5.3. Market size and forecast, by Application
- 6.5.4. Market size and forecast, by country
- 6.5.4.1. Brazil
- 6.5.4.1.1. Market size and forecast, by Content
- 6.5.4.1.2. Market size and forecast, by Application
- 6.5.4.2. South Africa
- 6.5.4.2.1. Market size and forecast, by Content
- 6.5.4.2.2. Market size and forecast, by Application
- 6.5.4.3. Saudi Arabi
- 6.5.4.3.1. Market size and forecast, by Content
- 6.5.4.3.2. Market size and forecast, by Application
- 6.5.4.4. Rest of LAMEA
- 6.5.4.4.1. Market size and forecast, by Content
- 6.5.4.4.2. Market size and forecast, by Application
CHAPTER 7: COMPETITIVE LANDSCAPE
- 7.1. Introduction
- 7.2. Top winning strategies
- 7.3. Product mapping of top 10 player
- 7.4. Competitive dashboard
- 7.5. Competitive heatmap
- 7.6. Top player positioning, 2022
CHAPTER 8: COMPANY PROFILES
- 8.1. Nanjing Suru Chemical Co., Ltd
- 8.1.1. Company overview
- 8.1.2. Key executives
- 8.1.3. Company snapshot
- 8.1.4. Operating business segments
- 8.1.5. Product portfolio
- 8.1.6. Business performance
- 8.1.7. Key strategic moves and developments
- 8.2. HALIDES CHEMICALS PVT. LTD.
- 8.2.1. Company overview
- 8.2.2. Key executives
- 8.2.3. Company snapshot
- 8.2.4. Operating business segments
- 8.2.5. Product portfolio
- 8.2.6. Business performance
- 8.2.7. Key strategic moves and developments
- 8.3. Anhui Wotu Chemical Co., Ltd.
- 8.3.1. Company overview
- 8.3.2. Key executives
- 8.3.3. Company snapshot
- 8.3.4. Operating business segments
- 8.3.5. Product portfolio
- 8.3.6. Business performance
- 8.3.7. Key strategic moves and developments
- 8.4. Yizheng East Chemical Co., Ltd.
- 8.4.1. Company overview
- 8.4.2. Key executives
- 8.4.3. Company snapshot
- 8.4.4. Operating business segments
- 8.4.5. Product portfolio
- 8.4.6. Business performance
- 8.4.7. Key strategic moves and developments
- 8.5. Jiangxi Dasuo Chemical Co., Ltd
- 8.5.1. Company overview
- 8.5.2. Key executives
- 8.5.3. Company snapshot
- 8.5.4. Operating business segments
- 8.5.5. Product portfolio
- 8.5.6. Business performance
- 8.5.7. Key strategic moves and developments
- 8.6. Purecha Group
- 8.6.1. Company overview
- 8.6.2. Key executives
- 8.6.3. Company snapshot
- 8.6.4. Operating business segments
- 8.6.5. Product portfolio
- 8.6.6. Business performance
- 8.6.7. Key strategic moves and developments
- 8.7. Zhejiang Kente Catalysts Technologies Co., Ltd.
- 8.7.1. Company overview
- 8.7.2. Key executives
- 8.7.3. Company snapshot
- 8.7.4. Operating business segments
- 8.7.5. Product portfolio
- 8.7.6. Business performance
- 8.7.7. Key strategic moves and developments
- 8.8. SAMUH LAXMI CHEMICALS (BOM) P. LTD
- 8.8.1. Company overview
- 8.8.2. Key executives
- 8.8.3. Company snapshot
- 8.8.4. Operating business segments
- 8.8.5. Product portfolio
- 8.8.6. Business performance
- 8.8.7. Key strategic moves and developments
- 8.9. Resins & Allied Products Maharashtra, India
- 8.9.1. Company overview
- 8.9.2. Key executives
- 8.9.3. Company snapshot
- 8.9.4. Operating business segments
- 8.9.5. Product portfolio
- 8.9.6. Business performance
- 8.9.7. Key strategic moves and developments
- 8.10. MODY CHEMI PHARMA LTD.
- 8.10.1. Company overview
- 8.10.2. Key executives
- 8.10.3. Company snapshot
- 8.10.4. Operating business segments
- 8.10.5. Product portfolio
- 8.10.6. Business performance
- 8.10.7. Key strategic moves and developments
LIST OF TABLES
- TABLE 01. GLOBAL N-BROMOSUCCINIMIDE MARKET, BY CONTENT, 2022-2032 ($MILLION)
- TABLE 02. N-BROMOSUCCINIMIDE MARKET FOR CONTENT 99, BY REGION, 2022-2032 ($MILLION)
- TABLE 03. N-BROMOSUCCINIMIDE MARKET FOR CONTENT 98, BY REGION, 2022-2032 ($MILLION)
- TABLE 04. GLOBAL N-BROMOSUCCINIMIDE MARKET, BY APPLICATION, 2022-2032 ($MILLION)
- TABLE 05. N-BROMOSUCCINIMIDE MARKET FOR PHARMACEUTICAL INDUSTRY, BY REGION, 2022-2032 ($MILLION)
- TABLE 06. N-BROMOSUCCINIMIDE MARKET FOR PESTICIDES INDUSTRY, BY REGION, 2022-2032 ($MILLION)
- TABLE 07. N-BROMOSUCCINIMIDE MARKET FOR OTHERS, BY REGION, 2022-2032 ($MILLION)
- TABLE 08. N-BROMOSUCCINIMIDE MARKET, BY REGION, 2022-2032 ($MILLION)
- TABLE 09. NORTH AMERICA N-BROMOSUCCINIMIDE MARKET, BY CONTENT, 2022-2032 ($MILLION)
- TABLE 10. NORTH AMERICA N-BROMOSUCCINIMIDE MARKET, BY APPLICATION, 2022-2032 ($MILLION)
- TABLE 11. NORTH AMERICA N-BROMOSUCCINIMIDE MARKET, BY COUNTRY, 2022-2032 ($MILLION)
- TABLE 12. U.S. N-BROMOSUCCINIMIDE MARKET, BY CONTENT, 2022-2032 ($MILLION)
- TABLE 13. U.S. N-BROMOSUCCINIMIDE MARKET, BY APPLICATION, 2022-2032 ($MILLION)
- TABLE 14. CANADA N-BROMOSUCCINIMIDE MARKET, BY CONTENT, 2022-2032 ($MILLION)
- TABLE 15. CANADA N-BROMOSUCCINIMIDE MARKET, BY APPLICATION, 2022-2032 ($MILLION)
- TABLE 16. MEXICO N-BROMOSUCCINIMIDE MARKET, BY CONTENT, 2022-2032 ($MILLION)
- TABLE 17. MEXICO N-BROMOSUCCINIMIDE MARKET, BY APPLICATION, 2022-2032 ($MILLION)
- TABLE 18. EUROPE N-BROMOSUCCINIMIDE MARKET, BY CONTENT, 2022-2032 ($MILLION)
- TABLE 19. EUROPE N-BROMOSUCCINIMIDE MARKET, BY APPLICATION, 2022-2032 ($MILLION)
- TABLE 20. EUROPE N-BROMOSUCCINIMIDE MARKET, BY COUNTRY, 2022-2032 ($MILLION)
- TABLE 21. GERMANY N-BROMOSUCCINIMIDE MARKET, BY CONTENT, 2022-2032 ($MILLION)
- TABLE 22. GERMANY N-BROMOSUCCINIMIDE MARKET, BY APPLICATION, 2022-2032 ($MILLION)
- TABLE 23. FRANCE N-BROMOSUCCINIMIDE MARKET, BY CONTENT, 2022-2032 ($MILLION)
- TABLE 24. FRANCE N-BROMOSUCCINIMIDE MARKET, BY APPLICATION, 2022-2032 ($MILLION)
- TABLE 25. UK N-BROMOSUCCINIMIDE MARKET, BY CONTENT, 2022-2032 ($MILLION)
- TABLE 26. UK N-BROMOSUCCINIMIDE MARKET, BY APPLICATION, 2022-2032 ($MILLION)
- TABLE 27. SPAIN N-BROMOSUCCINIMIDE MARKET, BY CONTENT, 2022-2032 ($MILLION)
- TABLE 28. SPAIN N-BROMOSUCCINIMIDE MARKET, BY APPLICATION, 2022-2032 ($MILLION)
- TABLE 29. ITALY N-BROMOSUCCINIMIDE MARKET, BY CONTENT, 2022-2032 ($MILLION)
- TABLE 30. ITALY N-BROMOSUCCINIMIDE MARKET, BY APPLICATION, 2022-2032 ($MILLION)
- TABLE 31. REST OF EUROPE N-BROMOSUCCINIMIDE MARKET, BY CONTENT, 2022-2032 ($MILLION)
- TABLE 32. REST OF EUROPE N-BROMOSUCCINIMIDE MARKET, BY APPLICATION, 2022-2032 ($MILLION)
- TABLE 33. ASIA-PACIFIC N-BROMOSUCCINIMIDE MARKET, BY CONTENT, 2022-2032 ($MILLION)
- TABLE 34. ASIA-PACIFIC N-BROMOSUCCINIMIDE MARKET, BY APPLICATION, 2022-2032 ($MILLION)
- TABLE 35. ASIA-PACIFIC N-BROMOSUCCINIMIDE MARKET, BY COUNTRY, 2022-2032 ($MILLION)
- TABLE 36. CHINA N-BROMOSUCCINIMIDE MARKET, BY CONTENT, 2022-2032 ($MILLION)
- TABLE 37. CHINA N-BROMOSUCCINIMIDE MARKET, BY APPLICATION, 2022-2032 ($MILLION)
- TABLE 38. INDIA N-BROMOSUCCINIMIDE MARKET, BY CONTENT, 2022-2032 ($MILLION)
- TABLE 39. INDIA N-BROMOSUCCINIMIDE MARKET, BY APPLICATION, 2022-2032 ($MILLION)
- TABLE 40. JAPAN N-BROMOSUCCINIMIDE MARKET, BY CONTENT, 2022-2032 ($MILLION)
- TABLE 41. JAPAN N-BROMOSUCCINIMIDE MARKET, BY APPLICATION, 2022-2032 ($MILLION)
- TABLE 42. SOUTH KOREA N-BROMOSUCCINIMIDE MARKET, BY CONTENT, 2022-2032 ($MILLION)
- TABLE 43. SOUTH KOREA N-BROMOSUCCINIMIDE MARKET, BY APPLICATION, 2022-2032 ($MILLION)
- TABLE 44. AUSTRALIA N-BROMOSUCCINIMIDE MARKET, BY CONTENT, 2022-2032 ($MILLION)
- TABLE 45. AUSTRALIA N-BROMOSUCCINIMIDE MARKET, BY APPLICATION, 2022-2032 ($MILLION)
- TABLE 46. REST OF ASIA-PACIFIC N-BROMOSUCCINIMIDE MARKET, BY CONTENT, 2022-2032 ($MILLION)
- TABLE 47. REST OF ASIA-PACIFIC N-BROMOSUCCINIMIDE MARKET, BY APPLICATION, 2022-2032 ($MILLION)
- TABLE 48. LAMEA N-BROMOSUCCINIMIDE MARKET, BY CONTENT, 2022-2032 ($MILLION)
- TABLE 49. LAMEA N-BROMOSUCCINIMIDE MARKET, BY APPLICATION, 2022-2032 ($MILLION)
- TABLE 50. LAMEA N-BROMOSUCCINIMIDE MARKET, BY COUNTRY, 2022-2032 ($MILLION)
- TABLE 51. BRAZIL N-BROMOSUCCINIMIDE MARKET, BY CONTENT, 2022-2032 ($MILLION)
- TABLE 52. BRAZIL N-BROMOSUCCINIMIDE MARKET, BY APPLICATION, 2022-2032 ($MILLION)
- TABLE 53. SOUTH AFRICA N-BROMOSUCCINIMIDE MARKET, BY CONTENT, 2022-2032 ($MILLION)
- TABLE 54. SOUTH AFRICA N-BROMOSUCCINIMIDE MARKET, BY APPLICATION, 2022-2032 ($MILLION)
- TABLE 55. SAUDI ARABI N-BROMOSUCCINIMIDE MARKET, BY CONTENT, 2022-2032 ($MILLION)
- TABLE 56. SAUDI ARABI N-BROMOSUCCINIMIDE MARKET, BY APPLICATION, 2022-2032 ($MILLION)
- TABLE 57. REST OF LAMEA N-BROMOSUCCINIMIDE MARKET, BY CONTENT, 2022-2032 ($MILLION)
- TABLE 58. REST OF LAMEA N-BROMOSUCCINIMIDE MARKET, BY APPLICATION, 2022-2032 ($MILLION)
- TABLE 59. NANJING SURU CHEMICAL CO., LTD: KEY EXECUTIVES
- TABLE 60. NANJING SURU CHEMICAL CO., LTD: COMPANY SNAPSHOT
- TABLE 61. NANJING SURU CHEMICAL CO., LTD: PRODUCT SEGMENTS
- TABLE 62. NANJING SURU CHEMICAL CO., LTD: SERVICE SEGMENTS
- TABLE 63. NANJING SURU CHEMICAL CO., LTD: PRODUCT PORTFOLIO
- TABLE 64. NANJING SURU CHEMICAL CO., LTD: KEY STRATERGIES
- TABLE 65. HALIDES CHEMICALS PVT. LTD.: KEY EXECUTIVES
- TABLE 66. HALIDES CHEMICALS PVT. LTD.: COMPANY SNAPSHOT
- TABLE 67. HALIDES CHEMICALS PVT. LTD.: PRODUCT SEGMENTS
- TABLE 68. HALIDES CHEMICALS PVT. LTD.: SERVICE SEGMENTS
- TABLE 69. HALIDES CHEMICALS PVT. LTD.: PRODUCT PORTFOLIO
- TABLE 70. HALIDES CHEMICALS PVT. LTD.: KEY STRATERGIES
- TABLE 71. ANHUI WOTU CHEMICAL CO., LTD.: KEY EXECUTIVES
- TABLE 72. ANHUI WOTU CHEMICAL CO., LTD.: COMPANY SNAPSHOT
- TABLE 73. ANHUI WOTU CHEMICAL CO., LTD.: PRODUCT SEGMENTS
- TABLE 74. ANHUI WOTU CHEMICAL CO., LTD.: SERVICE SEGMENTS
- TABLE 75. ANHUI WOTU CHEMICAL CO., LTD.: PRODUCT PORTFOLIO
- TABLE 76. ANHUI WOTU CHEMICAL CO., LTD.: KEY STRATERGIES
- TABLE 77. YIZHENG EAST CHEMICAL CO., LTD.: KEY EXECUTIVES
- TABLE 78. YIZHENG EAST CHEMICAL CO., LTD.: COMPANY SNAPSHOT
- TABLE 79. YIZHENG EAST CHEMICAL CO., LTD.: PRODUCT SEGMENTS
- TABLE 80. YIZHENG EAST CHEMICAL CO., LTD.: SERVICE SEGMENTS
- TABLE 81. YIZHENG EAST CHEMICAL CO., LTD.: PRODUCT PORTFOLIO
- TABLE 82. YIZHENG EAST CHEMICAL CO., LTD.: KEY STRATERGIES
- TABLE 83. JIANGXI DASUO CHEMICAL CO., LTD: KEY EXECUTIVES
- TABLE 84. JIANGXI DASUO CHEMICAL CO., LTD: COMPANY SNAPSHOT
- TABLE 85. JIANGXI DASUO CHEMICAL CO., LTD: PRODUCT SEGMENTS
- TABLE 86. JIANGXI DASUO CHEMICAL CO., LTD: SERVICE SEGMENTS
- TABLE 87. JIANGXI DASUO CHEMICAL CO., LTD: PRODUCT PORTFOLIO
- TABLE 88. JIANGXI DASUO CHEMICAL CO., LTD: KEY STRATERGIES
- TABLE 89. PURECHA GROUP: KEY EXECUTIVES
- TABLE 90. PURECHA GROUP: COMPANY SNAPSHOT
- TABLE 91. PURECHA GROUP: PRODUCT SEGMENTS
- TABLE 92. PURECHA GROUP: SERVICE SEGMENTS
- TABLE 93. PURECHA GROUP: PRODUCT PORTFOLIO
- TABLE 94. PURECHA GROUP: KEY STRATERGIES
- TABLE 95. ZHEJIANG KENTE CATALYSTS TECHNOLOGIES CO., LTD.: KEY EXECUTIVES
- TABLE 96. ZHEJIANG KENTE CATALYSTS TECHNOLOGIES CO., LTD.: COMPANY SNAPSHOT
- TABLE 97. ZHEJIANG KENTE CATALYSTS TECHNOLOGIES CO., LTD.: PRODUCT SEGMENTS
- TABLE 98. ZHEJIANG KENTE CATALYSTS TECHNOLOGIES CO., LTD.: SERVICE SEGMENTS
- TABLE 99. ZHEJIANG KENTE CATALYSTS TECHNOLOGIES CO., LTD.: PRODUCT PORTFOLIO
- TABLE 100. ZHEJIANG KENTE CATALYSTS TECHNOLOGIES CO., LTD.: KEY STRATERGIES
- TABLE 101. SAMUH LAXMI CHEMICALS (BOM) P. LTD: KEY EXECUTIVES
- TABLE 102. SAMUH LAXMI CHEMICALS (BOM) P. LTD: COMPANY SNAPSHOT
- TABLE 103. SAMUH LAXMI CHEMICALS (BOM) P. LTD: PRODUCT SEGMENTS
- TABLE 104. SAMUH LAXMI CHEMICALS (BOM) P. LTD: SERVICE SEGMENTS
- TABLE 105. SAMUH LAXMI CHEMICALS (BOM) P. LTD: PRODUCT PORTFOLIO
- TABLE 106. SAMUH LAXMI CHEMICALS (BOM) P. LTD: KEY STRATERGIES
- TABLE 107. RESINS & ALLIED PRODUCTS MAHARASHTRA, INDIA: KEY EXECUTIVES
- TABLE 108. RESINS & ALLIED PRODUCTS MAHARASHTRA, INDIA: COMPANY SNAPSHOT
- TABLE 109. RESINS & ALLIED PRODUCTS MAHARASHTRA, INDIA: PRODUCT SEGMENTS
- TABLE 110. RESINS & ALLIED PRODUCTS MAHARASHTRA, INDIA: SERVICE SEGMENTS
- TABLE 111. RESINS & ALLIED PRODUCTS MAHARASHTRA, INDIA: PRODUCT PORTFOLIO
- TABLE 112. RESINS & ALLIED PRODUCTS MAHARASHTRA, INDIA: KEY STRATERGIES
- TABLE 113. MODY CHEMI PHARMA LTD.: KEY EXECUTIVES
- TABLE 114. MODY CHEMI PHARMA LTD.: COMPANY SNAPSHOT
- TABLE 115. MODY CHEMI PHARMA LTD.: PRODUCT SEGMENTS
- TABLE 116. MODY CHEMI PHARMA LTD.: SERVICE SEGMENTS
- TABLE 117. MODY CHEMI PHARMA LTD.: PRODUCT PORTFOLIO
- TABLE 118. MODY CHEMI PHARMA LTD.: KEY STRATERGIES
LIST OF FIGURES
- FIGURE 01. N-BROMOSUCCINIMIDE MARKET, 2022-2032
- FIGURE 02. SEGMENTATION OF N-BROMOSUCCINIMIDE MARKET,2022-2032
- FIGURE 03. TOP IMPACTING FACTORS IN N-BROMOSUCCINIMIDE MARKET
- FIGURE 04. TOP INVESTMENT POCKETS IN N-BROMOSUCCINIMIDE MARKET (2023-2032)
- FIGURE 05. BARGAINING POWER OF SUPPLIERS
- FIGURE 06. BARGAINING POWER OF BUYERS
- FIGURE 07. THREAT OF SUBSTITUTION
- FIGURE 08. THREAT OF SUBSTITUTION
- FIGURE 09. COMPETITIVE RIVALRY
- FIGURE 10. GLOBAL N-BROMOSUCCINIMIDE MARKET:DRIVERS, RESTRAINTS AND OPPORTUNITIES
- FIGURE 11. IMPACT OF KEY REGULATION: N-BROMOSUCCINIMIDE MARKET
- FIGURE 12. PATENT ANALYSIS BY COMPANY
- FIGURE 13. PATENT ANALYSIS BY COUNTRY
- FIGURE 14. N-BROMOSUCCINIMIDE MARKET, BY CONTENT, 2022 AND 2032(%)
- FIGURE 15. COMPARATIVE SHARE ANALYSIS OF N-BROMOSUCCINIMIDE MARKET FOR CONTENT 99, BY COUNTRY 2022 AND 2032(%)
- FIGURE 16. COMPARATIVE SHARE ANALYSIS OF N-BROMOSUCCINIMIDE MARKET FOR CONTENT 98, BY COUNTRY 2022 AND 2032(%)
- FIGURE 17. N-BROMOSUCCINIMIDE MARKET, BY APPLICATION, 2022 AND 2032(%)
- FIGURE 18. COMPARATIVE SHARE ANALYSIS OF N-BROMOSUCCINIMIDE MARKET FOR PHARMACEUTICAL INDUSTRY, BY COUNTRY 2022 AND 2032(%)
- FIGURE 19. COMPARATIVE SHARE ANALYSIS OF N-BROMOSUCCINIMIDE MARKET FOR PESTICIDES INDUSTRY, BY COUNTRY 2022 AND 2032(%)
- FIGURE 20. COMPARATIVE SHARE ANALYSIS OF N-BROMOSUCCINIMIDE MARKET FOR OTHERS, BY COUNTRY 2022 AND 2032(%)
- FIGURE 21. N-BROMOSUCCINIMIDE MARKET BY REGION, 2022 AND 2032(%)
- FIGURE 22. U.S. N-BROMOSUCCINIMIDE MARKET, 2022-2032 ($MILLION)
- FIGURE 23. CANADA N-BROMOSUCCINIMIDE MARKET, 2022-2032 ($MILLION)
- FIGURE 24. MEXICO N-BROMOSUCCINIMIDE MARKET, 2022-2032 ($MILLION)
- FIGURE 25. GERMANY N-BROMOSUCCINIMIDE MARKET, 2022-2032 ($MILLION)
- FIGURE 26. FRANCE N-BROMOSUCCINIMIDE MARKET, 2022-2032 ($MILLION)
- FIGURE 27. UK N-BROMOSUCCINIMIDE MARKET, 2022-2032 ($MILLION)
- FIGURE 28. SPAIN N-BROMOSUCCINIMIDE MARKET, 2022-2032 ($MILLION)
- FIGURE 29. ITALY N-BROMOSUCCINIMIDE MARKET, 2022-2032 ($MILLION)
- FIGURE 30. REST OF EUROPE N-BROMOSUCCINIMIDE MARKET, 2022-2032 ($MILLION)
- FIGURE 31. CHINA N-BROMOSUCCINIMIDE MARKET, 2022-2032 ($MILLION)
- FIGURE 32. INDIA N-BROMOSUCCINIMIDE MARKET, 2022-2032 ($MILLION)
- FIGURE 33. JAPAN N-BROMOSUCCINIMIDE MARKET, 2022-2032 ($MILLION)
- FIGURE 34. SOUTH KOREA N-BROMOSUCCINIMIDE MARKET, 2022-2032 ($MILLION)
- FIGURE 35. AUSTRALIA N-BROMOSUCCINIMIDE MARKET, 2022-2032 ($MILLION)
- FIGURE 36. REST OF ASIA-PACIFIC N-BROMOSUCCINIMIDE MARKET, 2022-2032 ($MILLION)
- FIGURE 37. BRAZIL N-BROMOSUCCINIMIDE MARKET, 2022-2032 ($MILLION)
- FIGURE 38. SOUTH AFRICA N-BROMOSUCCINIMIDE MARKET, 2022-2032 ($MILLION)
- FIGURE 39. SAUDI ARABI N-BROMOSUCCINIMIDE MARKET, 2022-2032 ($MILLION)
- FIGURE 40. REST OF LAMEA N-BROMOSUCCINIMIDE MARKET, 2022-2032 ($MILLION)
- FIGURE 41. TOP WINNING STRATEGIES, BY YEAR
- FIGURE 42. TOP WINNING STRATEGIES, BY DEVELOPMENT
- FIGURE 43. TOP WINNING STRATEGIES, BY COMPANY
- FIGURE 44. PRODUCT MAPPING OF TOP 10 PLAYERS
- FIGURE 45. COMPETITIVE DASHBOARD
- FIGURE 46. COMPETITIVE HEATMAP: N-BROMOSUCCINIMIDE MARKET
- FIGURE 47. TOP PLAYER POSITIONING, 2022
 全球癒创木酚市场规模研究,按应用、最终用途产业、形式、来源和区域预测 2022-2032
 乙醛肟市场:按形式、纯度、应用、最终用户行业、製造工艺划分 - 2025-2030 年全球预测穿心莲内酯市场:依产品类型、应用、最终用户、销售管道- 2025-2030 年全球预测
 2024 - 2031 年全球N-溴代琥珀酰亚胺市场规模、份额及趋势分析报告(按含量(含量99% 及含量98%)、按应用(製药业、农药业等)、按区域展望及预测)
 N-溴代琥珀酰亚胺市场,按内容、按应用、按最终用户、按国家和地区划分 - 2024-2032 年行业分析、市场规模、市场份额和预测