


 |
市场调查报告书
商品编码
1472404
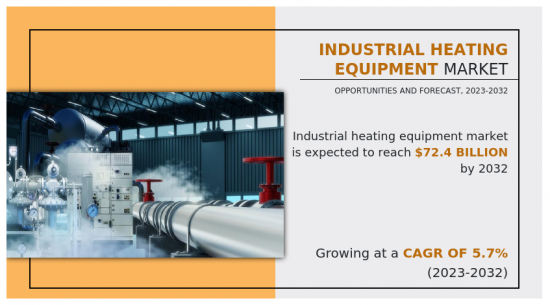
工业加热设备市场:依产品类型、燃料类型、最终用户产业:2023-2032 年全球机会分析与产业预测Industrial Heating Equipment Market By Product Type, By Fuel Type, By End-User Industry : Global Opportunity Analysis and Industry Forecast, 2023-2032 |
||||||
工业加热设备包括用于在各种工业过程中产生和控制热量的各种机器,包括化学製造、石油和气体纯化、食品和饮料生产、发电和金属加工。这个市场频谱的加热需求,提供诸如用于产生用于加热应用的蒸气的工业锅炉、用于金属熔化等高温工艺的熔炉以及用于更节能的加热和冷却的热泵等设备。除了核心设备外,市场还包括必要的组件,例如确保精确温度调节和满足行业标准的安全功能的控制系统。随着对高效和永续工业流程的需求不断增加,市场见证了电加热和感应加热等技术的进步,为传统燃料系统提供了更清洁、更可控的替代方案。这个充满活力的市场在确保各行业的平稳运作方面发挥着关键作用,并且不断发展以满足对能源效率、环境友善和流程优化日益增长的需求。
出于分析目的,全球工业加热设备市场范围涵盖基于产品类型、燃料类型、最终用户产业和地区的细分。该报告提供了热泵、熔炉和锅炉等各类工业加热设备的资讯。它还涵盖了不同燃料类型的详细信息,包括石化燃料和电力。此外,石油和天然气、金属和采矿、化学品等也被列为主要最终用户产业。此外,还分析了北美、欧洲、亚太地区和拉丁美洲地区等不同地区工业加热设备的当前市场趋势,并提出了未来的成长机会。
报告中讨论了市场驱动因素、限制因素和市场机会,以便更好地了解市场动态。报告也强调了重点投资领域。它还包括波特的五力分析,以了解工业加热设备行业的竞争场景以及每个相关人员的角色。
本报告介绍了主要市场参与者为维持市场立足点所采取的策略。此外,它还凸显了主要企业扩大市场占有率、维持产业激烈竞争的竞争格局。
相关人员的主要利益
- 本报告对2022年至2032年工业加热设备市场分析的细分市场、当前趋势、估计/趋势分析和动态进行了定量分析,并确定了工业加热设备市场有前景的市场机会。
- 我们提供市场研究以及与市场驱动因素、市场限制和市场机会相关的资讯。
- 波特的五力分析强调买家和供应商帮助相关人员做出利润驱动的商业决策并加强供应商-买家网路的力量。
- 对工业加热设备市场细分的详细分析有助于识别市场机会。
- 每个地区的主要国家都根据其对全球市场的收益贡献绘製了地图。
- 市场参与者定位有助于基准化分析,并提供对市场参与者当前地位的清晰了解。
- 该报告包括对区域和全球工业加热设备市场趋势、主要企业、细分市场、应用领域和市场成长策略的分析。
可以使用此报告进行客製化(需要额外费用和时间表)
- 供应链分析与供应商利润
- 新产品开发/主要企业产品矩阵
- 根据客户兴趣新增其他公司简介
目录
第一章简介
第 2 章执行摘要
第三章市场概况
- 市场定义和范围
- 主要发现
- 影响因素
- 主要投资机会
- 波特五力分析
- 市场动态
- 促进因素
- 各种最终用途产业对蒸气锅炉的需求不断增加
- 加大投资增加发电能力
- 抑制因素
- 执行严格的政府法规防治环境污染
- 机会
- 地源热泵技术的普及
- 促进因素
- 价值链分析
- 微笑曲线价值链模型
第四章工业加热设备市场:依产品类型
- 概述
- 热泵
- 炉
- 锅炉
第五章工业加热设备市场:依燃料类型
- 概述
- 石化燃料
- 电
第六章工业加热设备市场:依最终用户产业
- 概述
- 油和气
- 金属/矿业
- 化学
- 其他的
第七章工业加热设备市场:依地区
- 概述
- 北美洲
- 美国
- 加拿大
- 墨西哥
- 欧洲
- 德国
- 英国
- 法国
- 西班牙
- 其他的
- 亚太地区
- 中国
- 日本
- 韩国
- 印度
- 其他的
- 拉丁美洲
- 拉丁美洲
- 中东
- 非洲
第八章 竞争格局
- 介绍
- 关键成功策略
- 10家主要企业产品图谱
- 竞争对手仪表板
- 竞争热图
- 2022年主要企业定位
第九章 公司简介
- Carrier
- Danfoss A/S
- EASCO BOILER CORP
- Emerson Electric Co.
- Ingersoll Rand Inc.
- Johnson Controls
- Lennox International Inc.
- McKenna Boiler Works Inc.
- THERMCRAFT, INC.(AECO Corp.)
- Uponor Corporation
Industrial heating equipment include a diverse range of machinery used for generating and controlling heat in various industrial processes, including chemical manufacturing, oil & gas refining, food & beverage production, power generation, and metal fabrication. The market caters to a spectrum of heating needs, offering equipment like industrial boilers that produce steam for heating applications, furnaces for high-temperature processes like metal melting, and heat pumps for more energy-efficient heating and cooling. Beyond the core equipment, the market includes essential components like control systems ensuring precise temperature regulation and safety features that meet industry standards. As the demand for efficient and sustainable industrial processes grows, the market witnesses advancements in technologies like electric and induction heating, offering cleaner and more controllable alternatives to traditional fuel-based systems. This dynamic market plays a crucial role in ensuring smooth operation of various industries and is continuously evolving to meet the increasing demand for energy efficiency, environmental considerations, and process optimization.
For the purpose of analysis, the global industrial heating equipment market scope covers segmentation based on product type, fuel type, end-user industry, and region. The report provides information about various types of industrial heating equipment such as heat pumps, furnaces, and boilers. In addition, the study covers details about different fuels types, including fossil fuel and electric. Furthermore, oil & gas, metal & mining, chemical, and others are the key end-user industries detailed in the report. Moreover, it analyzes the current market trends of industrial heating equipment across different regions such as North America, Europe, Asia-Pacific, and LAMEA and suggests the future growth opportunities.
The growth drivers, restraints, and opportunities are explained in the report to better understand the market dynamics. This report further highlights the key areas of investment. In addition, it includes Porter's five forces analysis to understand the competitive scenario of the industrial heating equipment industry and role of each stakeholder.
The report features the strategies adopted by key market players to maintain their foothold in the market. Furthermore, it highlights the competitive landscape of the key players to increase their market share and sustain intense competition in the industry.
Competitive analysis and profiles of the major players such as Carrier, Easco Boiler Corp., Emerson Electric Co., Ingersoll Rand Inc., Johnson Controls, Inc., Lennox International Inc., McKenna Boiler Works Inc., The Danfoss Group, Thermcraft, Inc., and Uponor Corporation have been provided in the report.For instance, in November 2023, Johnson Controls received a $33 million grant from the U.S. Department of Energy's (DOE) Office of Manufacturing and Energy Supply Chains to help increase domestic production of electric heat pumps by expanding three U.S.-based manufacturing sites. The new plants produce an estimated 200,000 residential, commercial, and industrial heat pumps combined-a production increase of 200%.
Key Benefits For Stakeholders
- This report provides a quantitative analysis of the market segments, current trends, estimations, and dynamics of the industrial heating equipment market analysis from 2022 to 2032 to identify the prevailing industrial heating equipment market opportunities.
- The market research is offered along with information related to key drivers, restraints, and opportunities.
- Porter's five forces analysis highlights the potency of buyers and suppliers to enable stakeholders make profit-oriented business decisions and strengthen their supplier-buyer network.
- In-depth analysis of the industrial heating equipment market segmentation assists to determine the prevailing market opportunities.
- Major countries in each region are mapped according to their revenue contribution to the global market.
- Market player positioning facilitates benchmarking and provides a clear understanding of the present position of the market players.
- The report includes the analysis of the regional as well as global industrial heating equipment market trends, key players, market segments, application areas, and market growth strategies.
Additional benefits you will get with this purchase are:
- Quarterly Update and* (only available with a corporate license, on listed price)
- 5 additional Company Profile of client Choice pre- or Post-purchase, as a free update.
- Free Upcoming Version on the Purchase of Five and Enterprise User License.
- 16 analyst hours of support* (post-purchase, if you find additional data requirements upon review of the report, you may receive support amounting to 16 analyst hours to solve questions, and post-sale queries)
- 15% Free Customization* (in case the scope or segment of the report does not match your requirements, 15% is equivalent to 3 working days of free work, applicable once)
- Free data Pack on the Five and Enterprise User License. (Excel version of the report)
- Free Updated report if the report is 6-12 months old or older.
- 24-hour priority response*
- Free Industry updates and white papers.
Possible Customization with this report (with additional cost and timeline, please talk to the sales executive to know more)
- Supply Chain Analysis & Vendor Margins
- New Product Development/ Product Matrix of Key Players
- Additional company profiles with specific to client's interest
Key Market Segments
By End-User Industry
- Oil and gas
- Metal and mining
- Chemical
- Others
By Product Type
- Heat pumps
- Furnaces
- Boilers
By Fuel Type
- Fossil fuel
- Electric
By Region
- North America
- U.S.
- Canada
- Mexico
- Europe
- Germany
- UK
- France
- Spain
- Rest of Europe
- Asia-Pacific
- China
- Japan
- South Korea
- India
- Rest of Asia-Pacific
- LAMEA
- Latin America
- Middle East
- Africa
Key Market Players:
- Danfoss A/S
- Ingersoll Rand Inc.
- Johnson Controls
- EASCO BOILER CORP
- Carrier
- THERMCRAFT, INC. (AECO Corp.)
- Uponor Corporation
- Emerson Electric Co.
- Lennox International Inc.
- McKenna Boiler Works Inc.
TABLE OF CONTENTS
CHAPTER 1: INTRODUCTION
- 1.1. Report description
- 1.2. Key market segments
- 1.3. Key benefits to the stakeholders
- 1.4. Research methodology
- 1.4.1. Primary research
- 1.4.2. Secondary research
- 1.4.3. Analyst tools and models
CHAPTER 2: EXECUTIVE SUMMARY
- 2.1. CXO perspective
CHAPTER 3: MARKET OVERVIEW
- 3.1. Market definition and scope
- 3.2. Key findings
- 3.2.1. Top impacting factors
- 3.2.2. Top investment pockets
- 3.3. Porter's five forces analysis
- 3.3.1. Moderate to high bargaining power of suppliers
- 3.3.2. Moderate to high threat of new entrants
- 3.3.3. Low to moderate threat of substitutes
- 3.3.4. Low intensity of rivalry
- 3.3.5. Low bargaining power of buyers
- 3.4. Market dynamics
- 3.4.1. Drivers
- 3.4.1.1. Rise in demand for steam boilers from various end-use industries
- 3.4.1.2. Increase in investment toward adding power generation capacity
- 3.4.2. Restraints
- 3.4.2.1. Implementation of stringent government regulations toward environmental pollution
- 3.4.3. Opportunities
- 3.4.3.1. Increase in popularity of geothermal heat pump technology
- 3.4.1. Drivers
- 3.5. Value Chain Analysis
- 3.6. Smiling Curve Value Chain Model
CHAPTER 4: INDUSTRIAL HEATING EQUIPMENT MARKET, BY PRODUCT TYPE
- 4.1. Overview
- 4.1.1. Market size and forecast
- 4.2. Heat pumps
- 4.2.1. Key market trends, growth factors and opportunities
- 4.2.2. Market size and forecast, by region
- 4.2.3. Market share analysis by country
- 4.3. Furnaces
- 4.3.1. Key market trends, growth factors and opportunities
- 4.3.2. Market size and forecast, by region
- 4.3.3. Market share analysis by country
- 4.4. Boilers
- 4.4.1. Key market trends, growth factors and opportunities
- 4.4.2. Market size and forecast, by region
- 4.4.3. Market share analysis by country
CHAPTER 5: INDUSTRIAL HEATING EQUIPMENT MARKET, BY FUEL TYPE
- 5.1. Overview
- 5.1.1. Market size and forecast
- 5.2. Fossil fuel
- 5.2.1. Key market trends, growth factors and opportunities
- 5.2.2. Market size and forecast, by region
- 5.2.3. Market share analysis by country
- 5.3. Electric
- 5.3.1. Key market trends, growth factors and opportunities
- 5.3.2. Market size and forecast, by region
- 5.3.3. Market share analysis by country
CHAPTER 6: INDUSTRIAL HEATING EQUIPMENT MARKET, BY END-USER INDUSTRY
- 6.1. Overview
- 6.1.1. Market size and forecast
- 6.2. Oil and gas
- 6.2.1. Key market trends, growth factors and opportunities
- 6.2.2. Market size and forecast, by region
- 6.2.3. Market share analysis by country
- 6.3. Metal and mining
- 6.3.1. Key market trends, growth factors and opportunities
- 6.3.2. Market size and forecast, by region
- 6.3.3. Market share analysis by country
- 6.4. Chemical
- 6.4.1. Key market trends, growth factors and opportunities
- 6.4.2. Market size and forecast, by region
- 6.4.3. Market share analysis by country
- 6.5. Others
- 6.5.1. Key market trends, growth factors and opportunities
- 6.5.2. Market size and forecast, by region
- 6.5.3. Market share analysis by country
CHAPTER 7: INDUSTRIAL HEATING EQUIPMENT MARKET, BY REGION
- 7.1. Overview
- 7.1.1. Market size and forecast By Region
- 7.2. North America
- 7.2.1. Key market trends, growth factors and opportunities
- 7.2.2. Market size and forecast, by Product Type
- 7.2.3. Market size and forecast, by Fuel Type
- 7.2.4. Market size and forecast, by End-User Industry
- 7.2.5. Market size and forecast, by country
- 7.2.5.1. U.S.
- 7.2.5.1.1. Market size and forecast, by Product Type
- 7.2.5.1.2. Market size and forecast, by Fuel Type
- 7.2.5.1.3. Market size and forecast, by End-User Industry
- 7.2.5.2. Canada
- 7.2.5.2.1. Market size and forecast, by Product Type
- 7.2.5.2.2. Market size and forecast, by Fuel Type
- 7.2.5.2.3. Market size and forecast, by End-User Industry
- 7.2.5.3. Mexico
- 7.2.5.3.1. Market size and forecast, by Product Type
- 7.2.5.3.2. Market size and forecast, by Fuel Type
- 7.2.5.3.3. Market size and forecast, by End-User Industry
- 7.3. Europe
- 7.3.1. Key market trends, growth factors and opportunities
- 7.3.2. Market size and forecast, by Product Type
- 7.3.3. Market size and forecast, by Fuel Type
- 7.3.4. Market size and forecast, by End-User Industry
- 7.3.5. Market size and forecast, by country
- 7.3.5.1. Germany
- 7.3.5.1.1. Market size and forecast, by Product Type
- 7.3.5.1.2. Market size and forecast, by Fuel Type
- 7.3.5.1.3. Market size and forecast, by End-User Industry
- 7.3.5.2. UK
- 7.3.5.2.1. Market size and forecast, by Product Type
- 7.3.5.2.2. Market size and forecast, by Fuel Type
- 7.3.5.2.3. Market size and forecast, by End-User Industry
- 7.3.5.3. France
- 7.3.5.3.1. Market size and forecast, by Product Type
- 7.3.5.3.2. Market size and forecast, by Fuel Type
- 7.3.5.3.3. Market size and forecast, by End-User Industry
- 7.3.5.4. Spain
- 7.3.5.4.1. Market size and forecast, by Product Type
- 7.3.5.4.2. Market size and forecast, by Fuel Type
- 7.3.5.4.3. Market size and forecast, by End-User Industry
- 7.3.5.5. Rest of Europe
- 7.3.5.5.1. Market size and forecast, by Product Type
- 7.3.5.5.2. Market size and forecast, by Fuel Type
- 7.3.5.5.3. Market size and forecast, by End-User Industry
- 7.4. Asia-Pacific
- 7.4.1. Key market trends, growth factors and opportunities
- 7.4.2. Market size and forecast, by Product Type
- 7.4.3. Market size and forecast, by Fuel Type
- 7.4.4. Market size and forecast, by End-User Industry
- 7.4.5. Market size and forecast, by country
- 7.4.5.1. China
- 7.4.5.1.1. Market size and forecast, by Product Type
- 7.4.5.1.2. Market size and forecast, by Fuel Type
- 7.4.5.1.3. Market size and forecast, by End-User Industry
- 7.4.5.2. Japan
- 7.4.5.2.1. Market size and forecast, by Product Type
- 7.4.5.2.2. Market size and forecast, by Fuel Type
- 7.4.5.2.3. Market size and forecast, by End-User Industry
- 7.4.5.3. South Korea
- 7.4.5.3.1. Market size and forecast, by Product Type
- 7.4.5.3.2. Market size and forecast, by Fuel Type
- 7.4.5.3.3. Market size and forecast, by End-User Industry
- 7.4.5.4. India
- 7.4.5.4.1. Market size and forecast, by Product Type
- 7.4.5.4.2. Market size and forecast, by Fuel Type
- 7.4.5.4.3. Market size and forecast, by End-User Industry
- 7.4.5.5. Rest of Asia-Pacific
- 7.4.5.5.1. Market size and forecast, by Product Type
- 7.4.5.5.2. Market size and forecast, by Fuel Type
- 7.4.5.5.3. Market size and forecast, by End-User Industry
- 7.5. LAMEA
- 7.5.1. Key market trends, growth factors and opportunities
- 7.5.2. Market size and forecast, by Product Type
- 7.5.3. Market size and forecast, by Fuel Type
- 7.5.4. Market size and forecast, by End-User Industry
- 7.5.5. Market size and forecast, by country
- 7.5.5.1. Latin America
- 7.5.5.1.1. Market size and forecast, by Product Type
- 7.5.5.1.2. Market size and forecast, by Fuel Type
- 7.5.5.1.3. Market size and forecast, by End-User Industry
- 7.5.5.2. Middle East
- 7.5.5.2.1. Market size and forecast, by Product Type
- 7.5.5.2.2. Market size and forecast, by Fuel Type
- 7.5.5.2.3. Market size and forecast, by End-User Industry
- 7.5.5.3. Africa
- 7.5.5.3.1. Market size and forecast, by Product Type
- 7.5.5.3.2. Market size and forecast, by Fuel Type
- 7.5.5.3.3. Market size and forecast, by End-User Industry
CHAPTER 8: COMPETITIVE LANDSCAPE
- 8.1. Introduction
- 8.2. Top winning strategies
- 8.3. Product mapping of top 10 player
- 8.4. Competitive dashboard
- 8.5. Competitive heatmap
- 8.6. Top player positioning, 2022
CHAPTER 9: COMPANY PROFILES
- 9.1. Carrier
- 9.1.1. Company overview
- 9.1.2. Key executives
- 9.1.3. Company snapshot
- 9.1.4. Operating business segments
- 9.1.5. Product portfolio
- 9.1.6. Business performance
- 9.1.7. Key strategic moves and developments
- 9.2. Danfoss A/S
- 9.2.1. Company overview
- 9.2.2. Key executives
- 9.2.3. Company snapshot
- 9.2.4. Operating business segments
- 9.2.5. Product portfolio
- 9.2.6. Business performance
- 9.3. EASCO BOILER CORP
- 9.3.1. Company overview
- 9.3.2. Key executives
- 9.3.3. Company snapshot
- 9.3.4. Operating business segments
- 9.3.5. Product portfolio
- 9.4. Emerson Electric Co.
- 9.4.1. Company overview
- 9.4.2. Key executives
- 9.4.3. Company snapshot
- 9.4.4. Operating business segments
- 9.4.5. Product portfolio
- 9.4.6. Business performance
- 9.5. Ingersoll Rand Inc.
- 9.5.1. Company overview
- 9.5.2. Key executives
- 9.5.3. Company snapshot
- 9.5.4. Operating business segments
- 9.5.5. Product portfolio
- 9.5.6. Business performance
- 9.5.7. Key strategic moves and developments
- 9.6. Johnson Controls
- 9.6.1. Company overview
- 9.6.2. Key executives
- 9.6.3. Company snapshot
- 9.6.4. Operating business segments
- 9.6.5. Product portfolio
- 9.6.6. Business performance
- 9.6.7. Key strategic moves and developments
- 9.7. Lennox International Inc.
- 9.7.1. Company overview
- 9.7.2. Key executives
- 9.7.3. Company snapshot
- 9.7.4. Operating business segments
- 9.7.5. Product portfolio
- 9.7.6. Business performance
- 9.7.7. Key strategic moves and developments
- 9.8. McKenna Boiler Works Inc.
- 9.8.1. Company overview
- 9.8.2. Key executives
- 9.8.3. Company snapshot
- 9.8.4. Operating business segments
- 9.8.5. Product portfolio
- 9.9. THERMCRAFT, INC. (AECO Corp.)
- 9.9.1. Company overview
- 9.9.2. Key executives
- 9.9.3. Company snapshot
- 9.9.4. Operating business segments
- 9.9.5. Product portfolio
- 9.10. Uponor Corporation
- 9.10.1. Company overview
- 9.10.2. Key executives
- 9.10.3. Company snapshot
- 9.10.4. Operating business segments
- 9.10.5. Product portfolio
- 9.10.6. Business performance
LIST OF TABLES
- TABLE 01. GLOBAL INDUSTRIAL HEATING EQUIPMENT MARKET, BY PRODUCT TYPE, 2022-2032 ($MILLION)
- TABLE 02. INDUSTRIAL HEATING EQUIPMENT MARKET FOR HEAT PUMPS, BY REGION, 2022-2032 ($MILLION)
- TABLE 03. INDUSTRIAL HEATING EQUIPMENT MARKET FOR FURNACES, BY REGION, 2022-2032 ($MILLION)
- TABLE 04. INDUSTRIAL HEATING EQUIPMENT MARKET FOR BOILERS, BY REGION, 2022-2032 ($MILLION)
- TABLE 05. GLOBAL INDUSTRIAL HEATING EQUIPMENT MARKET, BY FUEL TYPE, 2022-2032 ($MILLION)
- TABLE 06. INDUSTRIAL HEATING EQUIPMENT MARKET FOR FOSSIL FUEL, BY REGION, 2022-2032 ($MILLION)
- TABLE 07. INDUSTRIAL HEATING EQUIPMENT MARKET FOR ELECTRIC, BY REGION, 2022-2032 ($MILLION)
- TABLE 08. GLOBAL INDUSTRIAL HEATING EQUIPMENT MARKET, BY END-USER INDUSTRY, 2022-2032 ($MILLION)
- TABLE 09. INDUSTRIAL HEATING EQUIPMENT MARKET FOR OIL AND GAS, BY REGION, 2022-2032 ($MILLION)
- TABLE 10. INDUSTRIAL HEATING EQUIPMENT MARKET FOR METAL AND MINING, BY REGION, 2022-2032 ($MILLION)
- TABLE 11. INDUSTRIAL HEATING EQUIPMENT MARKET FOR CHEMICAL, BY REGION, 2022-2032 ($MILLION)
- TABLE 12. INDUSTRIAL HEATING EQUIPMENT MARKET FOR OTHERS, BY REGION, 2022-2032 ($MILLION)
- TABLE 13. INDUSTRIAL HEATING EQUIPMENT MARKET, BY REGION, 2022-2032 ($MILLION)
- TABLE 14. NORTH AMERICA INDUSTRIAL HEATING EQUIPMENT MARKET, BY PRODUCT TYPE, 2022-2032 ($MILLION)
- TABLE 15. NORTH AMERICA INDUSTRIAL HEATING EQUIPMENT MARKET, BY FUEL TYPE, 2022-2032 ($MILLION)
- TABLE 16. NORTH AMERICA INDUSTRIAL HEATING EQUIPMENT MARKET, BY END-USER INDUSTRY, 2022-2032 ($MILLION)
- TABLE 17. NORTH AMERICA INDUSTRIAL HEATING EQUIPMENT MARKET, BY COUNTRY, 2022-2032 ($MILLION)
- TABLE 18. U.S. INDUSTRIAL HEATING EQUIPMENT MARKET, BY PRODUCT TYPE, 2022-2032 ($MILLION)
- TABLE 19. U.S. INDUSTRIAL HEATING EQUIPMENT MARKET, BY FUEL TYPE, 2022-2032 ($MILLION)
- TABLE 20. U.S. INDUSTRIAL HEATING EQUIPMENT MARKET, BY END-USER INDUSTRY, 2022-2032 ($MILLION)
- TABLE 21. CANADA INDUSTRIAL HEATING EQUIPMENT MARKET, BY PRODUCT TYPE, 2022-2032 ($MILLION)
- TABLE 22. CANADA INDUSTRIAL HEATING EQUIPMENT MARKET, BY FUEL TYPE, 2022-2032 ($MILLION)
- TABLE 23. CANADA INDUSTRIAL HEATING EQUIPMENT MARKET, BY END-USER INDUSTRY, 2022-2032 ($MILLION)
- TABLE 24. MEXICO INDUSTRIAL HEATING EQUIPMENT MARKET, BY PRODUCT TYPE, 2022-2032 ($MILLION)
- TABLE 25. MEXICO INDUSTRIAL HEATING EQUIPMENT MARKET, BY FUEL TYPE, 2022-2032 ($MILLION)
- TABLE 26. MEXICO INDUSTRIAL HEATING EQUIPMENT MARKET, BY END-USER INDUSTRY, 2022-2032 ($MILLION)
- TABLE 27. EUROPE INDUSTRIAL HEATING EQUIPMENT MARKET, BY PRODUCT TYPE, 2022-2032 ($MILLION)
- TABLE 28. EUROPE INDUSTRIAL HEATING EQUIPMENT MARKET, BY FUEL TYPE, 2022-2032 ($MILLION)
- TABLE 29. EUROPE INDUSTRIAL HEATING EQUIPMENT MARKET, BY END-USER INDUSTRY, 2022-2032 ($MILLION)
- TABLE 30. EUROPE INDUSTRIAL HEATING EQUIPMENT MARKET, BY COUNTRY, 2022-2032 ($MILLION)
- TABLE 31. GERMANY INDUSTRIAL HEATING EQUIPMENT MARKET, BY PRODUCT TYPE, 2022-2032 ($MILLION)
- TABLE 32. GERMANY INDUSTRIAL HEATING EQUIPMENT MARKET, BY FUEL TYPE, 2022-2032 ($MILLION)
- TABLE 33. GERMANY INDUSTRIAL HEATING EQUIPMENT MARKET, BY END-USER INDUSTRY, 2022-2032 ($MILLION)
- TABLE 34. UK INDUSTRIAL HEATING EQUIPMENT MARKET, BY PRODUCT TYPE, 2022-2032 ($MILLION)
- TABLE 35. UK INDUSTRIAL HEATING EQUIPMENT MARKET, BY FUEL TYPE, 2022-2032 ($MILLION)
- TABLE 36. UK INDUSTRIAL HEATING EQUIPMENT MARKET, BY END-USER INDUSTRY, 2022-2032 ($MILLION)
- TABLE 37. FRANCE INDUSTRIAL HEATING EQUIPMENT MARKET, BY PRODUCT TYPE, 2022-2032 ($MILLION)
- TABLE 38. FRANCE INDUSTRIAL HEATING EQUIPMENT MARKET, BY FUEL TYPE, 2022-2032 ($MILLION)
- TABLE 39. FRANCE INDUSTRIAL HEATING EQUIPMENT MARKET, BY END-USER INDUSTRY, 2022-2032 ($MILLION)
- TABLE 40. SPAIN INDUSTRIAL HEATING EQUIPMENT MARKET, BY PRODUCT TYPE, 2022-2032 ($MILLION)
- TABLE 41. SPAIN INDUSTRIAL HEATING EQUIPMENT MARKET, BY FUEL TYPE, 2022-2032 ($MILLION)
- TABLE 42. SPAIN INDUSTRIAL HEATING EQUIPMENT MARKET, BY END-USER INDUSTRY, 2022-2032 ($MILLION)
- TABLE 43. REST OF EUROPE INDUSTRIAL HEATING EQUIPMENT MARKET, BY PRODUCT TYPE, 2022-2032 ($MILLION)
- TABLE 44. REST OF EUROPE INDUSTRIAL HEATING EQUIPMENT MARKET, BY FUEL TYPE, 2022-2032 ($MILLION)
- TABLE 45. REST OF EUROPE INDUSTRIAL HEATING EQUIPMENT MARKET, BY END-USER INDUSTRY, 2022-2032 ($MILLION)
- TABLE 46. ASIA-PACIFIC INDUSTRIAL HEATING EQUIPMENT MARKET, BY PRODUCT TYPE, 2022-2032 ($MILLION)
- TABLE 47. ASIA-PACIFIC INDUSTRIAL HEATING EQUIPMENT MARKET, BY FUEL TYPE, 2022-2032 ($MILLION)
- TABLE 48. ASIA-PACIFIC INDUSTRIAL HEATING EQUIPMENT MARKET, BY END-USER INDUSTRY, 2022-2032 ($MILLION)
- TABLE 49. ASIA-PACIFIC INDUSTRIAL HEATING EQUIPMENT MARKET, BY COUNTRY, 2022-2032 ($MILLION)
- TABLE 50. CHINA INDUSTRIAL HEATING EQUIPMENT MARKET, BY PRODUCT TYPE, 2022-2032 ($MILLION)
- TABLE 51. CHINA INDUSTRIAL HEATING EQUIPMENT MARKET, BY FUEL TYPE, 2022-2032 ($MILLION)
- TABLE 52. CHINA INDUSTRIAL HEATING EQUIPMENT MARKET, BY END-USER INDUSTRY, 2022-2032 ($MILLION)
- TABLE 53. JAPAN INDUSTRIAL HEATING EQUIPMENT MARKET, BY PRODUCT TYPE, 2022-2032 ($MILLION)
- TABLE 54. JAPAN INDUSTRIAL HEATING EQUIPMENT MARKET, BY FUEL TYPE, 2022-2032 ($MILLION)
- TABLE 55. JAPAN INDUSTRIAL HEATING EQUIPMENT MARKET, BY END-USER INDUSTRY, 2022-2032 ($MILLION)
- TABLE 56. SOUTH KOREA INDUSTRIAL HEATING EQUIPMENT MARKET, BY PRODUCT TYPE, 2022-2032 ($MILLION)
- TABLE 57. SOUTH KOREA INDUSTRIAL HEATING EQUIPMENT MARKET, BY FUEL TYPE, 2022-2032 ($MILLION)
- TABLE 58. SOUTH KOREA INDUSTRIAL HEATING EQUIPMENT MARKET, BY END-USER INDUSTRY, 2022-2032 ($MILLION)
- TABLE 59. INDIA INDUSTRIAL HEATING EQUIPMENT MARKET, BY PRODUCT TYPE, 2022-2032 ($MILLION)
- TABLE 60. INDIA INDUSTRIAL HEATING EQUIPMENT MARKET, BY FUEL TYPE, 2022-2032 ($MILLION)
- TABLE 61. INDIA INDUSTRIAL HEATING EQUIPMENT MARKET, BY END-USER INDUSTRY, 2022-2032 ($MILLION)
- TABLE 62. REST OF ASIA-PACIFIC INDUSTRIAL HEATING EQUIPMENT MARKET, BY PRODUCT TYPE, 2022-2032 ($MILLION)
- TABLE 63. REST OF ASIA-PACIFIC INDUSTRIAL HEATING EQUIPMENT MARKET, BY FUEL TYPE, 2022-2032 ($MILLION)
- TABLE 64. REST OF ASIA-PACIFIC INDUSTRIAL HEATING EQUIPMENT MARKET, BY END-USER INDUSTRY, 2022-2032 ($MILLION)
- TABLE 65. LAMEA INDUSTRIAL HEATING EQUIPMENT MARKET, BY PRODUCT TYPE, 2022-2032 ($MILLION)
- TABLE 66. LAMEA INDUSTRIAL HEATING EQUIPMENT MARKET, BY FUEL TYPE, 2022-2032 ($MILLION)
- TABLE 67. LAMEA INDUSTRIAL HEATING EQUIPMENT MARKET, BY END-USER INDUSTRY, 2022-2032 ($MILLION)
- TABLE 68. LAMEA INDUSTRIAL HEATING EQUIPMENT MARKET, BY COUNTRY, 2022-2032 ($MILLION)
- TABLE 69. LATIN AMERICA INDUSTRIAL HEATING EQUIPMENT MARKET, BY PRODUCT TYPE, 2022-2032 ($MILLION)
- TABLE 70. LATIN AMERICA INDUSTRIAL HEATING EQUIPMENT MARKET, BY FUEL TYPE, 2022-2032 ($MILLION)
- TABLE 71. LATIN AMERICA INDUSTRIAL HEATING EQUIPMENT MARKET, BY END-USER INDUSTRY, 2022-2032 ($MILLION)
- TABLE 72. MIDDLE EAST INDUSTRIAL HEATING EQUIPMENT MARKET, BY PRODUCT TYPE, 2022-2032 ($MILLION)
- TABLE 73. MIDDLE EAST INDUSTRIAL HEATING EQUIPMENT MARKET, BY FUEL TYPE, 2022-2032 ($MILLION)
- TABLE 74. MIDDLE EAST INDUSTRIAL HEATING EQUIPMENT MARKET, BY END-USER INDUSTRY, 2022-2032 ($MILLION)
- TABLE 75. AFRICA INDUSTRIAL HEATING EQUIPMENT MARKET, BY PRODUCT TYPE, 2022-2032 ($MILLION)
- TABLE 76. AFRICA INDUSTRIAL HEATING EQUIPMENT MARKET, BY FUEL TYPE, 2022-2032 ($MILLION)
- TABLE 77. AFRICA INDUSTRIAL HEATING EQUIPMENT MARKET, BY END-USER INDUSTRY, 2022-2032 ($MILLION)
- TABLE 78. CARRIER: KEY EXECUTIVES
- TABLE 79. CARRIER: COMPANY SNAPSHOT
- TABLE 80. CARRIER: PRODUCT SEGMENTS
- TABLE 81. CARRIER: PRODUCT PORTFOLIO
- TABLE 82. CARRIER: KEY STRATERGIES
- TABLE 83. DANFOSS A/S: KEY EXECUTIVES
- TABLE 84. DANFOSS A/S: COMPANY SNAPSHOT
- TABLE 85. DANFOSS A/S: PRODUCT SEGMENTS
- TABLE 86. DANFOSS A/S: PRODUCT PORTFOLIO
- TABLE 87. EASCO BOILER CORP: KEY EXECUTIVES
- TABLE 88. EASCO BOILER CORP: COMPANY SNAPSHOT
- TABLE 89. EASCO BOILER CORP: PRODUCT SEGMENTS
- TABLE 90. EASCO BOILER CORP: PRODUCT PORTFOLIO
- TABLE 91. EMERSON ELECTRIC CO.: KEY EXECUTIVES
- TABLE 92. EMERSON ELECTRIC CO.: COMPANY SNAPSHOT
- TABLE 93. EMERSON ELECTRIC CO.: PRODUCT SEGMENTS
- TABLE 94. EMERSON ELECTRIC CO.: PRODUCT PORTFOLIO
- TABLE 95. INGERSOLL RAND INC.: KEY EXECUTIVES
- TABLE 96. INGERSOLL RAND INC.: COMPANY SNAPSHOT
- TABLE 97. INGERSOLL RAND INC.: PRODUCT SEGMENTS
- TABLE 98. INGERSOLL RAND INC.: PRODUCT PORTFOLIO
- TABLE 99. INGERSOLL RAND INC.: KEY STRATERGIES
- TABLE 100. JOHNSON CONTROLS: KEY EXECUTIVES
- TABLE 101. JOHNSON CONTROLS: COMPANY SNAPSHOT
- TABLE 102. JOHNSON CONTROLS: PRODUCT SEGMENTS
- TABLE 103. JOHNSON CONTROLS: PRODUCT PORTFOLIO
- TABLE 104. JOHNSON CONTROLS: KEY STRATERGIES
- TABLE 105. LENNOX INTERNATIONAL INC.: KEY EXECUTIVES
- TABLE 106. LENNOX INTERNATIONAL INC.: COMPANY SNAPSHOT
- TABLE 107. LENNOX INTERNATIONAL INC.: PRODUCT SEGMENTS
- TABLE 108. LENNOX INTERNATIONAL INC.: PRODUCT PORTFOLIO
- TABLE 109. LENNOX INTERNATIONAL INC.: KEY STRATERGIES
- TABLE 110. MCKENNA BOILER WORKS INC.: KEY EXECUTIVES
- TABLE 111. MCKENNA BOILER WORKS INC.: COMPANY SNAPSHOT
- TABLE 112. MCKENNA BOILER WORKS INC.: PRODUCT SEGMENTS
- TABLE 113. MCKENNA BOILER WORKS INC.: PRODUCT PORTFOLIO
- TABLE 114. THERMCRAFT, INC. (AECO CORP.): KEY EXECUTIVES
- TABLE 115. THERMCRAFT, INC. (AECO CORP.): COMPANY SNAPSHOT
- TABLE 116. THERMCRAFT, INC. (AECO CORP.): PRODUCT SEGMENTS
- TABLE 117. THERMCRAFT, INC. (AECO CORP.): PRODUCT PORTFOLIO
- TABLE 118. UPONOR CORPORATION: KEY EXECUTIVES
- TABLE 119. UPONOR CORPORATION: COMPANY SNAPSHOT
- TABLE 120. UPONOR CORPORATION: PRODUCT SEGMENTS
- TABLE 121. UPONOR CORPORATION: PRODUCT PORTFOLIO
LIST OF FIGURES
- FIGURE 01. INDUSTRIAL HEATING EQUIPMENT MARKET, 2022-2032
- FIGURE 02. SEGMENTATION OF INDUSTRIAL HEATING EQUIPMENT MARKET,2022-2032
- FIGURE 03. TOP IMPACTING FACTORS IN INDUSTRIAL HEATING EQUIPMENT MARKET (2022 TO 2032)
- FIGURE 04. TOP INVESTMENT POCKETS IN INDUSTRIAL HEATING EQUIPMENT MARKET (2023-2032)
- FIGURE 05. MODERATE TO HIGH BARGAINING POWER OF SUPPLIERS
- FIGURE 06. MODERATE TO HIGH THREAT OF NEW ENTRANTS
- FIGURE 07. LOW TO MODERATE THREAT OF SUBSTITUTES
- FIGURE 08. LOW INTENSITY OF RIVALRY
- FIGURE 09. LOW BARGAINING POWER OF BUYERS
- FIGURE 10. GLOBAL INDUSTRIAL HEATING EQUIPMENT MARKET:DRIVERS, RESTRAINTS AND OPPORTUNITIES
- FIGURE 11. INDUSTRIAL HEATING EQUIPMENT MARKET, BY PRODUCT TYPE, 2022 AND 2032(%)
- FIGURE 12. COMPARATIVE SHARE ANALYSIS OF INDUSTRIAL HEATING EQUIPMENT MARKET FOR HEAT PUMPS, BY COUNTRY 2022 AND 2032(%)
- FIGURE 13. COMPARATIVE SHARE ANALYSIS OF INDUSTRIAL HEATING EQUIPMENT MARKET FOR FURNACES, BY COUNTRY 2022 AND 2032(%)
- FIGURE 14. COMPARATIVE SHARE ANALYSIS OF INDUSTRIAL HEATING EQUIPMENT MARKET FOR BOILERS, BY COUNTRY 2022 AND 2032(%)
- FIGURE 15. INDUSTRIAL HEATING EQUIPMENT MARKET, BY FUEL TYPE, 2022 AND 2032(%)
- FIGURE 16. COMPARATIVE SHARE ANALYSIS OF INDUSTRIAL HEATING EQUIPMENT MARKET FOR FOSSIL FUEL, BY COUNTRY 2022 AND 2032(%)
- FIGURE 17. COMPARATIVE SHARE ANALYSIS OF INDUSTRIAL HEATING EQUIPMENT MARKET FOR ELECTRIC, BY COUNTRY 2022 AND 2032(%)
- FIGURE 18. INDUSTRIAL HEATING EQUIPMENT MARKET, BY END-USER INDUSTRY, 2022 AND 2032(%)
- FIGURE 19. COMPARATIVE SHARE ANALYSIS OF INDUSTRIAL HEATING EQUIPMENT MARKET FOR OIL AND GAS, BY COUNTRY 2022 AND 2032(%)
- FIGURE 20. COMPARATIVE SHARE ANALYSIS OF INDUSTRIAL HEATING EQUIPMENT MARKET FOR METAL AND MINING, BY COUNTRY 2022 AND 2032(%)
- FIGURE 21. COMPARATIVE SHARE ANALYSIS OF INDUSTRIAL HEATING EQUIPMENT MARKET FOR CHEMICAL, BY COUNTRY 2022 AND 2032(%)
- FIGURE 22. COMPARATIVE SHARE ANALYSIS OF INDUSTRIAL HEATING EQUIPMENT MARKET FOR OTHERS, BY COUNTRY 2022 AND 2032(%)
- FIGURE 23. INDUSTRIAL HEATING EQUIPMENT MARKET BY REGION, 2022 AND 2032(%)
- FIGURE 24. U.S. INDUSTRIAL HEATING EQUIPMENT MARKET, 2022-2032 ($MILLION)
- FIGURE 25. CANADA INDUSTRIAL HEATING EQUIPMENT MARKET, 2022-2032 ($MILLION)
- FIGURE 26. MEXICO INDUSTRIAL HEATING EQUIPMENT MARKET, 2022-2032 ($MILLION)
- FIGURE 27. GERMANY INDUSTRIAL HEATING EQUIPMENT MARKET, 2022-2032 ($MILLION)
- FIGURE 28. UK INDUSTRIAL HEATING EQUIPMENT MARKET, 2022-2032 ($MILLION)
- FIGURE 29. FRANCE INDUSTRIAL HEATING EQUIPMENT MARKET, 2022-2032 ($MILLION)
- FIGURE 30. SPAIN INDUSTRIAL HEATING EQUIPMENT MARKET, 2022-2032 ($MILLION)
- FIGURE 31. REST OF EUROPE INDUSTRIAL HEATING EQUIPMENT MARKET, 2022-2032 ($MILLION)
- FIGURE 32. CHINA INDUSTRIAL HEATING EQUIPMENT MARKET, 2022-2032 ($MILLION)
- FIGURE 33. JAPAN INDUSTRIAL HEATING EQUIPMENT MARKET, 2022-2032 ($MILLION)
- FIGURE 34. SOUTH KOREA INDUSTRIAL HEATING EQUIPMENT MARKET, 2022-2032 ($MILLION)
- FIGURE 35. INDIA INDUSTRIAL HEATING EQUIPMENT MARKET, 2022-2032 ($MILLION)
- FIGURE 36. REST OF ASIA-PACIFIC INDUSTRIAL HEATING EQUIPMENT MARKET, 2022-2032 ($MILLION)
- FIGURE 37. LATIN AMERICA INDUSTRIAL HEATING EQUIPMENT MARKET, 2022-2032 ($MILLION)
- FIGURE 38. MIDDLE EAST INDUSTRIAL HEATING EQUIPMENT MARKET, 2022-2032 ($MILLION)
- FIGURE 39. AFRICA INDUSTRIAL HEATING EQUIPMENT MARKET, 2022-2032 ($MILLION)
- FIGURE 40. TOP WINNING STRATEGIES, BY YEAR (2021-2024)
- FIGURE 41. TOP WINNING STRATEGIES, BY DEVELOPMENT (2021-2024)
- FIGURE 42. TOP WINNING STRATEGIES, BY COMPANY (2021-2024)
- FIGURE 43. PRODUCT MAPPING OF TOP 10 PLAYERS
- FIGURE 44. COMPETITIVE DASHBOARD
- FIGURE 45. COMPETITIVE HEATMAP: INDUSTRIAL HEATING EQUIPMENT MARKET
- FIGURE 46. TOP PLAYER POSITIONING, 2022
- FIGURE 47. CARRIER: NET SALES, 2021-2023 ($MILLION)
- FIGURE 48. CARRIER: RESEARCH & DEVELOPMENT EXPENDITURE, 2021-2023 ($MILLION)
- FIGURE 49. CARRIER: REVENUE SHARE BY SEGMENT, 2023 (%)
- FIGURE 50. CARRIER: REVENUE SHARE BY REGION, 2023 (%)
- FIGURE 51. DANFOSS A/S: NET REVENUE, 2020-2022 ($MILLION)
- FIGURE 52. DANFOSS A/S: RESEARCH & DEVELOPMENT EXPENDITURE, 2020-2022 ($MILLION)
- FIGURE 53. DANFOSS A/S: REVENUE SHARE BY SEGMENT, 2022 (%)
- FIGURE 54. DANFOSS A/S: REVENUE SHARE BY REGION, 2022 (%)
- FIGURE 55. EMERSON ELECTRIC CO.: NET SALES, 2021-2023 ($MILLION)
- FIGURE 56. EMERSON ELECTRIC CO.: RESEARCH & DEVELOPMENT EXPENDITURE, 2021-2023 ($MILLION)
- FIGURE 57. EMERSON ELECTRIC CO.: REVENUE SHARE BY REGION, 2023 (%)
- FIGURE 58. EMERSON ELECTRIC CO.: REVENUE SHARE BY SEGMENT, 2023 (%)
- FIGURE 59. INGERSOLL RAND INC.: NET SALES, 2021-2023 ($MILLION)
- FIGURE 60. INGERSOLL RAND INC.: RESEARCH & DEVELOPMENT EXPENDITURE, 2021-2023 ($MILLION)
- FIGURE 61. INGERSOLL RAND INC.: REVENUE SHARE BY SEGMENT, 2023 (%)
- FIGURE 62. INGERSOLL RAND INC.: REVENUE SHARE BY REGION, 2023 (%)
- FIGURE 63. JOHNSON CONTROLS: NET SALES, 2021-2023 ($MILLION)
- FIGURE 64. JOHNSON CONTROLS: RESEARCH & DEVELOPMENT EXPENDITURE, 2021-2023 ($MILLION)
- FIGURE 65. JOHNSON CONTROLS: REVENUE SHARE BY SEGMENT, 2023 (%)
- FIGURE 66. JOHNSON CONTROLS: REVENUE SHARE BY REGION, 2023 (%)
- FIGURE 67. LENNOX INTERNATIONAL INC.: NET REVENUE, 2021-2023 ($MILLION)
- FIGURE 68. LENNOX INTERNATIONAL INC.: REVENUE SHARE BY SEGMENT, 2022 (%)
- FIGURE 69. UPONOR CORPORATION: NET REVENUE, 2021-2023 ($MILLION)
- FIGURE 70. UPONOR CORPORATION: RESEARCH & DEVELOPMENT EXPENDITURE, 2021-2023 ($MILLION)
- FIGURE 71. UPONOR CORPORATION: REVENUE SHARE BY SEGMENT, 2023 (%)


