


 |
市场调查报告书
商品编码
1513364
全球塑胶黏剂市场:按树脂类型、技术和最终用途:机会分析和产业预测(2024-2033)Plastic Adhesives Market By Resin Type, By Technology, By End-Use : Global Opportunity Analysis and Industry Forecast, 2024-2033 |
||||||
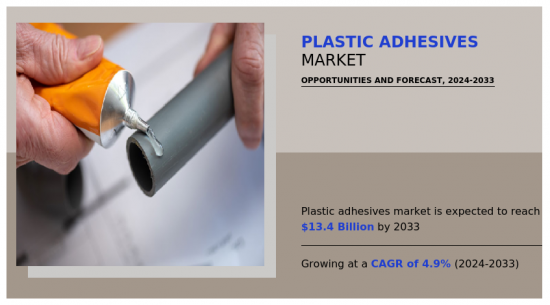
2023年全球塑胶黏剂市场价值为83亿美元,预计到2033年将达到134亿美元,2024年至2033年复合年增长率为4.9%。
介绍
塑胶黏剂通常称为聚合物融合促进剂,是专门设计用于在塑胶基材之间形成内聚分子键的黏剂。这种黏剂的工作原理是催化塑胶表面界面的聚合反应,从而形成强大的分子间网络,有效地融合塑胶。塑胶黏剂的独特配方使其能够克服许多塑胶固有的低表面能和化学惰性的挑战,使其成为各种行业中连接塑胶部件的重要工具。
塑胶黏剂的主要用途之一是在汽车工业中,用于连接汽车的塑胶零件。这包括粘合内饰板、仪表板部件以及保险桿和侧饰条等外部车身部件。塑胶黏剂提供可靠的黏合剂解决方案,能够承受日常的严酷使用和暴露在各种环境条件下。
在电子工业中,塑胶黏剂在电子装置和零件的组装中发挥重要作用。它用于黏合塑胶外壳、固定电路基板和封装精密电子元件。塑胶黏剂形成牢固、绝缘黏剂的能力对于确保电子设备的可靠性和使用寿命至关重要,特别是那些暴露于潮湿、高温和机械应力的电子设备。
市场动态
建设活动的增加将推动塑胶黏剂市场的成长。世界都市化和不断增加的基础设施开发计划正在创造对塑胶黏剂,塑胶黏合剂广泛应用于建筑领域,用于黏合PVC、丙烯酸和聚碳酸酯等材料。这些黏剂在各种建筑应用中发挥重要作用,包括组装结构部件、安装覆层系统和黏合内部饰面。
塑胶黏剂具有黏合力强、柔韧性好以及与各种基材相容等优点,这使得它们对于现代建筑实践至关重要。此外,永续建筑材料的趋势进一步刺激了塑胶黏剂的采用,特别是黏剂环保且低VOC(挥发性有机化合物)配方的黏合剂。
2022 年 7 月,阿科玛透过收购 Permoseal 扩大了在南非的黏剂。这项策略性倡议旨在加强阿科玛在该地区充满活力的工业和建筑市场的地位,特别是在南非和撒哈拉以南非洲地区。收购 Permosil 不仅扩大了阿科玛的产品系列,还透过与其现有品牌 Bostik 的协同效应,巩固了其在该地区的立足点。
然而,塑胶黏剂的温度敏感性预计将阻碍预测期内塑胶黏剂市场的成长。温度敏感性对塑胶黏剂在各行业的使用构成了主要限制,特别是汽车和航太应用。暴露在极端温度下会极大地影响黏剂性能,导致黏合不良并降低耐用性。这种限制会损害黏合部件的可靠性和使用寿命,而这对于确保汽车和飞机的安全性和功能性至关重要。此外,在不同温度条件下满足严格的性能要求使黏剂的选择和涂布过程变得复杂,从而增加了生产成本和上市时间。
各细分市场概览
塑胶黏剂市场按树脂类型、技术、最终用途和地区细分。依树脂类型,市场分为环氧树脂、聚氨酯、丙烯酸、有机硅等。依技术,市场分为溶剂型和水性。依最终用途,市场分为汽车、建筑/建筑、电气/电子、包装等。从区域来看,我们对北美、欧洲、亚太地区和拉丁美洲/中东/非洲市场进行了研究。
按树脂类型划分,环氧树脂领域预计在预测期内成长最快,复合年增长率为 5.7%。塑胶黏剂通常用于环氧树脂配方中,以提高对塑胶表面的黏合力。环氧黏剂具有很强的黏合能力以及对化学品和环境因素的抵抗力,用途广泛,广泛应用于各个行业。在电子工业中,环氧黏剂在电子设备的塑胶机壳、机壳和零件的黏合中发挥着重要的作用。这些黏剂提供可靠的电气绝缘和机械稳定性,确保电子产品的长期性能和可靠性。
从技术角度来看,水性黏剂是塑胶黏剂市场中成长最快的部分,2024年至2033年的复合年增长率为5.0%。印刷和标籤行业依靠水性塑胶黏剂将塑胶标籤、贴纸和图形黏附到各种表面,例如包装、容器和促销材料。这些黏剂具有出色的黏合性能,可实现色彩鲜艳、细节Sharp Corporation的高品质印刷和标籤应用。
按地区划分,亚太地区对塑胶黏剂市场的收益贡献最高。在汽车产业,亚太国家既是汽车生产大国,也是汽车消费大国。塑胶黏剂在汽车内饰件、外饰板、结构总成等各种塑胶部件的黏合中发挥重要作用。日本以其先进技术和精密工程而闻名,在电子製造中广泛使用塑胶黏剂。日本电子公司正在将塑胶黏剂融入智慧型手机、电脑和其他电子设备的组装中,以确保可靠的黏合力和高品质的产品性能。
竞争分析
主要市场趋势:
- 从树脂类型来看,聚氨酯领域在塑胶黏剂市场占据主导地位,占据超过四分之一的市场占有率。
- 从技术面来看,溶剂型是塑胶黏剂市场中最受青睐的细分市场,2024年至2033年的复合年增长率为4.8%。
- 按地区划分,亚洲是成长最快的地区,预测期内复合年增长率为 5.4%。
相关人员的主要利益
- 该报告定量提供了 2023 年至 2033 年塑胶黏剂市场分析的细分市场、当前趋势、估计和趋势分析,并确定了塑胶黏剂市场的强大机会。
- 我们提供市场研究以及与市场驱动因素、市场限制和市场机会相关的资讯。
- 波特的五力分析揭示了买家和供应商的潜力,帮助相关人员做出利润驱动的业务决策并加强供应商和买家网路。
- 塑胶黏剂市场细分的详细分析将有助于确定市场机会。
- 每个地区的主要国家都根据其对全球市场的收益贡献绘製了地图。
- 市场公司定位有助于基准化分析并提供对市场公司当前地位的清晰了解。
- 该报告包括对区域和全球塑胶黏剂市场趋势、主要企业、细分市场、应用领域和市场成长策略的分析。
使用此报告可以进行报告客製化(请联络销售人员以了解额外费用和时间表)
- 产品中所含原料分析(%)
- 最终用户偏好和痛点
- 投资机会
- 产品生命週期
- 按地区分類的新参与企业
- 科技趋势分析
- 按产品/细分市场分類的公司市场占有率分析
- 国家、区域和全球各级的患者/流行病学资料
- 监管指引
- 根据客户兴趣新增其他公司简介
- 按国家或地区进行的附加分析 – 市场规模和预测
- 公司简介的扩充列表
- 历史市场资料
- 导入/汇出分析/资料
- 主要企业详细资料(Excel 格式,包括位置、联络资讯、供应商/供应商网路等)
- 客户/消费者/原料供应商名单 - 价值链分析
- SWOT分析
- 成交量市场规模及预测
目录
第一章简介
第 2 章执行摘要
第三章市场概况
- 市场定义和范围
- 主要发现
- 影响因素
- 主要投资机会
- 波特五力分析
- 市场动态
- 促进因素
- 抑制因素
- 机会
- 价值链分析
- 价格分析
- 关键监管分析
- 专利情况
第四章塑胶黏剂市场:依树脂类型
- 概述
- 聚氨酯
- 环氧树脂
- 丙烯酸纤维
- 硅
- 其他的
第五章塑胶黏剂市场:依技术分类
- 概述
- 溶剂型
- 水性的
第六章塑胶黏剂市场:依应用分类
- 概述
- 车
- 建筑/施工
- 电力/电子
- 包装
- 其他的
第七章塑胶黏剂市场:按地区
- 概述
- 北美洲
- 美国
- 加拿大
- 墨西哥
- 欧洲
- 德国
- 英国
- 法国
- 西班牙
- 义大利
- 其他的
- 亚太地区
- 中国
- 印度
- 日本
- 韩国
- 澳洲
- 其他的
- 拉丁美洲/中东/非洲
- 巴西
- 沙乌地阿拉伯
- 南非
- 其他的
第八章 竞争格局
- 介绍
- 关键成功策略
- 10家主要企业产品图谱
- 竞争对手仪表板
- 竞争热图
- 主要企业定位(2023年)
第九章 公司简介
- Henkel Corporation
- 3M
- HB Fuller Company
- Sika Corporation
- Arkema
- Huntsman International LLC.
- Dow
- MAPEI Corporation
- Jowat Corporation
- Avery Dennison Corporation
The global plastic adhesives market was valued at $8.3 billion in 2023, and is projected to reach $13.4 billion by 2033, growing at a CAGR of 4.9% from 2024 to 2033.
Introduction
Plastic adhesive, often referred to as polymer fusion facilitator, is a specialized bonding agent engineered to create cohesive molecular bonds between plastic substrates. This adhesive functions by catalyzing polymerization reactions at the interface of plastic surfaces, leading to the formation of a strong intermolecular network that effectively fuses the plastics together. The unique formulation of plastic adhesive allows it to overcome challenges such as low surface energy and chemical inertness inherent to many plastics, making it an essential tool for joining plastic components in various industries.
One of the primary applications of plastic adhesive is in the automotive industry, where it is used for bonding plastic components in vehicles. This includes bonding interior trim panels, dashboard components, and exterior body parts, such as bumpers and side moldings. Plastic adhesive provides a reliable bonding solution that withstands the rigors of daily use and exposure to various environmental conditions.
In the electronics industry, plastic adhesive plays a crucial role in assembling electronic devices and components. It is used for bonding plastic housings, securing circuit boards, and encapsulating sensitive electronic components. The ability of plastic adhesive to form strong and insulating bonds is essential for ensuring the reliability and longevity of electronic devices, especially those exposed to moisture, heat, and mechanical stress.
Market Dynamics
Rise in construction activities drives the growth of plastic adhesive market. Urbanization and increase in infrastructure development projects globally create a robust demand for plastic adhesives, which are widely utilized in the construction sector for bonding materials such as PVC, acrylics, and polycarbonates. These adhesives play a crucial role in various construction applications, including the assembly of structural components, installation of cladding systems, and bonding of interior finishes.
Plastic adhesives offer advantages such as strong bonding, flexibility, and compatibility with diverse substrates, making them indispensable in modern construction practices. Additionally, the trend towards sustainable building materials has further fueled the adoption of plastic adhesives, especially those formulated with environment-friendly and low-VOC (volatile organic compound) formulations.
In July 2022, Arkema expanded its presence in South Africa by acquiring Permoseal, a leading manufacturer of adhesive solutions serving various sectors such as do it yourself (DIY), packaging, and construction. This strategic move aimed to enhance Arkema's position in the region, particularly in the dynamic industrial and construction markets of South Africa and Sub-Saharan Africa. The acquisition of Permoseal not only broadened Arkema's product portfolio but also synergized with its existing brand, Bostik, further solidifying its foothold in the region.
However, temperature sensitivity of plastic adhesives is expected to hamper the growth of the plastic adhesive market during the forecast period. Temperature sensitivity poses a significant restraint on the use of plastic adhesives in various industries, particularly in automotive and aerospace applications. The adhesive's performance is severely affected by exposure to extreme temperatures, leading to bond failure or reduced durability. This limitation hampers the reliability and longevity of bonded components, which are crucial for ensuring the safety and functionality of vehicles and aircraft. Additionally, the need to meet stringent performance requirements under varying temperature conditions adds complexity to adhesive selection and application processes, increasing production costs and time-to-market.
Segmental Overview
The plastic adhesive market is segmented into resin type, technology, end-use, and region. On the basis of resin type, the market is classified into epoxy, polyurethane, acrylic, silicone, and others. On the basis of technology, the market is divided into solvent based, water based. By end-use, the market is categorized into automotive, construction and building, electrical and electronics, medical packaging, and others. Region-wise, the market is studied across North America, Europe, Asia-Pacific, and LAMEA.
On the basis of resin type, the epoxy segment is expected to be the fastest growing segment representing the CAGR of 5.7% during the forecast period. Plastic adhesive is commonly used in epoxy formulations to improve adhesion to plastic surfaces. Epoxy adhesives are versatile and widely used in various industries due to their strong bonding capabilities and resistance to chemicals and environmental factors. In the electronics industry, epoxy adhesives play a crucial role in bonding plastic casings, enclosures, and components in electronic devices. These adhesives provide reliable electrical insulation and mechanical stability, ensuring the long-term performance and reliability of electronic products.
On the basis of technology, water based is the fastest-growing segment representing a CAGR of 5.0% in the plastic adhesive market from 2024 to 2033. The printing and labeling industry relies on water-based plastic adhesives for bonding plastic labels, decals, and graphics onto a variety of surfaces, including packaging, containers, and promotional materials. These adhesives offer excellent adhesion properties, enabling high-quality printing and labeling applications with vibrant colors and sharp details.
Region-wise Asia-Pacific is the highest revenue contributor in the plastic adhesive market. In the automotive industry, Asia-Pacific countries are major producers and consumers of vehicles. Plastic adhesives play a critical role in bonding various plastic components in automobiles, including interior trim, exterior panels, and structural assemblies. Japan, known for its advanced technology and precision engineering, utilizes plastic adhesives extensively in electronics manufacturing. Japanese electronics companies incorporate plastic adhesives in the assembly of smartphones, computers, and other electronic devices, ensuring reliable bonding and high-quality product performance.
Competitive Analysis
The report covers the profiles of key industry participants such as Henkel Corporation, 3M, H.B. Fuller Company, SIKA CORPORATION, Arkema, Huntsman International LLC., Dow, MAPEI Corporation, Jowat Corporation, and Avery Dennison Corporation.
Key Market Trends:
- By resin type, the polyurethane segment dominated the plastic adhesive market and accounted for more than one-fourth of the market share.
- By technology, solvent-based is the most lucrative segment in the plastic adhesive market representing for 4.8% of CAGR to the market from 2024 to 2033.
- By region, Asia is the fastest growing region representing for 5.4% CAGR in the market during the forecast period.
Key Benefits For Stakeholders
- This report provides a quantitative analysis of the market segments, current trends, estimations, and dynamics of the plastic adhesives market analysis from 2023 to 2033 to identify the prevailing plastic adhesives market opportunities.
- The market research is offered along with information related to key drivers, restraints, and opportunities.
- Porter's five forces analysis highlights the potency of buyers and suppliers to enable stakeholders make profit-oriented business decisions and strengthen their supplier-buyer network.
- In-depth analysis of the plastic adhesives market segmentation assists to determine the prevailing market opportunities.
- Major countries in each region are mapped according to their revenue contribution to the global market.
- Market player positioning facilitates benchmarking and provides a clear understanding of the present position of the market players.
- The report includes the analysis of the regional as well as global plastic adhesives market trends, key players, market segments, application areas, and market growth strategies.
Additional benefits you will get with this purchase are:
- Quarterly Update and* (only available with a corporate license, on listed price)
- 5 additional Company Profile of client Choice pre- or Post-purchase, as a free update.
- Free Upcoming Version on the Purchase of Five and Enterprise User License.
- 16 analyst hours of support* (post-purchase, if you find additional data requirements upon review of the report, you may receive support amounting to 16 analyst hours to solve questions, and post-sale queries)
- 15% Free Customization* (in case the scope or segment of the report does not match your requirements, 15% is equivalent to 3 working days of free work, applicable once)
- Free data Pack on the Five and Enterprise User License. (Excel version of the report)
- Free Updated report if the report is 6-12 months old or older.
- 24-hour priority response*
- Free Industry updates and white papers.
Possible Customization with this report (with additional cost and timeline, please talk to the sales executive to know more)
- Analysis of raw material in a product (by %)
- End user preferences and pain points
- Investment Opportunities
- Product Life Cycles
- Upcoming/New Entrant by Regions
- Technology Trend Analysis
- Market share analysis of players by products/segments
- Patient/epidemiology data at country, region, global level
- Regulatory Guidelines
- Additional company profiles with specific to client's interest
- Additional country or region analysis- market size and forecast
- Expanded list for Company Profiles
- Historic market data
- Import Export Analysis/Data
- Key player details (including location, contact details, supplier/vendor network etc. in excel format)
- List of customers/consumers/raw material suppliers- value chain analysis
- SWOT Analysis
- Volume Market Size and Forecast
Key Market Segments
By Resin Type
- Acrylic
- Silicone
- Others
- Polyurethane
- Epoxy
By Technology
- Solvent based
- Water based
By End-Use
- Automotive
- Building and Construction
- Electrical and Electronics
- Packaging
- Others
By Region
- North America
- U.S.
- Canada
- Mexico
- Europe
- Germany
- UK
- France
- Spain
- Italy
- Rest Of Europe
- Asia-Pacific
- China
- India
- Japan
- South Korea
- Australia
- Rest of Asia-Pacific
- LAMEA
- Brazil
- Saudi Arabia
- South Africa
- Rest Of Lamea
Key Market Players:
- Henkel Corporation
- 3M
- H.B. Fuller Company
- Sika Corporation
- Arkema
- Huntsman International LLC.
- Dow
- MAPEI Corporation
- Jowat Corporation
- Avery Dennison Corporation
TABLE OF CONTENTS
CHAPTER 1: INTRODUCTION
- 1.1. Report description
- 1.2. Key market segments
- 1.3. Key benefits to the stakeholders
- 1.4. Research methodology
- 1.4.1. Primary research
- 1.4.2. Secondary research
- 1.4.3. Analyst tools and models
CHAPTER 2: EXECUTIVE SUMMARY
- 2.1. CXO perspective
CHAPTER 3: MARKET OVERVIEW
- 3.1. Market definition and scope
- 3.2. Key findings
- 3.2.1. Top impacting factors
- 3.2.2. Top investment pockets
- 3.3. Porter's five forces analysis
- 3.4. Market dynamics
- 3.4.1. Drivers
- 3.4.2. Restraints
- 3.4.3. Opportunities
- 3.5. Value Chain Analysis
- 3.6. Pricing Analysis
- 3.7. Key Regulation Analysis
- 3.8. Patent Landscape
CHAPTER 4: PLASTIC ADHESIVES MARKET, BY RESIN TYPE
- 4.1. Overview
- 4.1.1. Market size and forecast
- 4.2. Polyurethane
- 4.2.1. Key market trends, growth factors and opportunities
- 4.2.2. Market size and forecast, by region
- 4.2.3. Market share analysis by country
- 4.3. Epoxy
- 4.3.1. Key market trends, growth factors and opportunities
- 4.3.2. Market size and forecast, by region
- 4.3.3. Market share analysis by country
- 4.4. Acrylic
- 4.4.1. Key market trends, growth factors and opportunities
- 4.4.2. Market size and forecast, by region
- 4.4.3. Market share analysis by country
- 4.5. Silicone
- 4.5.1. Key market trends, growth factors and opportunities
- 4.5.2. Market size and forecast, by region
- 4.5.3. Market share analysis by country
- 4.6. Others
- 4.6.1. Key market trends, growth factors and opportunities
- 4.6.2. Market size and forecast, by region
- 4.6.3. Market share analysis by country
CHAPTER 5: PLASTIC ADHESIVES MARKET, BY TECHNOLOGY
- 5.1. Overview
- 5.1.1. Market size and forecast
- 5.2. Solvent based
- 5.2.1. Key market trends, growth factors and opportunities
- 5.2.2. Market size and forecast, by region
- 5.2.3. Market share analysis by country
- 5.3. Water based
- 5.3.1. Key market trends, growth factors and opportunities
- 5.3.2. Market size and forecast, by region
- 5.3.3. Market share analysis by country
CHAPTER 6: PLASTIC ADHESIVES MARKET, BY END-USE
- 6.1. Overview
- 6.1.1. Market size and forecast
- 6.2. Automotive
- 6.2.1. Key market trends, growth factors and opportunities
- 6.2.2. Market size and forecast, by region
- 6.2.3. Market share analysis by country
- 6.3. Building and Construction
- 6.3.1. Key market trends, growth factors and opportunities
- 6.3.2. Market size and forecast, by region
- 6.3.3. Market share analysis by country
- 6.4. Electrical and Electronics
- 6.4.1. Key market trends, growth factors and opportunities
- 6.4.2. Market size and forecast, by region
- 6.4.3. Market share analysis by country
- 6.5. Packaging
- 6.5.1. Key market trends, growth factors and opportunities
- 6.5.2. Market size and forecast, by region
- 6.5.3. Market share analysis by country
- 6.6. Others
- 6.6.1. Key market trends, growth factors and opportunities
- 6.6.2. Market size and forecast, by region
- 6.6.3. Market share analysis by country
CHAPTER 7: PLASTIC ADHESIVES MARKET, BY REGION
- 7.1. Overview
- 7.1.1. Market size and forecast By Region
- 7.2. North America
- 7.2.1. Key market trends, growth factors and opportunities
- 7.2.2. Market size and forecast, by Resin Type
- 7.2.3. Market size and forecast, by Technology
- 7.2.4. Market size and forecast, by End-Use
- 7.2.5. Market size and forecast, by country
- 7.2.5.1. U.S.
- 7.2.5.1.1. Market size and forecast, by Resin Type
- 7.2.5.1.2. Market size and forecast, by Technology
- 7.2.5.1.3. Market size and forecast, by End-Use
- 7.2.5.2. Canada
- 7.2.5.2.1. Market size and forecast, by Resin Type
- 7.2.5.2.2. Market size and forecast, by Technology
- 7.2.5.2.3. Market size and forecast, by End-Use
- 7.2.5.3. Mexico
- 7.2.5.3.1. Market size and forecast, by Resin Type
- 7.2.5.3.2. Market size and forecast, by Technology
- 7.2.5.3.3. Market size and forecast, by End-Use
- 7.3. Europe
- 7.3.1. Key market trends, growth factors and opportunities
- 7.3.2. Market size and forecast, by Resin Type
- 7.3.3. Market size and forecast, by Technology
- 7.3.4. Market size and forecast, by End-Use
- 7.3.5. Market size and forecast, by country
- 7.3.5.1. Germany
- 7.3.5.1.1. Market size and forecast, by Resin Type
- 7.3.5.1.2. Market size and forecast, by Technology
- 7.3.5.1.3. Market size and forecast, by End-Use
- 7.3.5.2. UK
- 7.3.5.2.1. Market size and forecast, by Resin Type
- 7.3.5.2.2. Market size and forecast, by Technology
- 7.3.5.2.3. Market size and forecast, by End-Use
- 7.3.5.3. France
- 7.3.5.3.1. Market size and forecast, by Resin Type
- 7.3.5.3.2. Market size and forecast, by Technology
- 7.3.5.3.3. Market size and forecast, by End-Use
- 7.3.5.4. Spain
- 7.3.5.4.1. Market size and forecast, by Resin Type
- 7.3.5.4.2. Market size and forecast, by Technology
- 7.3.5.4.3. Market size and forecast, by End-Use
- 7.3.5.5. Italy
- 7.3.5.5.1. Market size and forecast, by Resin Type
- 7.3.5.5.2. Market size and forecast, by Technology
- 7.3.5.5.3. Market size and forecast, by End-Use
- 7.3.5.6. Rest Of Europe
- 7.3.5.6.1. Market size and forecast, by Resin Type
- 7.3.5.6.2. Market size and forecast, by Technology
- 7.3.5.6.3. Market size and forecast, by End-Use
- 7.4. Asia-Pacific
- 7.4.1. Key market trends, growth factors and opportunities
- 7.4.2. Market size and forecast, by Resin Type
- 7.4.3. Market size and forecast, by Technology
- 7.4.4. Market size and forecast, by End-Use
- 7.4.5. Market size and forecast, by country
- 7.4.5.1. China
- 7.4.5.1.1. Market size and forecast, by Resin Type
- 7.4.5.1.2. Market size and forecast, by Technology
- 7.4.5.1.3. Market size and forecast, by End-Use
- 7.4.5.2. India
- 7.4.5.2.1. Market size and forecast, by Resin Type
- 7.4.5.2.2. Market size and forecast, by Technology
- 7.4.5.2.3. Market size and forecast, by End-Use
- 7.4.5.3. Japan
- 7.4.5.3.1. Market size and forecast, by Resin Type
- 7.4.5.3.2. Market size and forecast, by Technology
- 7.4.5.3.3. Market size and forecast, by End-Use
- 7.4.5.4. South Korea
- 7.4.5.4.1. Market size and forecast, by Resin Type
- 7.4.5.4.2. Market size and forecast, by Technology
- 7.4.5.4.3. Market size and forecast, by End-Use
- 7.4.5.5. Australia
- 7.4.5.5.1. Market size and forecast, by Resin Type
- 7.4.5.5.2. Market size and forecast, by Technology
- 7.4.5.5.3. Market size and forecast, by End-Use
- 7.4.5.6. Rest of Asia-Pacific
- 7.4.5.6.1. Market size and forecast, by Resin Type
- 7.4.5.6.2. Market size and forecast, by Technology
- 7.4.5.6.3. Market size and forecast, by End-Use
- 7.5. LAMEA
- 7.5.1. Key market trends, growth factors and opportunities
- 7.5.2. Market size and forecast, by Resin Type
- 7.5.3. Market size and forecast, by Technology
- 7.5.4. Market size and forecast, by End-Use
- 7.5.5. Market size and forecast, by country
- 7.5.5.1. Brazil
- 7.5.5.1.1. Market size and forecast, by Resin Type
- 7.5.5.1.2. Market size and forecast, by Technology
- 7.5.5.1.3. Market size and forecast, by End-Use
- 7.5.5.2. Saudi Arabia
- 7.5.5.2.1. Market size and forecast, by Resin Type
- 7.5.5.2.2. Market size and forecast, by Technology
- 7.5.5.2.3. Market size and forecast, by End-Use
- 7.5.5.3. South Africa
- 7.5.5.3.1. Market size and forecast, by Resin Type
- 7.5.5.3.2. Market size and forecast, by Technology
- 7.5.5.3.3. Market size and forecast, by End-Use
- 7.5.5.4. Rest Of Lamea
- 7.5.5.4.1. Market size and forecast, by Resin Type
- 7.5.5.4.2. Market size and forecast, by Technology
- 7.5.5.4.3. Market size and forecast, by End-Use
CHAPTER 8: COMPETITIVE LANDSCAPE
- 8.1. Introduction
- 8.2. Top winning strategies
- 8.3. Product mapping of top 10 player
- 8.4. Competitive dashboard
- 8.5. Competitive heatmap
- 8.6. Top player positioning, 2023
CHAPTER 9: COMPANY PROFILES
- 9.1. Henkel Corporation
- 9.1.1. Company overview
- 9.1.2. Key executives
- 9.1.3. Company snapshot
- 9.1.4. Operating business segments
- 9.1.5. Product portfolio
- 9.1.6. Business performance
- 9.1.7. Key strategic moves and developments
- 9.2. 3M
- 9.2.1. Company overview
- 9.2.2. Key executives
- 9.2.3. Company snapshot
- 9.2.4. Operating business segments
- 9.2.5. Product portfolio
- 9.2.6. Business performance
- 9.2.7. Key strategic moves and developments
- 9.3. H.B. Fuller Company
- 9.3.1. Company overview
- 9.3.2. Key executives
- 9.3.3. Company snapshot
- 9.3.4. Operating business segments
- 9.3.5. Product portfolio
- 9.3.6. Business performance
- 9.3.7. Key strategic moves and developments
- 9.4. Sika Corporation
- 9.4.1. Company overview
- 9.4.2. Key executives
- 9.4.3. Company snapshot
- 9.4.4. Operating business segments
- 9.4.5. Product portfolio
- 9.4.6. Business performance
- 9.4.7. Key strategic moves and developments
- 9.5. Arkema
- 9.5.1. Company overview
- 9.5.2. Key executives
- 9.5.3. Company snapshot
- 9.5.4. Operating business segments
- 9.5.5. Product portfolio
- 9.5.6. Business performance
- 9.5.7. Key strategic moves and developments
- 9.6. Huntsman International LLC.
- 9.6.1. Company overview
- 9.6.2. Key executives
- 9.6.3. Company snapshot
- 9.6.4. Operating business segments
- 9.6.5. Product portfolio
- 9.6.6. Business performance
- 9.6.7. Key strategic moves and developments
- 9.7. Dow
- 9.7.1. Company overview
- 9.7.2. Key executives
- 9.7.3. Company snapshot
- 9.7.4. Operating business segments
- 9.7.5. Product portfolio
- 9.7.6. Business performance
- 9.7.7. Key strategic moves and developments
- 9.8. MAPEI Corporation
- 9.8.1. Company overview
- 9.8.2. Key executives
- 9.8.3. Company snapshot
- 9.8.4. Operating business segments
- 9.8.5. Product portfolio
- 9.8.6. Business performance
- 9.8.7. Key strategic moves and developments
- 9.9. Jowat Corporation
- 9.9.1. Company overview
- 9.9.2. Key executives
- 9.9.3. Company snapshot
- 9.9.4. Operating business segments
- 9.9.5. Product portfolio
- 9.9.6. Business performance
- 9.9.7. Key strategic moves and developments
- 9.10. Avery Dennison Corporation
- 9.10.1. Company overview
- 9.10.2. Key executives
- 9.10.3. Company snapshot
- 9.10.4. Operating business segments
- 9.10.5. Product portfolio
- 9.10.6. Business performance
- 9.10.7. Key strategic moves and developments
LIST OF TABLES
- TABLE 01. GLOBAL PLASTIC ADHESIVES MARKET, BY RESIN TYPE, 2023-2033 ($MILLION)
- TABLE 02. GLOBAL PLASTIC ADHESIVES MARKET, BY RESIN TYPE, 2023-2033 (KILOTON)
- TABLE 03. PLASTIC ADHESIVES MARKET FOR POLYURETHANE, BY REGION, 2023-2033 ($MILLION)
- TABLE 04. PLASTIC ADHESIVES MARKET FOR POLYURETHANE, BY REGION, 2023-2033 (KILOTON)
- TABLE 05. PLASTIC ADHESIVES MARKET FOR EPOXY, BY REGION, 2023-2033 ($MILLION)
- TABLE 06. PLASTIC ADHESIVES MARKET FOR EPOXY, BY REGION, 2023-2033 (KILOTON)
- TABLE 07. PLASTIC ADHESIVES MARKET FOR ACRYLIC, BY REGION, 2023-2033 ($MILLION)
- TABLE 08. PLASTIC ADHESIVES MARKET FOR ACRYLIC, BY REGION, 2023-2033 (KILOTON)
- TABLE 09. PLASTIC ADHESIVES MARKET FOR SILICONE, BY REGION, 2023-2033 ($MILLION)
- TABLE 10. PLASTIC ADHESIVES MARKET FOR SILICONE, BY REGION, 2023-2033 (KILOTON)
- TABLE 11. PLASTIC ADHESIVES MARKET FOR OTHERS, BY REGION, 2023-2033 ($MILLION)
- TABLE 12. PLASTIC ADHESIVES MARKET FOR OTHERS, BY REGION, 2023-2033 (KILOTON)
- TABLE 13. GLOBAL PLASTIC ADHESIVES MARKET, BY TECHNOLOGY, 2023-2033 ($MILLION)
- TABLE 14. GLOBAL PLASTIC ADHESIVES MARKET, BY TECHNOLOGY, 2023-2033 (KILOTON)
- TABLE 15. PLASTIC ADHESIVES MARKET FOR SOLVENT BASED, BY REGION, 2023-2033 ($MILLION)
- TABLE 16. PLASTIC ADHESIVES MARKET FOR SOLVENT BASED, BY REGION, 2023-2033 (KILOTON)
- TABLE 17. PLASTIC ADHESIVES MARKET FOR WATER BASED, BY REGION, 2023-2033 ($MILLION)
- TABLE 18. PLASTIC ADHESIVES MARKET FOR WATER BASED, BY REGION, 2023-2033 (KILOTON)
- TABLE 19. GLOBAL PLASTIC ADHESIVES MARKET, BY END-USE, 2023-2033 ($MILLION)
- TABLE 20. GLOBAL PLASTIC ADHESIVES MARKET, BY END-USE, 2023-2033 (KILOTON)
- TABLE 21. PLASTIC ADHESIVES MARKET FOR AUTOMOTIVE, BY REGION, 2023-2033 ($MILLION)
- TABLE 22. PLASTIC ADHESIVES MARKET FOR AUTOMOTIVE, BY REGION, 2023-2033 (KILOTON)
- TABLE 23. PLASTIC ADHESIVES MARKET FOR BUILDING AND CONSTRUCTION, BY REGION, 2023-2033 ($MILLION)
- TABLE 24. PLASTIC ADHESIVES MARKET FOR BUILDING AND CONSTRUCTION, BY REGION, 2023-2033 (KILOTON)
- TABLE 25. PLASTIC ADHESIVES MARKET FOR ELECTRICAL AND ELECTRONICS, BY REGION, 2023-2033 ($MILLION)
- TABLE 26. PLASTIC ADHESIVES MARKET FOR ELECTRICAL AND ELECTRONICS, BY REGION, 2023-2033 (KILOTON)
- TABLE 27. PLASTIC ADHESIVES MARKET FOR PACKAGING, BY REGION, 2023-2033 ($MILLION)
- TABLE 28. PLASTIC ADHESIVES MARKET FOR PACKAGING, BY REGION, 2023-2033 (KILOTON)
- TABLE 29. PLASTIC ADHESIVES MARKET FOR OTHERS, BY REGION, 2023-2033 ($MILLION)
- TABLE 30. PLASTIC ADHESIVES MARKET FOR OTHERS, BY REGION, 2023-2033 (KILOTON)
- TABLE 31. PLASTIC ADHESIVES MARKET, BY REGION, 2023-2033 ($MILLION)
- TABLE 32. PLASTIC ADHESIVES MARKET, BY REGION, 2023-2033 (KILOTON)
- TABLE 33. NORTH AMERICA PLASTIC ADHESIVES MARKET, BY RESIN TYPE, 2023-2033 ($MILLION)
- TABLE 34. NORTH AMERICA PLASTIC ADHESIVES MARKET, BY RESIN TYPE, 2023-2033 (KILOTON)
- TABLE 35. NORTH AMERICA PLASTIC ADHESIVES MARKET, BY TECHNOLOGY, 2023-2033 ($MILLION)
- TABLE 36. NORTH AMERICA PLASTIC ADHESIVES MARKET, BY TECHNOLOGY, 2023-2033 (KILOTON)
- TABLE 37. NORTH AMERICA PLASTIC ADHESIVES MARKET, BY END-USE, 2023-2033 ($MILLION)
- TABLE 38. NORTH AMERICA PLASTIC ADHESIVES MARKET, BY END-USE, 2023-2033 (KILOTON)
- TABLE 39. NORTH AMERICA PLASTIC ADHESIVES MARKET, BY COUNTRY, 2023-2033 ($MILLION)
- TABLE 40. NORTH AMERICA PLASTIC ADHESIVES MARKET, BY COUNTRY, 2023-2033 (KILOTON)
- TABLE 41. U.S. PLASTIC ADHESIVES MARKET, BY RESIN TYPE, 2023-2033 ($MILLION)
- TABLE 42. U.S. PLASTIC ADHESIVES MARKET, BY RESIN TYPE, 2023-2033 (KILOTON)
- TABLE 43. U.S. PLASTIC ADHESIVES MARKET, BY TECHNOLOGY, 2023-2033 ($MILLION)
- TABLE 44. U.S. PLASTIC ADHESIVES MARKET, BY TECHNOLOGY, 2023-2033 (KILOTON)
- TABLE 45. U.S. PLASTIC ADHESIVES MARKET, BY END-USE, 2023-2033 ($MILLION)
- TABLE 46. U.S. PLASTIC ADHESIVES MARKET, BY END-USE, 2023-2033 (KILOTON)
- TABLE 47. CANADA PLASTIC ADHESIVES MARKET, BY RESIN TYPE, 2023-2033 ($MILLION)
- TABLE 48. CANADA PLASTIC ADHESIVES MARKET, BY RESIN TYPE, 2023-2033 (KILOTON)
- TABLE 49. CANADA PLASTIC ADHESIVES MARKET, BY TECHNOLOGY, 2023-2033 ($MILLION)
- TABLE 50. CANADA PLASTIC ADHESIVES MARKET, BY TECHNOLOGY, 2023-2033 (KILOTON)
- TABLE 51. CANADA PLASTIC ADHESIVES MARKET, BY END-USE, 2023-2033 ($MILLION)
- TABLE 52. CANADA PLASTIC ADHESIVES MARKET, BY END-USE, 2023-2033 (KILOTON)
- TABLE 53. MEXICO PLASTIC ADHESIVES MARKET, BY RESIN TYPE, 2023-2033 ($MILLION)
- TABLE 54. MEXICO PLASTIC ADHESIVES MARKET, BY RESIN TYPE, 2023-2033 (KILOTON)
- TABLE 55. MEXICO PLASTIC ADHESIVES MARKET, BY TECHNOLOGY, 2023-2033 ($MILLION)
- TABLE 56. MEXICO PLASTIC ADHESIVES MARKET, BY TECHNOLOGY, 2023-2033 (KILOTON)
- TABLE 57. MEXICO PLASTIC ADHESIVES MARKET, BY END-USE, 2023-2033 ($MILLION)
- TABLE 58. MEXICO PLASTIC ADHESIVES MARKET, BY END-USE, 2023-2033 (KILOTON)
- TABLE 59. EUROPE PLASTIC ADHESIVES MARKET, BY RESIN TYPE, 2023-2033 ($MILLION)
- TABLE 60. EUROPE PLASTIC ADHESIVES MARKET, BY RESIN TYPE, 2023-2033 (KILOTON)
- TABLE 61. EUROPE PLASTIC ADHESIVES MARKET, BY TECHNOLOGY, 2023-2033 ($MILLION)
- TABLE 62. EUROPE PLASTIC ADHESIVES MARKET, BY TECHNOLOGY, 2023-2033 (KILOTON)
- TABLE 63. EUROPE PLASTIC ADHESIVES MARKET, BY END-USE, 2023-2033 ($MILLION)
- TABLE 64. EUROPE PLASTIC ADHESIVES MARKET, BY END-USE, 2023-2033 (KILOTON)
- TABLE 65. EUROPE PLASTIC ADHESIVES MARKET, BY COUNTRY, 2023-2033 ($MILLION)
- TABLE 66. EUROPE PLASTIC ADHESIVES MARKET, BY COUNTRY, 2023-2033 (KILOTON)
- TABLE 67. GERMANY PLASTIC ADHESIVES MARKET, BY RESIN TYPE, 2023-2033 ($MILLION)
- TABLE 68. GERMANY PLASTIC ADHESIVES MARKET, BY RESIN TYPE, 2023-2033 (KILOTON)
- TABLE 69. GERMANY PLASTIC ADHESIVES MARKET, BY TECHNOLOGY, 2023-2033 ($MILLION)
- TABLE 70. GERMANY PLASTIC ADHESIVES MARKET, BY TECHNOLOGY, 2023-2033 (KILOTON)
- TABLE 71. GERMANY PLASTIC ADHESIVES MARKET, BY END-USE, 2023-2033 ($MILLION)
- TABLE 72. GERMANY PLASTIC ADHESIVES MARKET, BY END-USE, 2023-2033 (KILOTON)
- TABLE 73. UK PLASTIC ADHESIVES MARKET, BY RESIN TYPE, 2023-2033 ($MILLION)
- TABLE 74. UK PLASTIC ADHESIVES MARKET, BY RESIN TYPE, 2023-2033 (KILOTON)
- TABLE 75. UK PLASTIC ADHESIVES MARKET, BY TECHNOLOGY, 2023-2033 ($MILLION)
- TABLE 76. UK PLASTIC ADHESIVES MARKET, BY TECHNOLOGY, 2023-2033 (KILOTON)
- TABLE 77. UK PLASTIC ADHESIVES MARKET, BY END-USE, 2023-2033 ($MILLION)
- TABLE 78. UK PLASTIC ADHESIVES MARKET, BY END-USE, 2023-2033 (KILOTON)
- TABLE 79. FRANCE PLASTIC ADHESIVES MARKET, BY RESIN TYPE, 2023-2033 ($MILLION)
- TABLE 80. FRANCE PLASTIC ADHESIVES MARKET, BY RESIN TYPE, 2023-2033 (KILOTON)
- TABLE 81. FRANCE PLASTIC ADHESIVES MARKET, BY TECHNOLOGY, 2023-2033 ($MILLION)
- TABLE 82. FRANCE PLASTIC ADHESIVES MARKET, BY TECHNOLOGY, 2023-2033 (KILOTON)
- TABLE 83. FRANCE PLASTIC ADHESIVES MARKET, BY END-USE, 2023-2033 ($MILLION)
- TABLE 84. FRANCE PLASTIC ADHESIVES MARKET, BY END-USE, 2023-2033 (KILOTON)
- TABLE 85. SPAIN PLASTIC ADHESIVES MARKET, BY RESIN TYPE, 2023-2033 ($MILLION)
- TABLE 86. SPAIN PLASTIC ADHESIVES MARKET, BY RESIN TYPE, 2023-2033 (KILOTON)
- TABLE 87. SPAIN PLASTIC ADHESIVES MARKET, BY TECHNOLOGY, 2023-2033 ($MILLION)
- TABLE 88. SPAIN PLASTIC ADHESIVES MARKET, BY TECHNOLOGY, 2023-2033 (KILOTON)
- TABLE 89. SPAIN PLASTIC ADHESIVES MARKET, BY END-USE, 2023-2033 ($MILLION)
- TABLE 90. SPAIN PLASTIC ADHESIVES MARKET, BY END-USE, 2023-2033 (KILOTON)
- TABLE 91. ITALY PLASTIC ADHESIVES MARKET, BY RESIN TYPE, 2023-2033 ($MILLION)
- TABLE 92. ITALY PLASTIC ADHESIVES MARKET, BY RESIN TYPE, 2023-2033 (KILOTON)
- TABLE 93. ITALY PLASTIC ADHESIVES MARKET, BY TECHNOLOGY, 2023-2033 ($MILLION)
- TABLE 94. ITALY PLASTIC ADHESIVES MARKET, BY TECHNOLOGY, 2023-2033 (KILOTON)
- TABLE 95. ITALY PLASTIC ADHESIVES MARKET, BY END-USE, 2023-2033 ($MILLION)
- TABLE 96. ITALY PLASTIC ADHESIVES MARKET, BY END-USE, 2023-2033 (KILOTON)
- TABLE 97. REST OF EUROPE PLASTIC ADHESIVES MARKET, BY RESIN TYPE, 2023-2033 ($MILLION)
- TABLE 98. REST OF EUROPE PLASTIC ADHESIVES MARKET, BY RESIN TYPE, 2023-2033 (KILOTON)
- TABLE 99. REST OF EUROPE PLASTIC ADHESIVES MARKET, BY TECHNOLOGY, 2023-2033 ($MILLION)
- TABLE 100. REST OF EUROPE PLASTIC ADHESIVES MARKET, BY TECHNOLOGY, 2023-2033 (KILOTON)
- TABLE 101. REST OF EUROPE PLASTIC ADHESIVES MARKET, BY END-USE, 2023-2033 ($MILLION)
- TABLE 102. REST OF EUROPE PLASTIC ADHESIVES MARKET, BY END-USE, 2023-2033 (KILOTON)
- TABLE 103. ASIA-PACIFIC PLASTIC ADHESIVES MARKET, BY RESIN TYPE, 2023-2033 ($MILLION)
- TABLE 104. ASIA-PACIFIC PLASTIC ADHESIVES MARKET, BY RESIN TYPE, 2023-2033 (KILOTON)
- TABLE 105. ASIA-PACIFIC PLASTIC ADHESIVES MARKET, BY TECHNOLOGY, 2023-2033 ($MILLION)
- TABLE 106. ASIA-PACIFIC PLASTIC ADHESIVES MARKET, BY TECHNOLOGY, 2023-2033 (KILOTON)
- TABLE 107. ASIA-PACIFIC PLASTIC ADHESIVES MARKET, BY END-USE, 2023-2033 ($MILLION)
- TABLE 108. ASIA-PACIFIC PLASTIC ADHESIVES MARKET, BY END-USE, 2023-2033 (KILOTON)
- TABLE 109. ASIA-PACIFIC PLASTIC ADHESIVES MARKET, BY COUNTRY, 2023-2033 ($MILLION)
- TABLE 110. ASIA-PACIFIC PLASTIC ADHESIVES MARKET, BY COUNTRY, 2023-2033 (KILOTON)
- TABLE 111. CHINA PLASTIC ADHESIVES MARKET, BY RESIN TYPE, 2023-2033 ($MILLION)
- TABLE 112. CHINA PLASTIC ADHESIVES MARKET, BY RESIN TYPE, 2023-2033 (KILOTON)
- TABLE 113. CHINA PLASTIC ADHESIVES MARKET, BY TECHNOLOGY, 2023-2033 ($MILLION)
- TABLE 114. CHINA PLASTIC ADHESIVES MARKET, BY TECHNOLOGY, 2023-2033 (KILOTON)
- TABLE 115. CHINA PLASTIC ADHESIVES MARKET, BY END-USE, 2023-2033 ($MILLION)
- TABLE 116. CHINA PLASTIC ADHESIVES MARKET, BY END-USE, 2023-2033 (KILOTON)
- TABLE 117. INDIA PLASTIC ADHESIVES MARKET, BY RESIN TYPE, 2023-2033 ($MILLION)
- TABLE 118. INDIA PLASTIC ADHESIVES MARKET, BY RESIN TYPE, 2023-2033 (KILOTON)
- TABLE 119. INDIA PLASTIC ADHESIVES MARKET, BY TECHNOLOGY, 2023-2033 ($MILLION)
- TABLE 120. INDIA PLASTIC ADHESIVES MARKET, BY TECHNOLOGY, 2023-2033 (KILOTON)
- TABLE 121. INDIA PLASTIC ADHESIVES MARKET, BY END-USE, 2023-2033 ($MILLION)
- TABLE 122. INDIA PLASTIC ADHESIVES MARKET, BY END-USE, 2023-2033 (KILOTON)
- TABLE 123. JAPAN PLASTIC ADHESIVES MARKET, BY RESIN TYPE, 2023-2033 ($MILLION)
- TABLE 124. JAPAN PLASTIC ADHESIVES MARKET, BY RESIN TYPE, 2023-2033 (KILOTON)
- TABLE 125. JAPAN PLASTIC ADHESIVES MARKET, BY TECHNOLOGY, 2023-2033 ($MILLION)
- TABLE 126. JAPAN PLASTIC ADHESIVES MARKET, BY TECHNOLOGY, 2023-2033 (KILOTON)
- TABLE 127. JAPAN PLASTIC ADHESIVES MARKET, BY END-USE, 2023-2033 ($MILLION)
- TABLE 128. JAPAN PLASTIC ADHESIVES MARKET, BY END-USE, 2023-2033 (KILOTON)
- TABLE 129. SOUTH KOREA PLASTIC ADHESIVES MARKET, BY RESIN TYPE, 2023-2033 ($MILLION)
- TABLE 130. SOUTH KOREA PLASTIC ADHESIVES MARKET, BY RESIN TYPE, 2023-2033 (KILOTON)
- TABLE 131. SOUTH KOREA PLASTIC ADHESIVES MARKET, BY TECHNOLOGY, 2023-2033 ($MILLION)
- TABLE 132. SOUTH KOREA PLASTIC ADHESIVES MARKET, BY TECHNOLOGY, 2023-2033 (KILOTON)
- TABLE 133. SOUTH KOREA PLASTIC ADHESIVES MARKET, BY END-USE, 2023-2033 ($MILLION)
- TABLE 134. SOUTH KOREA PLASTIC ADHESIVES MARKET, BY END-USE, 2023-2033 (KILOTON)
- TABLE 135. AUSTRALIA PLASTIC ADHESIVES MARKET, BY RESIN TYPE, 2023-2033 ($MILLION)
- TABLE 136. AUSTRALIA PLASTIC ADHESIVES MARKET, BY RESIN TYPE, 2023-2033 (KILOTON)
- TABLE 137. AUSTRALIA PLASTIC ADHESIVES MARKET, BY TECHNOLOGY, 2023-2033 ($MILLION)
- TABLE 138. AUSTRALIA PLASTIC ADHESIVES MARKET, BY TECHNOLOGY, 2023-2033 (KILOTON)
- TABLE 139. AUSTRALIA PLASTIC ADHESIVES MARKET, BY END-USE, 2023-2033 ($MILLION)
- TABLE 140. AUSTRALIA PLASTIC ADHESIVES MARKET, BY END-USE, 2023-2033 (KILOTON)
- TABLE 141. REST OF ASIA-PACIFIC PLASTIC ADHESIVES MARKET, BY RESIN TYPE, 2023-2033 ($MILLION)
- TABLE 142. REST OF ASIA-PACIFIC PLASTIC ADHESIVES MARKET, BY RESIN TYPE, 2023-2033 (KILOTON)
- TABLE 143. REST OF ASIA-PACIFIC PLASTIC ADHESIVES MARKET, BY TECHNOLOGY, 2023-2033 ($MILLION)
- TABLE 144. REST OF ASIA-PACIFIC PLASTIC ADHESIVES MARKET, BY TECHNOLOGY, 2023-2033 (KILOTON)
- TABLE 145. REST OF ASIA-PACIFIC PLASTIC ADHESIVES MARKET, BY END-USE, 2023-2033 ($MILLION)
- TABLE 146. REST OF ASIA-PACIFIC PLASTIC ADHESIVES MARKET, BY END-USE, 2023-2033 (KILOTON)
- TABLE 147. LAMEA PLASTIC ADHESIVES MARKET, BY RESIN TYPE, 2023-2033 ($MILLION)
- TABLE 148. LAMEA PLASTIC ADHESIVES MARKET, BY RESIN TYPE, 2023-2033 (KILOTON)
- TABLE 149. LAMEA PLASTIC ADHESIVES MARKET, BY TECHNOLOGY, 2023-2033 ($MILLION)
- TABLE 150. LAMEA PLASTIC ADHESIVES MARKET, BY TECHNOLOGY, 2023-2033 (KILOTON)
- TABLE 151. LAMEA PLASTIC ADHESIVES MARKET, BY END-USE, 2023-2033 ($MILLION)
- TABLE 152. LAMEA PLASTIC ADHESIVES MARKET, BY END-USE, 2023-2033 (KILOTON)
- TABLE 153. LAMEA PLASTIC ADHESIVES MARKET, BY COUNTRY, 2023-2033 ($MILLION)
- TABLE 154. LAMEA PLASTIC ADHESIVES MARKET, BY COUNTRY, 2023-2033 (KILOTON)
- TABLE 155. BRAZIL PLASTIC ADHESIVES MARKET, BY RESIN TYPE, 2023-2033 ($MILLION)
- TABLE 156. BRAZIL PLASTIC ADHESIVES MARKET, BY RESIN TYPE, 2023-2033 (KILOTON)
- TABLE 157. BRAZIL PLASTIC ADHESIVES MARKET, BY TECHNOLOGY, 2023-2033 ($MILLION)
- TABLE 158. BRAZIL PLASTIC ADHESIVES MARKET, BY TECHNOLOGY, 2023-2033 (KILOTON)
- TABLE 159. BRAZIL PLASTIC ADHESIVES MARKET, BY END-USE, 2023-2033 ($MILLION)
- TABLE 160. BRAZIL PLASTIC ADHESIVES MARKET, BY END-USE, 2023-2033 (KILOTON)
- TABLE 161. SAUDI ARABIA PLASTIC ADHESIVES MARKET, BY RESIN TYPE, 2023-2033 ($MILLION)
- TABLE 162. SAUDI ARABIA PLASTIC ADHESIVES MARKET, BY RESIN TYPE, 2023-2033 (KILOTON)
- TABLE 163. SAUDI ARABIA PLASTIC ADHESIVES MARKET, BY TECHNOLOGY, 2023-2033 ($MILLION)
- TABLE 164. SAUDI ARABIA PLASTIC ADHESIVES MARKET, BY TECHNOLOGY, 2023-2033 (KILOTON)
- TABLE 165. SAUDI ARABIA PLASTIC ADHESIVES MARKET, BY END-USE, 2023-2033 ($MILLION)
- TABLE 166. SAUDI ARABIA PLASTIC ADHESIVES MARKET, BY END-USE, 2023-2033 (KILOTON)
- TABLE 167. SOUTH AFRICA PLASTIC ADHESIVES MARKET, BY RESIN TYPE, 2023-2033 ($MILLION)
- TABLE 168. SOUTH AFRICA PLASTIC ADHESIVES MARKET, BY RESIN TYPE, 2023-2033 (KILOTON)
- TABLE 169. SOUTH AFRICA PLASTIC ADHESIVES MARKET, BY TECHNOLOGY, 2023-2033 ($MILLION)
- TABLE 170. SOUTH AFRICA PLASTIC ADHESIVES MARKET, BY TECHNOLOGY, 2023-2033 (KILOTON)
- TABLE 171. SOUTH AFRICA PLASTIC ADHESIVES MARKET, BY END-USE, 2023-2033 ($MILLION)
- TABLE 172. SOUTH AFRICA PLASTIC ADHESIVES MARKET, BY END-USE, 2023-2033 (KILOTON)
- TABLE 173. REST OF LAMEA PLASTIC ADHESIVES MARKET, BY RESIN TYPE, 2023-2033 ($MILLION)
- TABLE 174. REST OF LAMEA PLASTIC ADHESIVES MARKET, BY RESIN TYPE, 2023-2033 (KILOTON)
- TABLE 175. REST OF LAMEA PLASTIC ADHESIVES MARKET, BY TECHNOLOGY, 2023-2033 ($MILLION)
- TABLE 176. REST OF LAMEA PLASTIC ADHESIVES MARKET, BY TECHNOLOGY, 2023-2033 (KILOTON)
- TABLE 177. REST OF LAMEA PLASTIC ADHESIVES MARKET, BY END-USE, 2023-2033 ($MILLION)
- TABLE 178. REST OF LAMEA PLASTIC ADHESIVES MARKET, BY END-USE, 2023-2033 (KILOTON)
- TABLE 179. HENKEL CORPORATION: KEY EXECUTIVES
- TABLE 180. HENKEL CORPORATION: COMPANY SNAPSHOT
- TABLE 181. HENKEL CORPORATION: PRODUCT SEGMENTS
- TABLE 182. HENKEL CORPORATION: SERVICE SEGMENTS
- TABLE 183. HENKEL CORPORATION: PRODUCT PORTFOLIO
- TABLE 184. HENKEL CORPORATION: KEY STRATEGIES
- TABLE 185. 3M: KEY EXECUTIVES
- TABLE 186. 3M: COMPANY SNAPSHOT
- TABLE 187. 3M: PRODUCT SEGMENTS
- TABLE 188. 3M: SERVICE SEGMENTS
- TABLE 189. 3M: PRODUCT PORTFOLIO
- TABLE 190. 3M: KEY STRATEGIES
- TABLE 191. H.B. FULLER COMPANY: KEY EXECUTIVES
- TABLE 192. H.B. FULLER COMPANY: COMPANY SNAPSHOT
- TABLE 193. H.B. FULLER COMPANY: PRODUCT SEGMENTS
- TABLE 194. H.B. FULLER COMPANY: SERVICE SEGMENTS
- TABLE 195. H.B. FULLER COMPANY: PRODUCT PORTFOLIO
- TABLE 196. H.B. FULLER COMPANY: KEY STRATEGIES
- TABLE 197. SIKA CORPORATION: KEY EXECUTIVES
- TABLE 198. SIKA CORPORATION: COMPANY SNAPSHOT
- TABLE 199. SIKA CORPORATION: PRODUCT SEGMENTS
- TABLE 200. SIKA CORPORATION: SERVICE SEGMENTS
- TABLE 201. SIKA CORPORATION: PRODUCT PORTFOLIO
- TABLE 202. SIKA CORPORATION: KEY STRATEGIES
- TABLE 203. ARKEMA: KEY EXECUTIVES
- TABLE 204. ARKEMA: COMPANY SNAPSHOT
- TABLE 205. ARKEMA: PRODUCT SEGMENTS
- TABLE 206. ARKEMA: SERVICE SEGMENTS
- TABLE 207. ARKEMA: PRODUCT PORTFOLIO
- TABLE 208. ARKEMA: KEY STRATEGIES
- TABLE 209. HUNTSMAN INTERNATIONAL LLC.: KEY EXECUTIVES
- TABLE 210. HUNTSMAN INTERNATIONAL LLC.: COMPANY SNAPSHOT
- TABLE 211. HUNTSMAN INTERNATIONAL LLC.: PRODUCT SEGMENTS
- TABLE 212. HUNTSMAN INTERNATIONAL LLC.: SERVICE SEGMENTS
- TABLE 213. HUNTSMAN INTERNATIONAL LLC.: PRODUCT PORTFOLIO
- TABLE 214. HUNTSMAN INTERNATIONAL LLC.: KEY STRATEGIES
- TABLE 215. DOW: KEY EXECUTIVES
- TABLE 216. DOW: COMPANY SNAPSHOT
- TABLE 217. DOW: PRODUCT SEGMENTS
- TABLE 218. DOW: SERVICE SEGMENTS
- TABLE 219. DOW: PRODUCT PORTFOLIO
- TABLE 220. DOW: KEY STRATEGIES
- TABLE 221. MAPEI CORPORATION: KEY EXECUTIVES
- TABLE 222. MAPEI CORPORATION: COMPANY SNAPSHOT
- TABLE 223. MAPEI CORPORATION: PRODUCT SEGMENTS
- TABLE 224. MAPEI CORPORATION: SERVICE SEGMENTS
- TABLE 225. MAPEI CORPORATION: PRODUCT PORTFOLIO
- TABLE 226. MAPEI CORPORATION: KEY STRATEGIES
- TABLE 227. JOWAT CORPORATION: KEY EXECUTIVES
- TABLE 228. JOWAT CORPORATION: COMPANY SNAPSHOT
- TABLE 229. JOWAT CORPORATION: PRODUCT SEGMENTS
- TABLE 230. JOWAT CORPORATION: SERVICE SEGMENTS
- TABLE 231. JOWAT CORPORATION: PRODUCT PORTFOLIO
- TABLE 232. JOWAT CORPORATION: KEY STRATEGIES
- TABLE 233. AVERY DENNISON CORPORATION: KEY EXECUTIVES
- TABLE 234. AVERY DENNISON CORPORATION: COMPANY SNAPSHOT
- TABLE 235. AVERY DENNISON CORPORATION: PRODUCT SEGMENTS
- TABLE 236. AVERY DENNISON CORPORATION: SERVICE SEGMENTS
- TABLE 237. AVERY DENNISON CORPORATION: PRODUCT PORTFOLIO
- TABLE 238. AVERY DENNISON CORPORATION: KEY STRATEGIES
LIST OF FIGURES
- FIGURE 01. PLASTIC ADHESIVES MARKET, 2023-2033
- FIGURE 02. SEGMENTATION OF PLASTIC ADHESIVES MARKET,2023-2033
- FIGURE 03. TOP IMPACTING FACTORS IN PLASTIC ADHESIVES MARKET
- FIGURE 04. TOP INVESTMENT POCKETS IN PLASTIC ADHESIVES MARKET (2024-2033)
- FIGURE 05. BARGAINING POWER OF SUPPLIERS
- FIGURE 06. BARGAINING POWER OF BUYERS
- FIGURE 07. THREAT OF SUBSTITUTION
- FIGURE 08. THREAT OF SUBSTITUTION
- FIGURE 09. COMPETITIVE RIVALRY
- FIGURE 10. GLOBAL PLASTIC ADHESIVES MARKET:DRIVERS, RESTRAINTS AND OPPORTUNITIES
- FIGURE 11. PRICING ANALYSIS: PLASTIC ADHESIVES MARKET 2023 AND 2033
- FIGURE 12. IMPACT OF KEY REGULATION: PLASTIC ADHESIVES MARKET
- FIGURE 13. PATENT ANALYSIS BY COMPANY
- FIGURE 14. PATENT ANALYSIS BY COUNTRY
- FIGURE 15. PLASTIC ADHESIVES MARKET, BY RESIN TYPE, 2023 AND 2033(%)
- FIGURE 16. COMPARATIVE SHARE ANALYSIS OF PLASTIC ADHESIVES MARKET FOR POLYURETHANE, BY COUNTRY 2023 AND 2033(%)
- FIGURE 17. COMPARATIVE SHARE ANALYSIS OF PLASTIC ADHESIVES MARKET FOR EPOXY, BY COUNTRY 2023 AND 2033(%)
- FIGURE 18. COMPARATIVE SHARE ANALYSIS OF PLASTIC ADHESIVES MARKET FOR ACRYLIC, BY COUNTRY 2023 AND 2033(%)
- FIGURE 19. COMPARATIVE SHARE ANALYSIS OF PLASTIC ADHESIVES MARKET FOR SILICONE, BY COUNTRY 2023 AND 2033(%)
- FIGURE 20. COMPARATIVE SHARE ANALYSIS OF PLASTIC ADHESIVES MARKET FOR OTHERS, BY COUNTRY 2023 AND 2033(%)
- FIGURE 21. PLASTIC ADHESIVES MARKET, BY TECHNOLOGY, 2023 AND 2033(%)
- FIGURE 22. COMPARATIVE SHARE ANALYSIS OF PLASTIC ADHESIVES MARKET FOR SOLVENT BASED, BY COUNTRY 2023 AND 2033(%)
- FIGURE 23. COMPARATIVE SHARE ANALYSIS OF PLASTIC ADHESIVES MARKET FOR WATER BASED, BY COUNTRY 2023 AND 2033(%)
- FIGURE 24. PLASTIC ADHESIVES MARKET, BY END-USE, 2023 AND 2033(%)
- FIGURE 25. COMPARATIVE SHARE ANALYSIS OF PLASTIC ADHESIVES MARKET FOR AUTOMOTIVE, BY COUNTRY 2023 AND 2033(%)
- FIGURE 26. COMPARATIVE SHARE ANALYSIS OF PLASTIC ADHESIVES MARKET FOR BUILDING AND CONSTRUCTION, BY COUNTRY 2023 AND 2033(%)
- FIGURE 27. COMPARATIVE SHARE ANALYSIS OF PLASTIC ADHESIVES MARKET FOR ELECTRICAL AND ELECTRONICS, BY COUNTRY 2023 AND 2033(%)
- FIGURE 28. COMPARATIVE SHARE ANALYSIS OF PLASTIC ADHESIVES MARKET FOR PACKAGING, BY COUNTRY 2023 AND 2033(%)
- FIGURE 29. COMPARATIVE SHARE ANALYSIS OF PLASTIC ADHESIVES MARKET FOR OTHERS, BY COUNTRY 2023 AND 2033(%)
- FIGURE 30. PLASTIC ADHESIVES MARKET BY REGION, 2023 AND 2033(%)
- FIGURE 31. U.S. PLASTIC ADHESIVES MARKET, 2023-2033 ($MILLION)
- FIGURE 32. CANADA PLASTIC ADHESIVES MARKET, 2023-2033 ($MILLION)
- FIGURE 33. MEXICO PLASTIC ADHESIVES MARKET, 2023-2033 ($MILLION)
- FIGURE 34. GERMANY PLASTIC ADHESIVES MARKET, 2023-2033 ($MILLION)
- FIGURE 35. UK PLASTIC ADHESIVES MARKET, 2023-2033 ($MILLION)
- FIGURE 36. FRANCE PLASTIC ADHESIVES MARKET, 2023-2033 ($MILLION)
- FIGURE 37. SPAIN PLASTIC ADHESIVES MARKET, 2023-2033 ($MILLION)
- FIGURE 38. ITALY PLASTIC ADHESIVES MARKET, 2023-2033 ($MILLION)
- FIGURE 39. REST OF EUROPE PLASTIC ADHESIVES MARKET, 2023-2033 ($MILLION)
- FIGURE 40. CHINA PLASTIC ADHESIVES MARKET, 2023-2033 ($MILLION)
- FIGURE 41. INDIA PLASTIC ADHESIVES MARKET, 2023-2033 ($MILLION)
- FIGURE 42. JAPAN PLASTIC ADHESIVES MARKET, 2023-2033 ($MILLION)
- FIGURE 43. SOUTH KOREA PLASTIC ADHESIVES MARKET, 2023-2033 ($MILLION)
- FIGURE 44. AUSTRALIA PLASTIC ADHESIVES MARKET, 2023-2033 ($MILLION)
- FIGURE 45. REST OF ASIA-PACIFIC PLASTIC ADHESIVES MARKET, 2023-2033 ($MILLION)
- FIGURE 46. BRAZIL PLASTIC ADHESIVES MARKET, 2023-2033 ($MILLION)
- FIGURE 47. SAUDI ARABIA PLASTIC ADHESIVES MARKET, 2023-2033 ($MILLION)
- FIGURE 48. SOUTH AFRICA PLASTIC ADHESIVES MARKET, 2023-2033 ($MILLION)
- FIGURE 49. REST OF LAMEA PLASTIC ADHESIVES MARKET, 2023-2033 ($MILLION)
- FIGURE 50. TOP WINNING STRATEGIES, BY YEAR
- FIGURE 51. TOP WINNING STRATEGIES, BY DEVELOPMENT
- FIGURE 52. TOP WINNING STRATEGIES, BY COMPANY
- FIGURE 53. PRODUCT MAPPING OF TOP 10 PLAYERS
- FIGURE 54. COMPETITIVE DASHBOARD
- FIGURE 55. COMPETITIVE HEATMAP: PLASTIC ADHESIVES MARKET
- FIGURE 56. TOP PLAYER POSITIONING, 2023


