


 |
市场调查报告书
商品编码
1513385
全球生物识别卡市场:按应用程式、最终用户:机会分析和产业预测(2023-2032)Biometric Cards Market By Application (Payments, Access Control, Others), By End User (BFSI, Retail, Government, Healthcare, Others): Global Opportunity Analysis and Industry Forecast, 2023-2032 |
||||||
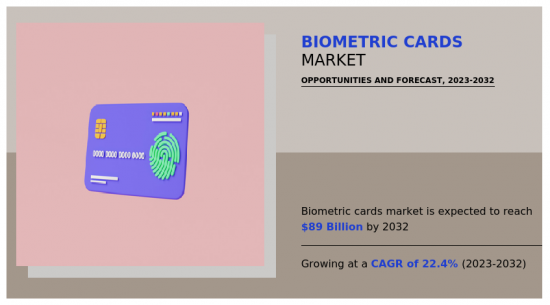
全球生物识别卡市场规模预计将从2022年的126亿美元成长到2032年的890亿美元,2023年至2032年的复合年增长率为22.4%。
生物识别卡是一种采用生物识别技术来验证持卡人身分的智慧卡。这些卡通常嵌入生物识别资料,例如指纹、虹膜图案和脸部特征,当卡用于访问控制、金融交易和身份验证等各种目的时,可以使用这些数据来识别卡的所有权。由于生物识别资料对每个人来说都是独一无二的,而且难以伪造或窃取,因此与密码和密码等传统方法相比,生物识别提供了更可靠的身份验证方式,从而提高了安全性。
生物识别卡以指纹或虹膜扫描等生物识别资料取代密码和密码等传统方法,简化了身分验证流程。这简化了用户体验,并且无需记住多个密码或携带额外的身份验证设备。生物识别卡使用户只需出示卡片并透过生物识别扫描验证身份即可更快完成交易。这种速度在效率至关重要的环境中尤其有价值,例如零售商店、交通枢纽和门禁系统。生物识别卡可以相对轻鬆地整合到现有的付款系统、门禁系统和身份验证流程中。这种多功能性使生物识别卡适用于从金融服务到实体安全的广泛应用。随着生物识别技术在智慧型手机和笔记型电脑等日常设备中变得越来越普遍,消费者越来越熟悉使用生物识别进行身份验证的想法。生物识别卡透过提供熟悉且易于使用的体验来利用这种日益增长的接受度。
监管障碍是生物识别卡市场的主要限制因素。对于製造商和服务提供者来说,遵守各种法规和标准,尤其是与资料保护和隐私相关的法规和标准极为困难。满足这些要求不仅会增加成本,还会增加开发和部署生物识别卡解决方案的复杂性。资料保护和隐私法规在全球范围内变得越来越严格,欧洲有 GDPR 等框架,其他地区也有类似法规。这些法规通常要求使用者明确同意收集和使用生物识别资料、储存和处理此类资料的严格安全措施以及有关资料保留和删除的明确政策。确保遵守这些法规需要在技术、基础设施和法律专业知识方面进行大量投资。
非接触式付款技术的日益普及正在推动对将非接触式付款功能与安全身份验证方法相结合的生物识别卡的需求。这为製造商提供了开发创新解决方案的机会,以满足消费者和企业对更快、更方便的支付方式不断变化的需求。生物识别卡提供无缝、无摩擦的支付体验。使用者只需刷卡即可使用指纹或其他生物识别技术验证身份,无需记住密码或携带额外的身份验证设备。这种便利性可能会增加重视交易效率的消费者的采用。此外,製造商有机会透过创新功能和设计来使他们的产品脱颖而出。透过投资研发,公司可以增强多模态生物识别(结合多个生物识别因素进行身分验证)、自适应身分验证(根据风险因素调整安全等级)、安全性和透明度,并可透过与其他功能整合等高级功能来创建生物识别卡。
相关人员的主要利益
- 本报告对 2022-2032 年生物识别卡市场分析的细分市场、当前趋势、估计和动态进行了定量分析,并确定了生物识别卡市场的有前景的机会。
- 我们提供市场研究以及与市场驱动因素、市场限制和市场机会相关的资讯。
- 波特的五力分析揭示了买家和供应商的潜力,帮助相关人员做出利润驱动的业务决策并加强供应商和买家网路。
- 对生物识别卡市场细分的详细分析有助于识别市场机会。
- 每个地区的主要国家都根据其对全球市场的收益贡献绘製了地图。
- 市场公司定位有助于基准化分析并提供对市场公司当前地位的清晰了解。
- 该报告包括对区域和全球生物识别卡市场趋势、主要企业、细分市场、应用领域和市场成长策略的分析。
使用此报告可以进行报告客製化(请联络销售人员以了解额外费用和时间表)
- 产品基准/产品规格及应用
- 按地区分類的新参与企业
- 科技趋势分析
- 公司市场占有率分析:依产品/区隔市场
- 新产品开发/主要企业产品矩阵
- 国家、区域和全球各级的患者/流行病学资料
- 监管指引
- 根据客户兴趣新增其他公司简介
- 按国家或地区进行的附加分析 – 市场规模和预测
- 十字交叉细分市场分析 - 市场规模与预测
- 公司简介的扩充列表
- 历史市场资料
- 主要企业详细资料(Excel 格式,包括位置、联络资讯、供应商/供应商网路等)
- 客户/消费者/原料供应商名单 - 价值链分析
- 全球/区域/国家层级公司的市场占有率分析
- SWOT分析
目录
第一章简介
第 2 章执行摘要
第三章市场概况
- 市场定义和范围
- 主要发现
- 影响因素
- 主要投资机会
- 波特五力分析
- 市场动态
- 促进因素
- 抑制因素
- 机会
- 平均售价
- 市场占有率分析
- 品牌占有率分析
- 贸易资料分析
- 产品消费
- 价值链分析
- 关键监管分析
- 专利情况
- 赎回场景
- 监管指引
- 主要企业详情
第四章生物识别卡市场:依应用分类
- 概述
- 付款
- 存取控制
- 其他的
第五章生物识别卡市场:依最终用户划分
- 概述
- BFSI
- 零售
- 政府机关
- 卫生保健
- 其他的
第六章生物识别卡市场:按地区
- 概述
- 北美洲
- 美国
- 加拿大
- 墨西哥
- 欧洲
- 德国
- 英国
- 法国
- 西班牙
- 义大利
- 其他的
- 亚太地区
- 中国
- 日本
- 印度
- 韩国
- 澳洲
- 其他的
- 拉丁美洲/中东/非洲
- 巴西
- 阿拉伯聯合大公国
- 沙乌地阿拉伯
- 南非
- 其他的
第七章 竞争格局
- 介绍
- 关键成功策略
- 10家主要企业产品图谱
- 竞争对手仪表板
- 竞争热图
- 主要企业定位(2022年)
第八章 公司简介
- Fingerprint Cards AB
- IDEMIA
- AUSTRIACARD HOLDINGS AG
- IDEX Biometrics ASA
- Thales
- Zwipe
- HID Global
- CardLogix Corporation
- SmartMetric Inc.
- Samsung
The global biometric cards market is anticipated to reach $89 billion by 2032, growing from $12.6 billion in 2022 at a CAGR of 22.4% from 2023 to 2032.
Biometric cards are smart cards that incorporate biometric technology to authenticate the identity of the cardholder. These cards typically contain embedded biometric data, such as fingerprints, iris patterns, or facial features, which are used to verify the identity of the cardholder when the card is used for various purposes, such as access control, financial transactions, or identification. Biometric cards enhance security by providing a more reliable means of authentication compared to traditional methods like passwords or PINs, as biometric data is unique to each individual and difficult to forge or steal.
Biometric cards simplify the authentication process by replacing traditional methods like passwords or PINs with biometric data such as fingerprints or iris scans. This streamlines the user experience, eliminating the need to remember multiple passwords or carry additional authentication devices. With biometric cards, transactions can be completed more quickly since users only need to present their card and verify their identity with a quick biometric scan. This speed is particularly valuable in environments where efficiency is crucial, such as retail stores, transportation hubs, or access control systems. Biometric cards can be integrated into existing payment systems, access control systems, and identity verification processes with relative ease. This versatility makes them suitable for a wide range of applications, from financial services to physical security and beyond. As biometric technology becomes more commonplace in everyday devices like smartphones and laptops, consumers are increasingly comfortable with the idea of using biometrics for authentication. Biometric cards capitalize on this growing acceptance, offering a familiar and user-friendly experience.
Regulatory hurdles indeed act as a significant restraint in the biometric cards market. Compliance with various regulations and standards, particularly those related to data protection and privacy, can be quite challenging for manufacturers and service providers. Meeting these requirements not only adds to the cost but also increases the complexity of developing and deploying biometric card solutions. Regulations regarding data protection and privacy are becoming increasingly stringent worldwide, with frameworks like GDPR in Europe and similar regulations in other regions. These regulations often require explicit consent from users for collecting and using their biometric data, strict security measures for storing and processing such data, and clear policies on data retention and deletion. Ensuring compliance with these regulations requires significant investments in technology, infrastructure, and legal expertise.
The growing adoption of contactless payment technologies is driving demand for biometric cards that combine contactless payment capabilities with secure authentication methods. This presents an opportunity for manufacturers to develop innovative solutions that cater to the evolving needs of consumers and businesses seeking faster, more convenient payment options. Biometric cards offer a seamless and frictionless payment experience. Users can simply tap their card and verify their identity with a fingerprint or other biometric, eliminating the need to remember PINs or carry additional authentication devices. This convenience can drive adoption among consumers who value efficiency in their transactions. Moreover, manufacturers have the opportunity to differentiate their offerings through innovative features and designs. By investing in R&D, companies can create biometric cards with advanced features such as multi-modal biometrics (combining multiple biometric factors for authentication), adaptive authentication (adjusting security levels based on risk factors), and integration with other emerging technologies like blockchain for enhanced security and transparency.
The key players profiled in this report include Fingerprint Cards AB, IDEMIA, AUSTRIACARD HOLDINGS AG, IDEX Biometrics ASA, Thales, Zwipe, HID Global, CardLogix Corporation, SmartMetric Inc., and Samsung. The market players are continuously striving to achieve a dominant position in this competitive market using strategies such as product innovation and development of biometric cards.
Key Benefits For Stakeholders
- This report provides a quantitative analysis of the market segments, current trends, estimations, and dynamics of the biometric cards market analysis from 2022 to 2032 to identify the prevailing biometric cards market opportunities.
- The market research is offered along with information related to key drivers, restraints, and opportunities.
- Porter's five forces analysis highlights the potency of buyers and suppliers to enable stakeholders make profit-oriented business decisions and strengthen their supplier-buyer network.
- In-depth analysis of the biometric cards market segmentation assists to determine the prevailing market opportunities.
- Major countries in each region are mapped according to their revenue contribution to the global market.
- Market player positioning facilitates benchmarking and provides a clear understanding of the present position of the market players.
- The report includes the analysis of the regional as well as global biometric cards market trends, key players, market segments, application areas, and market growth strategies.
Additional benefits you will get with this purchase are:
- Quarterly Update and* (only available with a corporate license, on listed price)
- 5 additional Company Profile of client Choice pre- or Post-purchase, as a free update.
- Free Upcoming Version on the Purchase of Five and Enterprise User License.
- 16 analyst hours of support* (post-purchase, if you find additional data requirements upon review of the report, you may receive support amounting to 16 analyst hours to solve questions, and post-sale queries)
- 15% Free Customization* (in case the scope or segment of the report does not match your requirements, 15% is equivalent to 3 working days of free work, applicable once)
- Free data Pack on the Five and Enterprise User License. (Excel version of the report)
- Free Updated report if the report is 6-12 months old or older.
- 24-hour priority response*
- Free Industry updates and white papers.
Possible Customization with this report (with additional cost and timeline, please talk to the sales executive to know more)
- Product Benchmarking / Product specification and applications
- Upcoming/New Entrant by Regions
- Technology Trend Analysis
- Market share analysis of players by products/segments
- New Product Development/ Product Matrix of Key Players
- Patient/epidemiology data at country, region, global level
- Regulatory Guidelines
- Additional company profiles with specific to client's interest
- Additional country or region analysis- market size and forecast
- Criss-cross segment analysis- market size and forecast
- Expanded list for Company Profiles
- Historic market data
- Key player details (including location, contact details, supplier/vendor network etc. in excel format)
- List of customers/consumers/raw material suppliers- value chain analysis
- Market share analysis of players at global/region/country level
- SWOT Analysis
Key Market Segments
By End User
- BFSI
- Retail
- Government
- Healthcare
- Others
By Application
- Payments
- Access Control
- Others
By Region
- North America
- U.S.
- Canada
- Mexico
- Europe
- Germany
- UK
- France
- Spain
- Italy
- Rest of Europe
- Asia-Pacific
- China
- Japan
- India
- South Korea
- Australia
- Rest of Asia-Pacific
- LAMEA
- Brazil
- United Arab Emirates
- Saudi Arabia
- South Africa
- Rest of LAMEA
Key Market Players:
- Fingerprint Cards AB
- IDEMIA
- AUSTRIACARD HOLDINGS AG
- IDEX Biometrics ASA
- Thales
- Zwipe
- HID Global
- CardLogix Corporation
- SmartMetric Inc.
- Samsung
TABLE OF CONTENTS
CHAPTER 1: INTRODUCTION
- 1.1. Report description
- 1.2. Key market segments
- 1.3. Key benefits to the stakeholders
- 1.4. Research methodology
- 1.4.1. Primary research
- 1.4.2. Secondary research
- 1.4.3. Analyst tools and models
CHAPTER 2: EXECUTIVE SUMMARY
- 2.1. CXO perspective
CHAPTER 3: MARKET OVERVIEW
- 3.1. Market definition and scope
- 3.2. Key findings
- 3.2.1. Top impacting factors
- 3.2.2. Top investment pockets
- 3.3. Porter's five forces analysis
- 3.4. Market dynamics
- 3.4.1. Drivers
- 3.4.2. Restraints
- 3.4.3. Opportunities
- 3.5. Average Selling Price
- 3.6. Market Share Analysis
- 3.7. Brand Share Analysis
- 3.8. Trade Data Analysis
- 3.9. Product Consumption
- 3.10. Value Chain Analysis
- 3.11. Key Regulation Analysis
- 3.12. Patent Landscape
- 3.13. Reimbursement Scenario
- 3.14. Regulatory Guidelines
- 3.15. Key Players Details
CHAPTER 4: BIOMETRIC CARDS MARKET, BY APPLICATION
- 4.1. Overview
- 4.1.1. Market size and forecast
- 4.2. Payments
- 4.2.1. Key market trends, growth factors and opportunities
- 4.2.2. Market size and forecast, by region
- 4.2.3. Market share analysis by country
- 4.3. Access Control
- 4.3.1. Key market trends, growth factors and opportunities
- 4.3.2. Market size and forecast, by region
- 4.3.3. Market share analysis by country
- 4.4. Others
- 4.4.1. Key market trends, growth factors and opportunities
- 4.4.2. Market size and forecast, by region
- 4.4.3. Market share analysis by country
CHAPTER 5: BIOMETRIC CARDS MARKET, BY END USER
- 5.1. Overview
- 5.1.1. Market size and forecast
- 5.2. BFSI
- 5.2.1. Key market trends, growth factors and opportunities
- 5.2.2. Market size and forecast, by region
- 5.2.3. Market share analysis by country
- 5.3. Retail
- 5.3.1. Key market trends, growth factors and opportunities
- 5.3.2. Market size and forecast, by region
- 5.3.3. Market share analysis by country
- 5.4. Government
- 5.4.1. Key market trends, growth factors and opportunities
- 5.4.2. Market size and forecast, by region
- 5.4.3. Market share analysis by country
- 5.5. Healthcare
- 5.5.1. Key market trends, growth factors and opportunities
- 5.5.2. Market size and forecast, by region
- 5.5.3. Market share analysis by country
- 5.6. Others
- 5.6.1. Key market trends, growth factors and opportunities
- 5.6.2. Market size and forecast, by region
- 5.6.3. Market share analysis by country
CHAPTER 6: BIOMETRIC CARDS MARKET, BY REGION
- 6.1. Overview
- 6.1.1. Market size and forecast By Region
- 6.2. North America
- 6.2.1. Key market trends, growth factors and opportunities
- 6.2.2. Market size and forecast, by Application
- 6.2.3. Market size and forecast, by End User
- 6.2.4. Market size and forecast, by country
- 6.2.4.1. U.S.
- 6.2.4.1.1. Market size and forecast, by Application
- 6.2.4.1.2. Market size and forecast, by End User
- 6.2.4.2. Canada
- 6.2.4.2.1. Market size and forecast, by Application
- 6.2.4.2.2. Market size and forecast, by End User
- 6.2.4.3. Mexico
- 6.2.4.3.1. Market size and forecast, by Application
- 6.2.4.3.2. Market size and forecast, by End User
- 6.3. Europe
- 6.3.1. Key market trends, growth factors and opportunities
- 6.3.2. Market size and forecast, by Application
- 6.3.3. Market size and forecast, by End User
- 6.3.4. Market size and forecast, by country
- 6.3.4.1. Germany
- 6.3.4.1.1. Market size and forecast, by Application
- 6.3.4.1.2. Market size and forecast, by End User
- 6.3.4.2. UK
- 6.3.4.2.1. Market size and forecast, by Application
- 6.3.4.2.2. Market size and forecast, by End User
- 6.3.4.3. France
- 6.3.4.3.1. Market size and forecast, by Application
- 6.3.4.3.2. Market size and forecast, by End User
- 6.3.4.4. Spain
- 6.3.4.4.1. Market size and forecast, by Application
- 6.3.4.4.2. Market size and forecast, by End User
- 6.3.4.5. Italy
- 6.3.4.5.1. Market size and forecast, by Application
- 6.3.4.5.2. Market size and forecast, by End User
- 6.3.4.6. Rest of Europe
- 6.3.4.6.1. Market size and forecast, by Application
- 6.3.4.6.2. Market size and forecast, by End User
- 6.4. Asia-Pacific
- 6.4.1. Key market trends, growth factors and opportunities
- 6.4.2. Market size and forecast, by Application
- 6.4.3. Market size and forecast, by End User
- 6.4.4. Market size and forecast, by country
- 6.4.4.1. China
- 6.4.4.1.1. Market size and forecast, by Application
- 6.4.4.1.2. Market size and forecast, by End User
- 6.4.4.2. Japan
- 6.4.4.2.1. Market size and forecast, by Application
- 6.4.4.2.2. Market size and forecast, by End User
- 6.4.4.3. India
- 6.4.4.3.1. Market size and forecast, by Application
- 6.4.4.3.2. Market size and forecast, by End User
- 6.4.4.4. South Korea
- 6.4.4.4.1. Market size and forecast, by Application
- 6.4.4.4.2. Market size and forecast, by End User
- 6.4.4.5. Australia
- 6.4.4.5.1. Market size and forecast, by Application
- 6.4.4.5.2. Market size and forecast, by End User
- 6.4.4.6. Rest of Asia-Pacific
- 6.4.4.6.1. Market size and forecast, by Application
- 6.4.4.6.2. Market size and forecast, by End User
- 6.5. LAMEA
- 6.5.1. Key market trends, growth factors and opportunities
- 6.5.2. Market size and forecast, by Application
- 6.5.3. Market size and forecast, by End User
- 6.5.4. Market size and forecast, by country
- 6.5.4.1. Brazil
- 6.5.4.1.1. Market size and forecast, by Application
- 6.5.4.1.2. Market size and forecast, by End User
- 6.5.4.2. United Arab Emirates
- 6.5.4.2.1. Market size and forecast, by Application
- 6.5.4.2.2. Market size and forecast, by End User
- 6.5.4.3. Saudi Arabia
- 6.5.4.3.1. Market size and forecast, by Application
- 6.5.4.3.2. Market size and forecast, by End User
- 6.5.4.4. South Africa
- 6.5.4.4.1. Market size and forecast, by Application
- 6.5.4.4.2. Market size and forecast, by End User
- 6.5.4.5. Rest of LAMEA
- 6.5.4.5.1. Market size and forecast, by Application
- 6.5.4.5.2. Market size and forecast, by End User
CHAPTER 7: COMPETITIVE LANDSCAPE
- 7.1. Introduction
- 7.2. Top winning strategies
- 7.3. Product mapping of top 10 player
- 7.4. Competitive dashboard
- 7.5. Competitive heatmap
- 7.6. Top player positioning, 2022
CHAPTER 8: COMPANY PROFILES
- 8.1. Fingerprint Cards AB
- 8.1.1. Company overview
- 8.1.2. Key executives
- 8.1.3. Company snapshot
- 8.1.4. Operating business segments
- 8.1.5. Product portfolio
- 8.1.6. Business performance
- 8.1.7. Key strategic moves and developments
- 8.2. IDEMIA
- 8.2.1. Company overview
- 8.2.2. Key executives
- 8.2.3. Company snapshot
- 8.2.4. Operating business segments
- 8.2.5. Product portfolio
- 8.2.6. Business performance
- 8.2.7. Key strategic moves and developments
- 8.3. AUSTRIACARD HOLDINGS AG
- 8.3.1. Company overview
- 8.3.2. Key executives
- 8.3.3. Company snapshot
- 8.3.4. Operating business segments
- 8.3.5. Product portfolio
- 8.3.6. Business performance
- 8.3.7. Key strategic moves and developments
- 8.4. IDEX Biometrics ASA
- 8.4.1. Company overview
- 8.4.2. Key executives
- 8.4.3. Company snapshot
- 8.4.4. Operating business segments
- 8.4.5. Product portfolio
- 8.4.6. Business performance
- 8.4.7. Key strategic moves and developments
- 8.5. Thales
- 8.5.1. Company overview
- 8.5.2. Key executives
- 8.5.3. Company snapshot
- 8.5.4. Operating business segments
- 8.5.5. Product portfolio
- 8.5.6. Business performance
- 8.5.7. Key strategic moves and developments
- 8.6. Zwipe
- 8.6.1. Company overview
- 8.6.2. Key executives
- 8.6.3. Company snapshot
- 8.6.4. Operating business segments
- 8.6.5. Product portfolio
- 8.6.6. Business performance
- 8.6.7. Key strategic moves and developments
- 8.7. HID Global
- 8.7.1. Company overview
- 8.7.2. Key executives
- 8.7.3. Company snapshot
- 8.7.4. Operating business segments
- 8.7.5. Product portfolio
- 8.7.6. Business performance
- 8.7.7. Key strategic moves and developments
- 8.8. CardLogix Corporation
- 8.8.1. Company overview
- 8.8.2. Key executives
- 8.8.3. Company snapshot
- 8.8.4. Operating business segments
- 8.8.5. Product portfolio
- 8.8.6. Business performance
- 8.8.7. Key strategic moves and developments
- 8.9. SmartMetric Inc.
- 8.9.1. Company overview
- 8.9.2. Key executives
- 8.9.3. Company snapshot
- 8.9.4. Operating business segments
- 8.9.5. Product portfolio
- 8.9.6. Business performance
- 8.9.7. Key strategic moves and developments
- 8.10. Samsung
- 8.10.1. Company overview
- 8.10.2. Key executives
- 8.10.3. Company snapshot
- 8.10.4. Operating business segments
- 8.10.5. Product portfolio
- 8.10.6. Business performance
- 8.10.7. Key strategic moves and developments
LIST OF TABLES
- TABLE 01. GLOBAL BIOMETRIC CARDS MARKET, BY APPLICATION, 2022-2032 ($MILLION)
- TABLE 02. BIOMETRIC CARDS MARKET FOR PAYMENTS, BY REGION, 2022-2032 ($MILLION)
- TABLE 03. BIOMETRIC CARDS MARKET FOR ACCESS CONTROL, BY REGION, 2022-2032 ($MILLION)
- TABLE 04. BIOMETRIC CARDS MARKET FOR OTHERS, BY REGION, 2022-2032 ($MILLION)
- TABLE 05. GLOBAL BIOMETRIC CARDS MARKET, BY END USER, 2022-2032 ($MILLION)
- TABLE 06. BIOMETRIC CARDS MARKET FOR BFSI, BY REGION, 2022-2032 ($MILLION)
- TABLE 07. BIOMETRIC CARDS MARKET FOR RETAIL, BY REGION, 2022-2032 ($MILLION)
- TABLE 08. BIOMETRIC CARDS MARKET FOR GOVERNMENT, BY REGION, 2022-2032 ($MILLION)
- TABLE 09. BIOMETRIC CARDS MARKET FOR HEALTHCARE, BY REGION, 2022-2032 ($MILLION)
- TABLE 10. BIOMETRIC CARDS MARKET FOR OTHERS, BY REGION, 2022-2032 ($MILLION)
- TABLE 11. BIOMETRIC CARDS MARKET, BY REGION, 2022-2032 ($MILLION)
- TABLE 12. NORTH AMERICA BIOMETRIC CARDS MARKET, BY APPLICATION, 2022-2032 ($MILLION)
- TABLE 13. NORTH AMERICA BIOMETRIC CARDS MARKET, BY END USER, 2022-2032 ($MILLION)
- TABLE 14. NORTH AMERICA BIOMETRIC CARDS MARKET, BY COUNTRY, 2022-2032 ($MILLION)
- TABLE 15. U.S. BIOMETRIC CARDS MARKET, BY APPLICATION, 2022-2032 ($MILLION)
- TABLE 16. U.S. BIOMETRIC CARDS MARKET, BY END USER, 2022-2032 ($MILLION)
- TABLE 17. CANADA BIOMETRIC CARDS MARKET, BY APPLICATION, 2022-2032 ($MILLION)
- TABLE 18. CANADA BIOMETRIC CARDS MARKET, BY END USER, 2022-2032 ($MILLION)
- TABLE 19. MEXICO BIOMETRIC CARDS MARKET, BY APPLICATION, 2022-2032 ($MILLION)
- TABLE 20. MEXICO BIOMETRIC CARDS MARKET, BY END USER, 2022-2032 ($MILLION)
- TABLE 21. EUROPE BIOMETRIC CARDS MARKET, BY APPLICATION, 2022-2032 ($MILLION)
- TABLE 22. EUROPE BIOMETRIC CARDS MARKET, BY END USER, 2022-2032 ($MILLION)
- TABLE 23. EUROPE BIOMETRIC CARDS MARKET, BY COUNTRY, 2022-2032 ($MILLION)
- TABLE 24. GERMANY BIOMETRIC CARDS MARKET, BY APPLICATION, 2022-2032 ($MILLION)
- TABLE 25. GERMANY BIOMETRIC CARDS MARKET, BY END USER, 2022-2032 ($MILLION)
- TABLE 26. UK BIOMETRIC CARDS MARKET, BY APPLICATION, 2022-2032 ($MILLION)
- TABLE 27. UK BIOMETRIC CARDS MARKET, BY END USER, 2022-2032 ($MILLION)
- TABLE 28. FRANCE BIOMETRIC CARDS MARKET, BY APPLICATION, 2022-2032 ($MILLION)
- TABLE 29. FRANCE BIOMETRIC CARDS MARKET, BY END USER, 2022-2032 ($MILLION)
- TABLE 30. SPAIN BIOMETRIC CARDS MARKET, BY APPLICATION, 2022-2032 ($MILLION)
- TABLE 31. SPAIN BIOMETRIC CARDS MARKET, BY END USER, 2022-2032 ($MILLION)
- TABLE 32. ITALY BIOMETRIC CARDS MARKET, BY APPLICATION, 2022-2032 ($MILLION)
- TABLE 33. ITALY BIOMETRIC CARDS MARKET, BY END USER, 2022-2032 ($MILLION)
- TABLE 34. REST OF EUROPE BIOMETRIC CARDS MARKET, BY APPLICATION, 2022-2032 ($MILLION)
- TABLE 35. REST OF EUROPE BIOMETRIC CARDS MARKET, BY END USER, 2022-2032 ($MILLION)
- TABLE 36. ASIA-PACIFIC BIOMETRIC CARDS MARKET, BY APPLICATION, 2022-2032 ($MILLION)
- TABLE 37. ASIA-PACIFIC BIOMETRIC CARDS MARKET, BY END USER, 2022-2032 ($MILLION)
- TABLE 38. ASIA-PACIFIC BIOMETRIC CARDS MARKET, BY COUNTRY, 2022-2032 ($MILLION)
- TABLE 39. CHINA BIOMETRIC CARDS MARKET, BY APPLICATION, 2022-2032 ($MILLION)
- TABLE 40. CHINA BIOMETRIC CARDS MARKET, BY END USER, 2022-2032 ($MILLION)
- TABLE 41. JAPAN BIOMETRIC CARDS MARKET, BY APPLICATION, 2022-2032 ($MILLION)
- TABLE 42. JAPAN BIOMETRIC CARDS MARKET, BY END USER, 2022-2032 ($MILLION)
- TABLE 43. INDIA BIOMETRIC CARDS MARKET, BY APPLICATION, 2022-2032 ($MILLION)
- TABLE 44. INDIA BIOMETRIC CARDS MARKET, BY END USER, 2022-2032 ($MILLION)
- TABLE 45. SOUTH KOREA BIOMETRIC CARDS MARKET, BY APPLICATION, 2022-2032 ($MILLION)
- TABLE 46. SOUTH KOREA BIOMETRIC CARDS MARKET, BY END USER, 2022-2032 ($MILLION)
- TABLE 47. AUSTRALIA BIOMETRIC CARDS MARKET, BY APPLICATION, 2022-2032 ($MILLION)
- TABLE 48. AUSTRALIA BIOMETRIC CARDS MARKET, BY END USER, 2022-2032 ($MILLION)
- TABLE 49. REST OF ASIA-PACIFIC BIOMETRIC CARDS MARKET, BY APPLICATION, 2022-2032 ($MILLION)
- TABLE 50. REST OF ASIA-PACIFIC BIOMETRIC CARDS MARKET, BY END USER, 2022-2032 ($MILLION)
- TABLE 51. LAMEA BIOMETRIC CARDS MARKET, BY APPLICATION, 2022-2032 ($MILLION)
- TABLE 52. LAMEA BIOMETRIC CARDS MARKET, BY END USER, 2022-2032 ($MILLION)
- TABLE 53. LAMEA BIOMETRIC CARDS MARKET, BY COUNTRY, 2022-2032 ($MILLION)
- TABLE 54. BRAZIL BIOMETRIC CARDS MARKET, BY APPLICATION, 2022-2032 ($MILLION)
- TABLE 55. BRAZIL BIOMETRIC CARDS MARKET, BY END USER, 2022-2032 ($MILLION)
- TABLE 56. UNITED ARAB EMIRATES BIOMETRIC CARDS MARKET, BY APPLICATION, 2022-2032 ($MILLION)
- TABLE 57. UNITED ARAB EMIRATES BIOMETRIC CARDS MARKET, BY END USER, 2022-2032 ($MILLION)
- TABLE 58. SAUDI ARABIA BIOMETRIC CARDS MARKET, BY APPLICATION, 2022-2032 ($MILLION)
- TABLE 59. SAUDI ARABIA BIOMETRIC CARDS MARKET, BY END USER, 2022-2032 ($MILLION)
- TABLE 60. SOUTH AFRICA BIOMETRIC CARDS MARKET, BY APPLICATION, 2022-2032 ($MILLION)
- TABLE 61. SOUTH AFRICA BIOMETRIC CARDS MARKET, BY END USER, 2022-2032 ($MILLION)
- TABLE 62. REST OF LAMEA BIOMETRIC CARDS MARKET, BY APPLICATION, 2022-2032 ($MILLION)
- TABLE 63. REST OF LAMEA BIOMETRIC CARDS MARKET, BY END USER, 2022-2032 ($MILLION)
- TABLE 64. FINGERPRINT CARDS AB: KEY EXECUTIVES
- TABLE 65. FINGERPRINT CARDS AB: COMPANY SNAPSHOT
- TABLE 66. FINGERPRINT CARDS AB: PRODUCT SEGMENTS
- TABLE 67. FINGERPRINT CARDS AB: SERVICE SEGMENTS
- TABLE 68. FINGERPRINT CARDS AB: PRODUCT PORTFOLIO
- TABLE 69. FINGERPRINT CARDS AB: KEY STRATEGIES
- TABLE 70. IDEMIA: KEY EXECUTIVES
- TABLE 71. IDEMIA: COMPANY SNAPSHOT
- TABLE 72. IDEMIA: PRODUCT SEGMENTS
- TABLE 73. IDEMIA: SERVICE SEGMENTS
- TABLE 74. IDEMIA: PRODUCT PORTFOLIO
- TABLE 75. IDEMIA: KEY STRATEGIES
- TABLE 76. AUSTRIACARD HOLDINGS AG: KEY EXECUTIVES
- TABLE 77. AUSTRIACARD HOLDINGS AG: COMPANY SNAPSHOT
- TABLE 78. AUSTRIACARD HOLDINGS AG: PRODUCT SEGMENTS
- TABLE 79. AUSTRIACARD HOLDINGS AG: SERVICE SEGMENTS
- TABLE 80. AUSTRIACARD HOLDINGS AG: PRODUCT PORTFOLIO
- TABLE 81. AUSTRIACARD HOLDINGS AG: KEY STRATEGIES
- TABLE 82. IDEX BIOMETRICS ASA: KEY EXECUTIVES
- TABLE 83. IDEX BIOMETRICS ASA: COMPANY SNAPSHOT
- TABLE 84. IDEX BIOMETRICS ASA: PRODUCT SEGMENTS
- TABLE 85. IDEX BIOMETRICS ASA: SERVICE SEGMENTS
- TABLE 86. IDEX BIOMETRICS ASA: PRODUCT PORTFOLIO
- TABLE 87. IDEX BIOMETRICS ASA: KEY STRATEGIES
- TABLE 88. THALES: KEY EXECUTIVES
- TABLE 89. THALES: COMPANY SNAPSHOT
- TABLE 90. THALES: PRODUCT SEGMENTS
- TABLE 91. THALES: SERVICE SEGMENTS
- TABLE 92. THALES: PRODUCT PORTFOLIO
- TABLE 93. THALES: KEY STRATEGIES
- TABLE 94. ZWIPE: KEY EXECUTIVES
- TABLE 95. ZWIPE: COMPANY SNAPSHOT
- TABLE 96. ZWIPE: PRODUCT SEGMENTS
- TABLE 97. ZWIPE: SERVICE SEGMENTS
- TABLE 98. ZWIPE: PRODUCT PORTFOLIO
- TABLE 99. ZWIPE: KEY STRATEGIES
- TABLE 100. HID GLOBAL: KEY EXECUTIVES
- TABLE 101. HID GLOBAL: COMPANY SNAPSHOT
- TABLE 102. HID GLOBAL: PRODUCT SEGMENTS
- TABLE 103. HID GLOBAL: SERVICE SEGMENTS
- TABLE 104. HID GLOBAL: PRODUCT PORTFOLIO
- TABLE 105. HID GLOBAL: KEY STRATEGIES
- TABLE 106. CARDLOGIX CORPORATION: KEY EXECUTIVES
- TABLE 107. CARDLOGIX CORPORATION: COMPANY SNAPSHOT
- TABLE 108. CARDLOGIX CORPORATION: PRODUCT SEGMENTS
- TABLE 109. CARDLOGIX CORPORATION: SERVICE SEGMENTS
- TABLE 110. CARDLOGIX CORPORATION: PRODUCT PORTFOLIO
- TABLE 111. CARDLOGIX CORPORATION: KEY STRATEGIES
- TABLE 112. SMARTMETRIC INC.: KEY EXECUTIVES
- TABLE 113. SMARTMETRIC INC.: COMPANY SNAPSHOT
- TABLE 114. SMARTMETRIC INC.: PRODUCT SEGMENTS
- TABLE 115. SMARTMETRIC INC.: SERVICE SEGMENTS
- TABLE 116. SMARTMETRIC INC.: PRODUCT PORTFOLIO
- TABLE 117. SMARTMETRIC INC.: KEY STRATEGIES
- TABLE 118. SAMSUNG: KEY EXECUTIVES
- TABLE 119. SAMSUNG: COMPANY SNAPSHOT
- TABLE 120. SAMSUNG: PRODUCT SEGMENTS
- TABLE 121. SAMSUNG: SERVICE SEGMENTS
- TABLE 122. SAMSUNG: PRODUCT PORTFOLIO
- TABLE 123. SAMSUNG: KEY STRATEGIES
LIST OF FIGURES
- FIGURE 01. BIOMETRIC CARDS MARKET, 2022-2032
- FIGURE 02. SEGMENTATION OF BIOMETRIC CARDS MARKET,2022-2032
- FIGURE 03. TOP IMPACTING FACTORS IN BIOMETRIC CARDS MARKET
- FIGURE 04. TOP INVESTMENT POCKETS IN BIOMETRIC CARDS MARKET (2023-2032)
- FIGURE 05. BARGAINING POWER OF SUPPLIERS
- FIGURE 06. BARGAINING POWER OF BUYERS
- FIGURE 07. THREAT OF SUBSTITUTION
- FIGURE 08. THREAT OF SUBSTITUTION
- FIGURE 09. COMPETITIVE RIVALRY
- FIGURE 10. GLOBAL BIOMETRIC CARDS MARKET:DRIVERS, RESTRAINTS AND OPPORTUNITIES
- FIGURE 11. IMPACT OF KEY REGULATION: BIOMETRIC CARDS MARKET
- FIGURE 12. PATENT ANALYSIS BY COMPANY
- FIGURE 13. PATENT ANALYSIS BY COUNTRY
- FIGURE 14. BIOMETRIC CARDS MARKET, BY APPLICATION, 2022 AND 2032(%)
- FIGURE 15. COMPARATIVE SHARE ANALYSIS OF BIOMETRIC CARDS MARKET FOR PAYMENTS, BY COUNTRY 2022 AND 2032(%)
- FIGURE 16. COMPARATIVE SHARE ANALYSIS OF BIOMETRIC CARDS MARKET FOR ACCESS CONTROL, BY COUNTRY 2022 AND 2032(%)
- FIGURE 17. COMPARATIVE SHARE ANALYSIS OF BIOMETRIC CARDS MARKET FOR OTHERS, BY COUNTRY 2022 AND 2032(%)
- FIGURE 18. BIOMETRIC CARDS MARKET, BY END USER, 2022 AND 2032(%)
- FIGURE 19. COMPARATIVE SHARE ANALYSIS OF BIOMETRIC CARDS MARKET FOR BFSI, BY COUNTRY 2022 AND 2032(%)
- FIGURE 20. COMPARATIVE SHARE ANALYSIS OF BIOMETRIC CARDS MARKET FOR RETAIL, BY COUNTRY 2022 AND 2032(%)
- FIGURE 21. COMPARATIVE SHARE ANALYSIS OF BIOMETRIC CARDS MARKET FOR GOVERNMENT, BY COUNTRY 2022 AND 2032(%)
- FIGURE 22. COMPARATIVE SHARE ANALYSIS OF BIOMETRIC CARDS MARKET FOR HEALTHCARE, BY COUNTRY 2022 AND 2032(%)
- FIGURE 23. COMPARATIVE SHARE ANALYSIS OF BIOMETRIC CARDS MARKET FOR OTHERS, BY COUNTRY 2022 AND 2032(%)
- FIGURE 24. BIOMETRIC CARDS MARKET BY REGION, 2022 AND 2032(%)
- FIGURE 25. U.S. BIOMETRIC CARDS MARKET, 2022-2032 ($MILLION)
- FIGURE 26. CANADA BIOMETRIC CARDS MARKET, 2022-2032 ($MILLION)
- FIGURE 27. MEXICO BIOMETRIC CARDS MARKET, 2022-2032 ($MILLION)
- FIGURE 28. GERMANY BIOMETRIC CARDS MARKET, 2022-2032 ($MILLION)
- FIGURE 29. UK BIOMETRIC CARDS MARKET, 2022-2032 ($MILLION)
- FIGURE 30. FRANCE BIOMETRIC CARDS MARKET, 2022-2032 ($MILLION)
- FIGURE 31. SPAIN BIOMETRIC CARDS MARKET, 2022-2032 ($MILLION)
- FIGURE 32. ITALY BIOMETRIC CARDS MARKET, 2022-2032 ($MILLION)
- FIGURE 33. REST OF EUROPE BIOMETRIC CARDS MARKET, 2022-2032 ($MILLION)
- FIGURE 34. CHINA BIOMETRIC CARDS MARKET, 2022-2032 ($MILLION)
- FIGURE 35. JAPAN BIOMETRIC CARDS MARKET, 2022-2032 ($MILLION)
- FIGURE 36. INDIA BIOMETRIC CARDS MARKET, 2022-2032 ($MILLION)
- FIGURE 37. SOUTH KOREA BIOMETRIC CARDS MARKET, 2022-2032 ($MILLION)
- FIGURE 38. AUSTRALIA BIOMETRIC CARDS MARKET, 2022-2032 ($MILLION)
- FIGURE 39. REST OF ASIA-PACIFIC BIOMETRIC CARDS MARKET, 2022-2032 ($MILLION)
- FIGURE 40. BRAZIL BIOMETRIC CARDS MARKET, 2022-2032 ($MILLION)
- FIGURE 41. UNITED ARAB EMIRATES BIOMETRIC CARDS MARKET, 2022-2032 ($MILLION)
- FIGURE 42. SAUDI ARABIA BIOMETRIC CARDS MARKET, 2022-2032 ($MILLION)
- FIGURE 43. SOUTH AFRICA BIOMETRIC CARDS MARKET, 2022-2032 ($MILLION)
- FIGURE 44. REST OF LAMEA BIOMETRIC CARDS MARKET, 2022-2032 ($MILLION)
- FIGURE 45. TOP WINNING STRATEGIES, BY YEAR
- FIGURE 46. TOP WINNING STRATEGIES, BY DEVELOPMENT
- FIGURE 47. TOP WINNING STRATEGIES, BY COMPANY
- FIGURE 48. PRODUCT MAPPING OF TOP 10 PLAYERS
- FIGURE 49. COMPETITIVE DASHBOARD
- FIGURE 50. COMPETITIVE HEATMAP: BIOMETRIC CARDS MARKET
- FIGURE 51. TOP PLAYER POSITIONING, 2022
 全球机场生物辨识服务市场
 2025年下一代生物辨识技术全球市场报告
 2026 年至 2032 年生物识别市场(按组件、最终用户和地区划分)全球生物辨识市场规模(按技术类型、最终用户、应用、区域范围)预测(至 2025 年)
 步态生物辨识市场:全球 2025-20292025年全球政府生物辨识市场报告2025年生物辨识卡全球市场报告
 全球静脉辨识模组市场:市场占有率和排名、总收入和需求预测(2025-2031)
 军事生物辨识:市场占有率分析、产业趋势与统计、成长预测(2025-2030 年)消费者生物辨识市场占有率分析、产业趋势与统计、成长预测(2025-2030 年)