


 |
市场调查报告书
商品编码
1513388
全球金属天花板市场:按材料、应用和最终用户:机会分析和产业预测(2023-2032)Metal Ceilings Market By Material (Steel, Aluminum, Others), By Application (Interior, Exterior), By End User (Commercial, Education, Transport, Retail, Healthcare, Others): Global Opportunity Analysis and Industry Forecast, 2023-2032 |
||||||
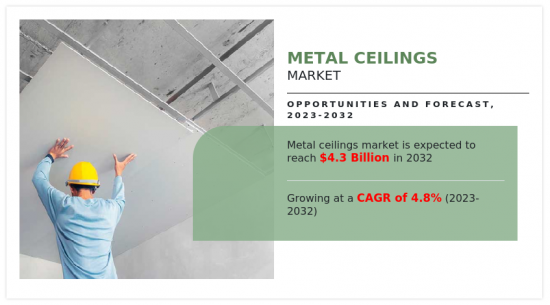
2020年全球金属天花板市场规模为24亿美元,预计2032年将达43亿美元,2023年至2032年复合年增长率为4.8%。
金属天花板是主要由金属组成的天花板系统,经常用于商业环境。金属天花板以其耐用性、防火性和美观灵活性而闻名,有多种饰面、图案和设计。除了现代而优雅的外观外,它还具有易于维护和出色的声学性能等实用优点。
由于全球化,世界人口大幅增加,联合国、世界银行等多个组织估计,世界人口将从2022年的约80亿人增加到2050年的95亿人以上。这可能会增加世界各地对商业建筑的需求,特别是在中国、印度、巴西和南非等开发中国家。此外,人们对金属天花板优点的认识不断提高也推动了市场的成长。自订金属天花板为您的建筑提供经济高效且耐用的解决方案。金属天花板只需最少的维护,使用寿命超过 30 年,可为您节省年度维护成本。
金属天花板具有许多优点,已成为商业环境中的流行选择。其最大的优点是由于坚固的金属材料结构而具有耐用性和使用寿命。此外,金属天花板由于其固有的耐火性而提供了更高的安全性,让您在紧急情况下放心。此外,它们美观,具有多种饰面、图案和设计,可适应各种设计品味和建筑风格。它们也易于清洁和维护,只需最少的维护,从而节省了业主和管理者的时间和精力。此外,金属天花板还有助于提高声学性能,降低商业空间内的噪音水平并创造更舒适的环境。最后,现代时尚的外观给人一种精緻的印象,增强了室内空间的整体美感。然而,原物料价格的波动可能会阻碍市场成长。相反,各地区绿建筑建设的增加为预测期内的市场公司提供了有利的成长机会。
市场细分是按材料、应用、最终用户和区域进行的。依材料划分,市场分为钢、铝等。依用途分为室内用和室外用。依用途分为商业、教育、交通、零售、医疗保健等。从区域来看,分析包括北美、欧洲、亚太地区、拉丁美洲和中东/非洲。在全球市场上营运的主要企业正在采取产品发布等关键策略,以加强其市场拓展并维持激烈的市场竞争。
金属天花板市场报告中介绍的主要企业包括阿姆斯壮世界工业公司、亨特道格拉斯公司、SAS国际公司、洛科威集团(Rockfon)、可耐福(USG公司)、圣戈班(CertainTeed)、OWA天花板系统公司、 Gage公司国际公司、Decoustics公司和廷普罗金属工业公司。
相关人员的主要利益
- 该报告对金属天花板当前和即将到来的市场趋势和动态进行了广泛的分析。
- 建立2020年至2032年关键细分市场的市场预测,并进行详细的市场分析。
- 透过在市场框架中定位关键产品并监控主要竞争对手,对金属天花板市场进行了广泛的分析。
- 综合分析所有地区以确定主要机会。
- 包含2023年至2032年全球金属天花板市场的预测分析。
- 金属天花板市场中主要企业的概况及其策略的全面分析有助于了解金属天花板行业的竞争格局。
使用此报告可以进行报告客製化(请联络销售人员以了解额外费用和时间表)
- 製造能力
- 资本投资明细
- 平均消费支出
- 消费者偏好和产品规格
- 商户利润分析
- 打入市场策略
- 按产品/细分市场分類的公司市场占有率分析
- 根据客户兴趣加入公司简介
- 按国家或地区进行的附加分析 – 市场规模和预测
- 平均售价分析/价位分析
- 品牌占有率分析
- 十字交叉细分市场分析—市场规模与预测
- 公司简介的扩充列表
- 历史市场资料
- 导入/汇出分析/资料
- 主要企业详细资料(Excel 格式,包括位置、联络资讯、供应商/供应商网路等)
- 客户/消费者/原料供应商名单 - 价值链分析
- 全球/区域/国家层级公司的市场占有率分析
- SWOT分析
- 销售市场规模及预测
目录
第一章简介
第 2 章执行摘要
第三章市场概况
- 市场定义和范围
- 主要发现
- 影响因素
- 主要投资机会
- 波特五力分析
- 市场动态
- 促进因素
- 抑制因素
- 机会
第四章金属天花板市场:依材料分类
- 概述
- 钢
- 铝
- 其他的
第五章金属天花板市场:依应用分类
- 概述
- 内部的
- 外部的
第六章金属天花板市场:依最终用户分类
- 概述
- 商业的
- 教育
- 运输
- 零售
- 卫生保健
- 其他的
第七章金属天花板市场:依地区
- 概述
- 北美洲
- 美国
- 加拿大
- 墨西哥
- 欧洲
- 德国
- 法国
- 英国
- 义大利
- 其他的
- 亚太地区
- 中国
- 日本
- 韩国
- 印度
- 其他的
- 拉丁美洲
- 巴西
- 阿根廷
- 哥伦比亚
- 其他的
- 中东/非洲
- 沙乌地阿拉伯
- 阿拉伯聯合大公国
- 奈及利亚
- 埃及
- 其他的
第八章 竞争格局
- 介绍
- 关键成功策略
- 10家主要企业产品图谱
- 竞争对手仪表板
- 竞争热图
- 主要企业定位(2020年)
第九章 公司简介
- Armstrong World Industries, Inc.
- Hunter Douglas AG
- SAS International
- Rockwool group
- Knauf
- Saint-Gobain
- OWA Ceiling Systems
- Gage Corporation International
- Decoustics
- Tincpro Metal Industries
The global Metal Ceilings market size was valued at $2.4 billion in 2020, and is projected to reach $4.3 billion by 2032, registering a CAGR of 4.8% from 2023 to 2032. A metal ceiling is a ceiling system primarily composed of metal, frequently utilized in commercial environments. Renowned for their durability, fire resistance, and aesthetic flexibility, metal ceilings come in various finishes, patterns, and designs. They provide a contemporary and elegant look, along with practical advantages like straightforward maintenance and superior acoustical properties.
The global population along with globalization is rising at a significant rate. Various organizations such as United Nations and The World Bank have estimated that the world population will reach above 9.5 billion in 2050, from about 8 billion in 2022. This will increase the demand for commercial buildings across the world, especially in developing nations such as China. India, Brazil, South Africa, and others. Moreover, a rise in the awareness regarding the benefits of metal ceiling is also driving the market growth. Custom Metal Ceilings provides buildings with a cost-effective and durable solution. Requiring minimal maintenance and boasting a lifespan exceeding 30 years, metal ceiling save on annual maintenance costs.
Metal ceilings provide a multitude of benefits, making them a popular choice in commercial settings. Their foremost advantage lies in their durability and longevity, thanks to the sturdy construction of metal materials. Additionally, metal ceilings offer enhanced safety with their inherent fire resistance properties, providing peace of mind in case of emergencies. Moreover, these ceilings boast aesthetic versatility, offering a wide range of finishes, patterns, and designs to suit various design preferences and architectural styles. They also require minimal maintenance, as they are easy to clean and maintain, saving time and effort for building owners and managers. Furthermore, metal ceilings contribute to improved acoustical performance, helping to reduce noise levels within commercial spaces for a more comfortable environment. Lastly, their modern and stylish appearance adds a touch of sophistication, enhancing the overall aesthetic appeal of the interior space. However, fluctuations in raw material prices may hinder market growth. Contrarily, an increase in the construction of green buildings across various regions offers lucrative growth opportunities for the market player during the forecast period.
The Metal Ceilings market is segmented on the basis of metal type, application end user, and region. By metal type, the market is categorized into galvanized iron, steel, and aluminum. On the basis of application, it is bifurcated into interior and exterior. As per the application, the market is divided into commercial, education, trasport, retail, healthcare, and others. Region wise, the market is analyzed across North America, Europe, Asia-Pacific, Latin America, and Middle East & Africa. The major players that operate in the global market have adopted key strategies such as product launch, to strengthen their market outreach and sustain the stiff competition in the market.
Competition Analysis
Key companies profiled in the Metal Ceilings market report include Armstrong World Industries, Hunter Douglas, SAS International, ROCKWOOL Group (Rockfon), Knauf (USG Corporation), Saint-Gobain (CertainTeed), OWA Ceiling Systems, Gage Corporation International, Decoustics, and Tincpro Metal Industries.
Key Benefits For Stakeholders
- The report provides an extensive analysis of the current and emerging Metal Ceilings market trends and dynamics.
- In-depth market analysis is conducted by constructing market estimations for the key market segments between 2020 and 2032.
- Extensive analysis of the Metal Ceilings market is conducted by following key product positioning and monitoring of the top competitors within the market framework.
- A comprehensive analysis of all regions is provided to determine the prevailing opportunities.
- The global Metal Ceilings market forecast analysis from 2023 to 2032 is included in the report.
- The key market players within Metal Ceilings market are profiled in this report and their strategies are analyzed thoroughly, which help understand the competitive outlook of the Metal Ceilings industry.
Additional benefits you will get with this purchase are:
- Quarterly Update and* (only available with a corporate license, on listed price)
- 5 additional Company Profile of client Choice pre- or Post-purchase, as a free update.
- Free Upcoming Version on the Purchase of Five and Enterprise User License.
- 16 analyst hours of support* (post-purchase, if you find additional data requirements upon review of the report, you may receive support amounting to 16 analyst hours to solve questions, and post-sale queries)
- 15% Free Customization* (in case the scope or segment of the report does not match your requirements, 15% is equivalent to 3 working days of free work, applicable once)
- Free data Pack on the Five and Enterprise User License. (Excel version of the report)
- Free Updated report if the report is 6-12 months old or older.
- 24-hour priority response*
- Free Industry updates and white papers.
Possible Customization with this report (with additional cost and timeline, please talk to the sales executive to know more)
- Manufacturing Capacity
- Capital Investment breakdown
- Average Consumer Expenditure
- Consumer Preference and Product Specifications
- Distributor margin Analysis
- Go To Market Strategy
- Market share analysis of players by products/segments
- Additional company profiles with specific to client's interest
- Additional country or region analysis- market size and forecast
- Average Selling Price Analysis / Price Point Analysis
- Brands Share Analysis
- Criss-cross segment analysis- market size and forecast
- Expanded list for Company Profiles
- Historic market data
- Import Export Analysis/Data
- Key player details (including location, contact details, supplier/vendor network etc. in excel format)
- List of customers/consumers/raw material suppliers- value chain analysis
- Market share analysis of players at global/region/country level
- SWOT Analysis
- Volume Market Size and Forecast
Key Market Segments
By Material
- Steel
- Aluminum
- Others
By Application
- Interior
- Exterior
By End User
- Commercial
- Education
- Transport
- Retail
- Healthcare
- Others
By Region
- North America
- U.S.
- Canada
- Mexico
- Europe
- Germany
- France
- UK
- Italy
- Rest of Europe
- Asia-Pacific
- China
- Japan
- South Korea
- India
- Rest of Asia-Pacific
- Latin America
- Brazil
- Argentina
- Colombia
- Rest of Latin America
- Middle East and Africa
- Saudi Arabia
- UAE
- Nigeria
- Egypt
- Rest of Middle East And Africa
Key Market Players:
- Armstrong World Industries, Inc.
- Hunter Douglas AG
- SAS International
- Rockwool group
- Knauf
- Saint-Gobain
- OWA Ceiling Systems
- Gage Corporation International
- Decoustics
- Tincpro Metal Industries
TABLE OF CONTENTS
CHAPTER 1: INTRODUCTION
- 1.1. Report description
- 1.2. Key market segments
- 1.3. Key benefits to the stakeholders
- 1.4. Research methodology
- 1.4.1. Primary research
- 1.4.2. Secondary research
- 1.4.3. Analyst tools and models
CHAPTER 2: EXECUTIVE SUMMARY
- 2.1. CXO perspective
CHAPTER 3: MARKET OVERVIEW
- 3.1. Market definition and scope
- 3.2. Key findings
- 3.2.1. Top impacting factors
- 3.2.2. Top investment pockets
- 3.3. Porter's five forces analysis
- 3.4. Market dynamics
- 3.4.1. Drivers
- 3.4.2. Restraints
- 3.4.3. Opportunities
CHAPTER 4: METAL CEILINGS MARKET, BY MATERIAL
- 4.1. Overview
- 4.1.1. Market size and forecast
- 4.2. Steel
- 4.2.1. Key market trends, growth factors and opportunities
- 4.2.2. Market size and forecast, by region
- 4.2.3. Market share analysis by country
- 4.3. Aluminum
- 4.3.1. Key market trends, growth factors and opportunities
- 4.3.2. Market size and forecast, by region
- 4.3.3. Market share analysis by country
- 4.4. Others
- 4.4.1. Key market trends, growth factors and opportunities
- 4.4.2. Market size and forecast, by region
- 4.4.3. Market share analysis by country
CHAPTER 5: METAL CEILINGS MARKET, BY APPLICATION
- 5.1. Overview
- 5.1.1. Market size and forecast
- 5.2. Interior
- 5.2.1. Key market trends, growth factors and opportunities
- 5.2.2. Market size and forecast, by region
- 5.2.3. Market share analysis by country
- 5.3. Exterior
- 5.3.1. Key market trends, growth factors and opportunities
- 5.3.2. Market size and forecast, by region
- 5.3.3. Market share analysis by country
CHAPTER 6: METAL CEILINGS MARKET, BY END USER
- 6.1. Overview
- 6.1.1. Market size and forecast
- 6.2. Commercial
- 6.2.1. Key market trends, growth factors and opportunities
- 6.2.2. Market size and forecast, by region
- 6.2.3. Market share analysis by country
- 6.3. Education
- 6.3.1. Key market trends, growth factors and opportunities
- 6.3.2. Market size and forecast, by region
- 6.3.3. Market share analysis by country
- 6.4. Transport
- 6.4.1. Key market trends, growth factors and opportunities
- 6.4.2. Market size and forecast, by region
- 6.4.3. Market share analysis by country
- 6.5. Retail
- 6.5.1. Key market trends, growth factors and opportunities
- 6.5.2. Market size and forecast, by region
- 6.5.3. Market share analysis by country
- 6.6. Healthcare
- 6.6.1. Key market trends, growth factors and opportunities
- 6.6.2. Market size and forecast, by region
- 6.6.3. Market share analysis by country
- 6.7. Others
- 6.7.1. Key market trends, growth factors and opportunities
- 6.7.2. Market size and forecast, by region
- 6.7.3. Market share analysis by country
CHAPTER 7: METAL CEILINGS MARKET, BY REGION
- 7.1. Overview
- 7.1.1. Market size and forecast By Region
- 7.2. North America
- 7.2.1. Key market trends, growth factors and opportunities
- 7.2.2. Market size and forecast, by Material
- 7.2.3. Market size and forecast, by Application
- 7.2.4. Market size and forecast, by End User
- 7.2.5. Market size and forecast, by country
- 7.2.5.1. U.S.
- 7.2.5.1.1. Market size and forecast, by Material
- 7.2.5.1.2. Market size and forecast, by Application
- 7.2.5.1.3. Market size and forecast, by End User
- 7.2.5.2. Canada
- 7.2.5.2.1. Market size and forecast, by Material
- 7.2.5.2.2. Market size and forecast, by Application
- 7.2.5.2.3. Market size and forecast, by End User
- 7.2.5.3. Mexico
- 7.2.5.3.1. Market size and forecast, by Material
- 7.2.5.3.2. Market size and forecast, by Application
- 7.2.5.3.3. Market size and forecast, by End User
- 7.3. Europe
- 7.3.1. Key market trends, growth factors and opportunities
- 7.3.2. Market size and forecast, by Material
- 7.3.3. Market size and forecast, by Application
- 7.3.4. Market size and forecast, by End User
- 7.3.5. Market size and forecast, by country
- 7.3.5.1. Germany
- 7.3.5.1.1. Market size and forecast, by Material
- 7.3.5.1.2. Market size and forecast, by Application
- 7.3.5.1.3. Market size and forecast, by End User
- 7.3.5.2. France
- 7.3.5.2.1. Market size and forecast, by Material
- 7.3.5.2.2. Market size and forecast, by Application
- 7.3.5.2.3. Market size and forecast, by End User
- 7.3.5.3. UK
- 7.3.5.3.1. Market size and forecast, by Material
- 7.3.5.3.2. Market size and forecast, by Application
- 7.3.5.3.3. Market size and forecast, by End User
- 7.3.5.4. Italy
- 7.3.5.4.1. Market size and forecast, by Material
- 7.3.5.4.2. Market size and forecast, by Application
- 7.3.5.4.3. Market size and forecast, by End User
- 7.3.5.5. Rest of Europe
- 7.3.5.5.1. Market size and forecast, by Material
- 7.3.5.5.2. Market size and forecast, by Application
- 7.3.5.5.3. Market size and forecast, by End User
- 7.4. Asia-Pacific
- 7.4.1. Key market trends, growth factors and opportunities
- 7.4.2. Market size and forecast, by Material
- 7.4.3. Market size and forecast, by Application
- 7.4.4. Market size and forecast, by End User
- 7.4.5. Market size and forecast, by country
- 7.4.5.1. China
- 7.4.5.1.1. Market size and forecast, by Material
- 7.4.5.1.2. Market size and forecast, by Application
- 7.4.5.1.3. Market size and forecast, by End User
- 7.4.5.2. Japan
- 7.4.5.2.1. Market size and forecast, by Material
- 7.4.5.2.2. Market size and forecast, by Application
- 7.4.5.2.3. Market size and forecast, by End User
- 7.4.5.3. South Korea
- 7.4.5.3.1. Market size and forecast, by Material
- 7.4.5.3.2. Market size and forecast, by Application
- 7.4.5.3.3. Market size and forecast, by End User
- 7.4.5.4. India
- 7.4.5.4.1. Market size and forecast, by Material
- 7.4.5.4.2. Market size and forecast, by Application
- 7.4.5.4.3. Market size and forecast, by End User
- 7.4.5.5. Rest of Asia-Pacific
- 7.4.5.5.1. Market size and forecast, by Material
- 7.4.5.5.2. Market size and forecast, by Application
- 7.4.5.5.3. Market size and forecast, by End User
- 7.5. Latin America
- 7.5.1. Key market trends, growth factors and opportunities
- 7.5.2. Market size and forecast, by Material
- 7.5.3. Market size and forecast, by Application
- 7.5.4. Market size and forecast, by End User
- 7.5.5. Market size and forecast, by country
- 7.5.5.1. Brazil
- 7.5.5.1.1. Market size and forecast, by Material
- 7.5.5.1.2. Market size and forecast, by Application
- 7.5.5.1.3. Market size and forecast, by End User
- 7.5.5.2. Argentina
- 7.5.5.2.1. Market size and forecast, by Material
- 7.5.5.2.2. Market size and forecast, by Application
- 7.5.5.2.3. Market size and forecast, by End User
- 7.5.5.3. Colombia
- 7.5.5.3.1. Market size and forecast, by Material
- 7.5.5.3.2. Market size and forecast, by Application
- 7.5.5.3.3. Market size and forecast, by End User
- 7.5.5.4. Rest of Latin America
- 7.5.5.4.1. Market size and forecast, by Material
- 7.5.5.4.2. Market size and forecast, by Application
- 7.5.5.4.3. Market size and forecast, by End User
- 7.6. Middle East and Africa
- 7.6.1. Key market trends, growth factors and opportunities
- 7.6.2. Market size and forecast, by Material
- 7.6.3. Market size and forecast, by Application
- 7.6.4. Market size and forecast, by End User
- 7.6.5. Market size and forecast, by country
- 7.6.5.1. Saudi Arabia
- 7.6.5.1.1. Market size and forecast, by Material
- 7.6.5.1.2. Market size and forecast, by Application
- 7.6.5.1.3. Market size and forecast, by End User
- 7.6.5.2. UAE
- 7.6.5.2.1. Market size and forecast, by Material
- 7.6.5.2.2. Market size and forecast, by Application
- 7.6.5.2.3. Market size and forecast, by End User
- 7.6.5.3. Nigeria
- 7.6.5.3.1. Market size and forecast, by Material
- 7.6.5.3.2. Market size and forecast, by Application
- 7.6.5.3.3. Market size and forecast, by End User
- 7.6.5.4. Egypt
- 7.6.5.4.1. Market size and forecast, by Material
- 7.6.5.4.2. Market size and forecast, by Application
- 7.6.5.4.3. Market size and forecast, by End User
- 7.6.5.5. Rest of Middle East And Africa
- 7.6.5.5.1. Market size and forecast, by Material
- 7.6.5.5.2. Market size and forecast, by Application
- 7.6.5.5.3. Market size and forecast, by End User
CHAPTER 8: COMPETITIVE LANDSCAPE
- 8.1. Introduction
- 8.2. Top winning strategies
- 8.3. Product mapping of top 10 player
- 8.4. Competitive dashboard
- 8.5. Competitive heatmap
- 8.6. Top player positioning, 2020
CHAPTER 9: COMPANY PROFILES
- 9.1. Armstrong World Industries, Inc.
- 9.1.1. Company overview
- 9.1.2. Key executives
- 9.1.3. Company snapshot
- 9.1.4. Operating business segments
- 9.1.5. Product portfolio
- 9.1.6. Business performance
- 9.1.7. Key strategic moves and developments
- 9.2. Hunter Douglas AG
- 9.2.1. Company overview
- 9.2.2. Key executives
- 9.2.3. Company snapshot
- 9.2.4. Operating business segments
- 9.2.5. Product portfolio
- 9.2.6. Business performance
- 9.2.7. Key strategic moves and developments
- 9.3. SAS International
- 9.3.1. Company overview
- 9.3.2. Key executives
- 9.3.3. Company snapshot
- 9.3.4. Operating business segments
- 9.3.5. Product portfolio
- 9.3.6. Business performance
- 9.3.7. Key strategic moves and developments
- 9.4. Rockwool group
- 9.4.1. Company overview
- 9.4.2. Key executives
- 9.4.3. Company snapshot
- 9.4.4. Operating business segments
- 9.4.5. Product portfolio
- 9.4.6. Business performance
- 9.4.7. Key strategic moves and developments
- 9.5. Knauf
- 9.5.1. Company overview
- 9.5.2. Key executives
- 9.5.3. Company snapshot
- 9.5.4. Operating business segments
- 9.5.5. Product portfolio
- 9.5.6. Business performance
- 9.5.7. Key strategic moves and developments
- 9.6. Saint-Gobain
- 9.6.1. Company overview
- 9.6.2. Key executives
- 9.6.3. Company snapshot
- 9.6.4. Operating business segments
- 9.6.5. Product portfolio
- 9.6.6. Business performance
- 9.6.7. Key strategic moves and developments
- 9.7. OWA Ceiling Systems
- 9.7.1. Company overview
- 9.7.2. Key executives
- 9.7.3. Company snapshot
- 9.7.4. Operating business segments
- 9.7.5. Product portfolio
- 9.7.6. Business performance
- 9.7.7. Key strategic moves and developments
- 9.8. Gage Corporation International
- 9.8.1. Company overview
- 9.8.2. Key executives
- 9.8.3. Company snapshot
- 9.8.4. Operating business segments
- 9.8.5. Product portfolio
- 9.8.6. Business performance
- 9.8.7. Key strategic moves and developments
- 9.9. Decoustics
- 9.9.1. Company overview
- 9.9.2. Key executives
- 9.9.3. Company snapshot
- 9.9.4. Operating business segments
- 9.9.5. Product portfolio
- 9.9.6. Business performance
- 9.9.7. Key strategic moves and developments
- 9.10. Tincpro Metal Industries
- 9.10.1. Company overview
- 9.10.2. Key executives
- 9.10.3. Company snapshot
- 9.10.4. Operating business segments
- 9.10.5. Product portfolio
- 9.10.6. Business performance
- 9.10.7. Key strategic moves and developments
LIST OF TABLES
- TABLE 01. GLOBAL METAL CEILINGS MARKET, BY MATERIAL, 2020-2032 ($MILLION)
- TABLE 02. METAL CEILINGS MARKET FOR STEEL, BY REGION, 2020-2032 ($MILLION)
- TABLE 03. METAL CEILINGS MARKET FOR ALUMINUM, BY REGION, 2020-2032 ($MILLION)
- TABLE 04. METAL CEILINGS MARKET FOR OTHERS, BY REGION, 2020-2032 ($MILLION)
- TABLE 05. GLOBAL METAL CEILINGS MARKET, BY APPLICATION, 2020-2032 ($MILLION)
- TABLE 06. METAL CEILINGS MARKET FOR INTERIOR, BY REGION, 2020-2032 ($MILLION)
- TABLE 07. METAL CEILINGS MARKET FOR EXTERIOR, BY REGION, 2020-2032 ($MILLION)
- TABLE 08. GLOBAL METAL CEILINGS MARKET, BY END USER, 2020-2032 ($MILLION)
- TABLE 09. METAL CEILINGS MARKET FOR COMMERCIAL, BY REGION, 2020-2032 ($MILLION)
- TABLE 10. METAL CEILINGS MARKET FOR EDUCATION, BY REGION, 2020-2032 ($MILLION)
- TABLE 11. METAL CEILINGS MARKET FOR TRANSPORT, BY REGION, 2020-2032 ($MILLION)
- TABLE 12. METAL CEILINGS MARKET FOR RETAIL, BY REGION, 2020-2032 ($MILLION)
- TABLE 13. METAL CEILINGS MARKET FOR HEALTHCARE, BY REGION, 2020-2032 ($MILLION)
- TABLE 14. METAL CEILINGS MARKET FOR OTHERS, BY REGION, 2020-2032 ($MILLION)
- TABLE 15. METAL CEILINGS MARKET, BY REGION, 2020-2032 ($MILLION)
- TABLE 16. NORTH AMERICA METAL CEILINGS MARKET, BY MATERIAL, 2020-2032 ($MILLION)
- TABLE 17. NORTH AMERICA METAL CEILINGS MARKET, BY APPLICATION, 2020-2032 ($MILLION)
- TABLE 18. NORTH AMERICA METAL CEILINGS MARKET, BY END USER, 2020-2032 ($MILLION)
- TABLE 19. NORTH AMERICA METAL CEILINGS MARKET, BY COUNTRY, 2020-2032 ($MILLION)
- TABLE 20. U.S. METAL CEILINGS MARKET, BY MATERIAL, 2020-2032 ($MILLION)
- TABLE 21. U.S. METAL CEILINGS MARKET, BY APPLICATION, 2020-2032 ($MILLION)
- TABLE 22. U.S. METAL CEILINGS MARKET, BY END USER, 2020-2032 ($MILLION)
- TABLE 23. CANADA METAL CEILINGS MARKET, BY MATERIAL, 2020-2032 ($MILLION)
- TABLE 24. CANADA METAL CEILINGS MARKET, BY APPLICATION, 2020-2032 ($MILLION)
- TABLE 25. CANADA METAL CEILINGS MARKET, BY END USER, 2020-2032 ($MILLION)
- TABLE 26. MEXICO METAL CEILINGS MARKET, BY MATERIAL, 2020-2032 ($MILLION)
- TABLE 27. MEXICO METAL CEILINGS MARKET, BY APPLICATION, 2020-2032 ($MILLION)
- TABLE 28. MEXICO METAL CEILINGS MARKET, BY END USER, 2020-2032 ($MILLION)
- TABLE 29. EUROPE METAL CEILINGS MARKET, BY MATERIAL, 2020-2032 ($MILLION)
- TABLE 30. EUROPE METAL CEILINGS MARKET, BY APPLICATION, 2020-2032 ($MILLION)
- TABLE 31. EUROPE METAL CEILINGS MARKET, BY END USER, 2020-2032 ($MILLION)
- TABLE 32. EUROPE METAL CEILINGS MARKET, BY COUNTRY, 2020-2032 ($MILLION)
- TABLE 33. GERMANY METAL CEILINGS MARKET, BY MATERIAL, 2020-2032 ($MILLION)
- TABLE 34. GERMANY METAL CEILINGS MARKET, BY APPLICATION, 2020-2032 ($MILLION)
- TABLE 35. GERMANY METAL CEILINGS MARKET, BY END USER, 2020-2032 ($MILLION)
- TABLE 36. FRANCE METAL CEILINGS MARKET, BY MATERIAL, 2020-2032 ($MILLION)
- TABLE 37. FRANCE METAL CEILINGS MARKET, BY APPLICATION, 2020-2032 ($MILLION)
- TABLE 38. FRANCE METAL CEILINGS MARKET, BY END USER, 2020-2032 ($MILLION)
- TABLE 39. UK METAL CEILINGS MARKET, BY MATERIAL, 2020-2032 ($MILLION)
- TABLE 40. UK METAL CEILINGS MARKET, BY APPLICATION, 2020-2032 ($MILLION)
- TABLE 41. UK METAL CEILINGS MARKET, BY END USER, 2020-2032 ($MILLION)
- TABLE 42. ITALY METAL CEILINGS MARKET, BY MATERIAL, 2020-2032 ($MILLION)
- TABLE 43. ITALY METAL CEILINGS MARKET, BY APPLICATION, 2020-2032 ($MILLION)
- TABLE 44. ITALY METAL CEILINGS MARKET, BY END USER, 2020-2032 ($MILLION)
- TABLE 45. REST OF EUROPE METAL CEILINGS MARKET, BY MATERIAL, 2020-2032 ($MILLION)
- TABLE 46. REST OF EUROPE METAL CEILINGS MARKET, BY APPLICATION, 2020-2032 ($MILLION)
- TABLE 47. REST OF EUROPE METAL CEILINGS MARKET, BY END USER, 2020-2032 ($MILLION)
- TABLE 48. ASIA-PACIFIC METAL CEILINGS MARKET, BY MATERIAL, 2020-2032 ($MILLION)
- TABLE 49. ASIA-PACIFIC METAL CEILINGS MARKET, BY APPLICATION, 2020-2032 ($MILLION)
- TABLE 50. ASIA-PACIFIC METAL CEILINGS MARKET, BY END USER, 2020-2032 ($MILLION)
- TABLE 51. ASIA-PACIFIC METAL CEILINGS MARKET, BY COUNTRY, 2020-2032 ($MILLION)
- TABLE 52. CHINA METAL CEILINGS MARKET, BY MATERIAL, 2020-2032 ($MILLION)
- TABLE 53. CHINA METAL CEILINGS MARKET, BY APPLICATION, 2020-2032 ($MILLION)
- TABLE 54. CHINA METAL CEILINGS MARKET, BY END USER, 2020-2032 ($MILLION)
- TABLE 55. JAPAN METAL CEILINGS MARKET, BY MATERIAL, 2020-2032 ($MILLION)
- TABLE 56. JAPAN METAL CEILINGS MARKET, BY APPLICATION, 2020-2032 ($MILLION)
- TABLE 57. JAPAN METAL CEILINGS MARKET, BY END USER, 2020-2032 ($MILLION)
- TABLE 58. SOUTH KOREA METAL CEILINGS MARKET, BY MATERIAL, 2020-2032 ($MILLION)
- TABLE 59. SOUTH KOREA METAL CEILINGS MARKET, BY APPLICATION, 2020-2032 ($MILLION)
- TABLE 60. SOUTH KOREA METAL CEILINGS MARKET, BY END USER, 2020-2032 ($MILLION)
- TABLE 61. INDIA METAL CEILINGS MARKET, BY MATERIAL, 2020-2032 ($MILLION)
- TABLE 62. INDIA METAL CEILINGS MARKET, BY APPLICATION, 2020-2032 ($MILLION)
- TABLE 63. INDIA METAL CEILINGS MARKET, BY END USER, 2020-2032 ($MILLION)
- TABLE 64. REST OF ASIA-PACIFIC METAL CEILINGS MARKET, BY MATERIAL, 2020-2032 ($MILLION)
- TABLE 65. REST OF ASIA-PACIFIC METAL CEILINGS MARKET, BY APPLICATION, 2020-2032 ($MILLION)
- TABLE 66. REST OF ASIA-PACIFIC METAL CEILINGS MARKET, BY END USER, 2020-2032 ($MILLION)
- TABLE 67. LATIN AMERICA METAL CEILINGS MARKET, BY MATERIAL, 2020-2032 ($MILLION)
- TABLE 68. LATIN AMERICA METAL CEILINGS MARKET, BY APPLICATION, 2020-2032 ($MILLION)
- TABLE 69. LATIN AMERICA METAL CEILINGS MARKET, BY END USER, 2020-2032 ($MILLION)
- TABLE 70. LATIN AMERICA METAL CEILINGS MARKET, BY COUNTRY, 2020-2032 ($MILLION)
- TABLE 71. BRAZIL METAL CEILINGS MARKET, BY MATERIAL, 2020-2032 ($MILLION)
- TABLE 72. BRAZIL METAL CEILINGS MARKET, BY APPLICATION, 2020-2032 ($MILLION)
- TABLE 73. BRAZIL METAL CEILINGS MARKET, BY END USER, 2020-2032 ($MILLION)
- TABLE 74. ARGENTINA METAL CEILINGS MARKET, BY MATERIAL, 2020-2032 ($MILLION)
- TABLE 75. ARGENTINA METAL CEILINGS MARKET, BY APPLICATION, 2020-2032 ($MILLION)
- TABLE 76. ARGENTINA METAL CEILINGS MARKET, BY END USER, 2020-2032 ($MILLION)
- TABLE 77. COLOMBIA METAL CEILINGS MARKET, BY MATERIAL, 2020-2032 ($MILLION)
- TABLE 78. COLOMBIA METAL CEILINGS MARKET, BY APPLICATION, 2020-2032 ($MILLION)
- TABLE 79. COLOMBIA METAL CEILINGS MARKET, BY END USER, 2020-2032 ($MILLION)
- TABLE 80. REST OF LATIN AMERICA METAL CEILINGS MARKET, BY MATERIAL, 2020-2032 ($MILLION)
- TABLE 81. REST OF LATIN AMERICA METAL CEILINGS MARKET, BY APPLICATION, 2020-2032 ($MILLION)
- TABLE 82. REST OF LATIN AMERICA METAL CEILINGS MARKET, BY END USER, 2020-2032 ($MILLION)
- TABLE 83. MIDDLE EAST AND AFRICA METAL CEILINGS MARKET, BY MATERIAL, 2020-2032 ($MILLION)
- TABLE 84. MIDDLE EAST AND AFRICA METAL CEILINGS MARKET, BY APPLICATION, 2020-2032 ($MILLION)
- TABLE 85. MIDDLE EAST AND AFRICA METAL CEILINGS MARKET, BY END USER, 2020-2032 ($MILLION)
- TABLE 86. MIDDLE EAST AND AFRICA METAL CEILINGS MARKET, BY COUNTRY, 2020-2032 ($MILLION)
- TABLE 87. SAUDI ARABIA METAL CEILINGS MARKET, BY MATERIAL, 2020-2032 ($MILLION)
- TABLE 88. SAUDI ARABIA METAL CEILINGS MARKET, BY APPLICATION, 2020-2032 ($MILLION)
- TABLE 89. SAUDI ARABIA METAL CEILINGS MARKET, BY END USER, 2020-2032 ($MILLION)
- TABLE 90. UAE METAL CEILINGS MARKET, BY MATERIAL, 2020-2032 ($MILLION)
- TABLE 91. UAE METAL CEILINGS MARKET, BY APPLICATION, 2020-2032 ($MILLION)
- TABLE 92. UAE METAL CEILINGS MARKET, BY END USER, 2020-2032 ($MILLION)
- TABLE 93. NIGERIA METAL CEILINGS MARKET, BY MATERIAL, 2020-2032 ($MILLION)
- TABLE 94. NIGERIA METAL CEILINGS MARKET, BY APPLICATION, 2020-2032 ($MILLION)
- TABLE 95. NIGERIA METAL CEILINGS MARKET, BY END USER, 2020-2032 ($MILLION)
- TABLE 96. EGYPT METAL CEILINGS MARKET, BY MATERIAL, 2020-2032 ($MILLION)
- TABLE 97. EGYPT METAL CEILINGS MARKET, BY APPLICATION, 2020-2032 ($MILLION)
- TABLE 98. EGYPT METAL CEILINGS MARKET, BY END USER, 2020-2032 ($MILLION)
- TABLE 99. REST OF MIDDLE EAST AND AFRICA METAL CEILINGS MARKET, BY MATERIAL, 2020-2032 ($MILLION)
- TABLE 100. REST OF MIDDLE EAST AND AFRICA METAL CEILINGS MARKET, BY APPLICATION, 2020-2032 ($MILLION)
- TABLE 101. REST OF MIDDLE EAST AND AFRICA METAL CEILINGS MARKET, BY END USER, 2020-2032 ($MILLION)
- TABLE 102. AWI Licensing LLC.: KEY EXECUTIVES
- TABLE 103. AWI Licensing LLC.: COMPANY SNAPSHOT
- TABLE 104. AWI Licensing LLC.: PRODUCT SEGMENTS
- TABLE 105. AWI Licensing LLC.: SERVICE SEGMENTS
- TABLE 106. AWI Licensing LLC.: PRODUCT PORTFOLIO
- TABLE 107. AWI Licensing LLC.: KEY STRATEGIES
- TABLE 108. Hunter Douglas: KEY EXECUTIVES
- TABLE 109. Hunter Douglas: COMPANY SNAPSHOT
- TABLE 110. Hunter Douglas: PRODUCT SEGMENTS
- TABLE 111. Hunter Douglas: SERVICE SEGMENTS
- TABLE 112. Hunter Douglas: PRODUCT PORTFOLIO
- TABLE 113. Hunter Douglas: KEY STRATEGIES
- TABLE 114. SAS INTERNATIONAL: KEY EXECUTIVES
- TABLE 115. SAS INTERNATIONAL: COMPANY SNAPSHOT
- TABLE 116. SAS INTERNATIONAL: PRODUCT SEGMENTS
- TABLE 117. SAS INTERNATIONAL: SERVICE SEGMENTS
- TABLE 118. SAS INTERNATIONAL: PRODUCT PORTFOLIO
- TABLE 119. SAS INTERNATIONAL: KEY STRATEGIES
- TABLE 120. ROCKWOOL A/S.: KEY EXECUTIVES
- TABLE 121. ROCKWOOL A/S.: COMPANY SNAPSHOT
- TABLE 122. ROCKWOOL A/S.: PRODUCT SEGMENTS
- TABLE 123. ROCKWOOL A/S.: SERVICE SEGMENTS
- TABLE 124. ROCKWOOL A/S.: PRODUCT PORTFOLIO
- TABLE 125. ROCKWOOL A/S.: KEY STRATEGIES
- TABLE 126. Knauf Digital GmbH: KEY EXECUTIVES
- TABLE 127. Knauf Digital GmbH: COMPANY SNAPSHOT
- TABLE 128. Knauf Digital GmbH: PRODUCT SEGMENTS
- TABLE 129. Knauf Digital GmbH: SERVICE SEGMENTS
- TABLE 130. Knauf Digital GmbH: PRODUCT PORTFOLIO
- TABLE 131. Knauf Digital GmbH: KEY STRATEGIES
- TABLE 132. SAINT-GOBAIN: KEY EXECUTIVES
- TABLE 133. SAINT-GOBAIN: COMPANY SNAPSHOT
- TABLE 134. SAINT-GOBAIN: PRODUCT SEGMENTS
- TABLE 135. SAINT-GOBAIN: SERVICE SEGMENTS
- TABLE 136. SAINT-GOBAIN: PRODUCT PORTFOLIO
- TABLE 137. SAINT-GOBAIN: KEY STRATEGIES
- TABLE 138. Odenwald Faserplattenwerk GmbH: KEY EXECUTIVES
- TABLE 139. Odenwald Faserplattenwerk GmbH: COMPANY SNAPSHOT
- TABLE 140. Odenwald Faserplattenwerk GmbH: PRODUCT SEGMENTS
- TABLE 141. Odenwald Faserplattenwerk GmbH: SERVICE SEGMENTS
- TABLE 142. Odenwald Faserplattenwerk GmbH: PRODUCT PORTFOLIO
- TABLE 143. Odenwald Faserplattenwerk GmbH: KEY STRATEGIES
- TABLE 144. Gage Architectural Products: KEY EXECUTIVES
- TABLE 145. Gage Architectural Products: COMPANY SNAPSHOT
- TABLE 146. Gage Architectural Products: PRODUCT SEGMENTS
- TABLE 147. Gage Architectural Products: SERVICE SEGMENTS
- TABLE 148. Gage Architectural Products: PRODUCT PORTFOLIO
- TABLE 149. Gage Architectural Products: KEY STRATEGIES
- TABLE 150. Decoustic: KEY EXECUTIVES
- TABLE 151. Decoustic: COMPANY SNAPSHOT
- TABLE 152. Decoustic: PRODUCT SEGMENTS
- TABLE 153. Decoustic: SERVICE SEGMENTS
- TABLE 154. Decoustic: PRODUCT PORTFOLIO
- TABLE 155. Decoustic: KEY STRATEGIES
- TABLE 156. DAMPA: KEY EXECUTIVES
- TABLE 157. DAMPA: COMPANY SNAPSHOT
- TABLE 158. DAMPA: PRODUCT SEGMENTS
- TABLE 159. DAMPA: SERVICE SEGMENTS
- TABLE 160. DAMPA: PRODUCT PORTFOLIO
- TABLE 161. DAMPA: KEY STRATEGIES
LIST OF FIGURES
- FIGURE 01. METAL CEILINGS MARKET, 2020-2032
- FIGURE 02. SEGMENTATION OF METAL CEILINGS MARKET,2020-2032
- FIGURE 03. TOP IMPACTING FACTORS IN METAL CEILINGS MARKET
- FIGURE 04. TOP INVESTMENT POCKETS IN METAL CEILINGS MARKET (2023-2032)
- FIGURE 05. BARGAINING POWER OF SUPPLIERS
- FIGURE 06. BARGAINING POWER OF BUYERS
- FIGURE 07. THREAT OF SUBSTITUTION
- FIGURE 08. THREAT OF SUBSTITUTION
- FIGURE 09. COMPETITIVE RIVALRY
- FIGURE 10. GLOBAL METAL CEILINGS MARKET:DRIVERS, RESTRAINTS AND OPPORTUNITIES
- FIGURE 11. METAL CEILINGS MARKET, BY MATERIAL, 2020 AND 2032(%)
- FIGURE 12. COMPARATIVE SHARE ANALYSIS OF METAL CEILINGS MARKET FOR STEEL, BY COUNTRY 2020 AND 2032(%)
- FIGURE 13. COMPARATIVE SHARE ANALYSIS OF METAL CEILINGS MARKET FOR ALUMINUM, BY COUNTRY 2020 AND 2032(%)
- FIGURE 14. COMPARATIVE SHARE ANALYSIS OF METAL CEILINGS MARKET FOR OTHERS, BY COUNTRY 2020 AND 2032(%)
- FIGURE 15. METAL CEILINGS MARKET, BY APPLICATION, 2020 AND 2032(%)
- FIGURE 16. COMPARATIVE SHARE ANALYSIS OF METAL CEILINGS MARKET FOR INTERIOR, BY COUNTRY 2020 AND 2032(%)
- FIGURE 17. COMPARATIVE SHARE ANALYSIS OF METAL CEILINGS MARKET FOR EXTERIOR, BY COUNTRY 2020 AND 2032(%)
- FIGURE 18. METAL CEILINGS MARKET, BY END USER, 2020 AND 2032(%)
- FIGURE 19. COMPARATIVE SHARE ANALYSIS OF METAL CEILINGS MARKET FOR COMMERCIAL, BY COUNTRY 2020 AND 2032(%)
- FIGURE 20. COMPARATIVE SHARE ANALYSIS OF METAL CEILINGS MARKET FOR EDUCATION, BY COUNTRY 2020 AND 2032(%)
- FIGURE 21. COMPARATIVE SHARE ANALYSIS OF METAL CEILINGS MARKET FOR TRANSPORT, BY COUNTRY 2020 AND 2032(%)
- FIGURE 22. COMPARATIVE SHARE ANALYSIS OF METAL CEILINGS MARKET FOR RETAIL, BY COUNTRY 2020 AND 2032(%)
- FIGURE 23. COMPARATIVE SHARE ANALYSIS OF METAL CEILINGS MARKET FOR HEALTHCARE, BY COUNTRY 2020 AND 2032(%)
- FIGURE 24. COMPARATIVE SHARE ANALYSIS OF METAL CEILINGS MARKET FOR OTHERS, BY COUNTRY 2020 AND 2032(%)
- FIGURE 25. METAL CEILINGS MARKET BY REGION, 2020 AND 2032(%)
- FIGURE 26. U.S. METAL CEILINGS MARKET, 2020-2032 ($MILLION)
- FIGURE 27. CANADA METAL CEILINGS MARKET, 2020-2032 ($MILLION)
- FIGURE 28. MEXICO METAL CEILINGS MARKET, 2020-2032 ($MILLION)
- FIGURE 29. GERMANY METAL CEILINGS MARKET, 2020-2032 ($MILLION)
- FIGURE 30. FRANCE METAL CEILINGS MARKET, 2020-2032 ($MILLION)
- FIGURE 31. UK METAL CEILINGS MARKET, 2020-2032 ($MILLION)
- FIGURE 32. ITALY METAL CEILINGS MARKET, 2020-2032 ($MILLION)
- FIGURE 33. REST OF EUROPE METAL CEILINGS MARKET, 2020-2032 ($MILLION)
- FIGURE 34. CHINA METAL CEILINGS MARKET, 2020-2032 ($MILLION)
- FIGURE 35. JAPAN METAL CEILINGS MARKET, 2020-2032 ($MILLION)
- FIGURE 36. SOUTH KOREA METAL CEILINGS MARKET, 2020-2032 ($MILLION)
- FIGURE 37. INDIA METAL CEILINGS MARKET, 2020-2032 ($MILLION)
- FIGURE 38. REST OF ASIA-PACIFIC METAL CEILINGS MARKET, 2020-2032 ($MILLION)
- FIGURE 39. BRAZIL METAL CEILINGS MARKET, 2020-2032 ($MILLION)
- FIGURE 40. ARGENTINA METAL CEILINGS MARKET, 2020-2032 ($MILLION)
- FIGURE 41. COLOMBIA METAL CEILINGS MARKET, 2020-2032 ($MILLION)
- FIGURE 42. REST OF LATIN AMERICA METAL CEILINGS MARKET, 2020-2032 ($MILLION)
- FIGURE 43. SAUDI ARABIA METAL CEILINGS MARKET, 2020-2032 ($MILLION)
- FIGURE 44. UAE METAL CEILINGS MARKET, 2020-2032 ($MILLION)
- FIGURE 45. NIGERIA METAL CEILINGS MARKET, 2020-2032 ($MILLION)
- FIGURE 46. EGYPT METAL CEILINGS MARKET, 2020-2032 ($MILLION)
- FIGURE 47. REST OF MIDDLE EAST AND AFRICA METAL CEILINGS MARKET, 2020-2032 ($MILLION)
- FIGURE 48. TOP WINNING STRATEGIES, BY YEAR
- FIGURE 49. TOP WINNING STRATEGIES, BY DEVELOPMENT
- FIGURE 50. TOP WINNING STRATEGIES, BY COMPANY
- FIGURE 51. PRODUCT MAPPING OF TOP 10 PLAYERS
- FIGURE 52. COMPETITIVE DASHBOARD
- FIGURE 53. COMPETITIVE HEATMAP: METAL CEILINGS MARKET
- FIGURE 54. TOP PLAYER POSITIONING, 2020


