


 |
市场调查报告书
商品编码
1641800
全球废弃物管理市场按服务类型和应用划分 - 机会分析和产业预测(2024-2033 年)Drilling Waste Management Market By Service Type (Treatment & Disposal, Containment & Handling, Solids Control) , By Application (Onshore, Offshore) : Global Opportunity Analysis and Industry Forecast, 2024-2033 |
||||||
钻井废弃物管理市场
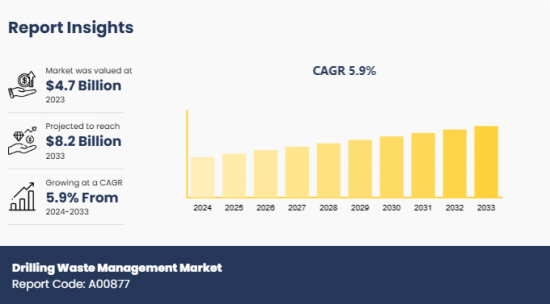
2023 年挖掘废弃物管理市场价值为 47 亿美元,预计到 2033 年将达到 82 亿美元,2024 年至 2033 年的复合年增长率为 5.9%。
钻井废弃物管理包括处理、回收和处置石油和天然气探勘和生产过程中产生的废弃物的技术和流程。钻井产生的废弃物类型包括钻屑、泥浆、水、污泥和其他残留物。钻井废弃物管理的主要目标是减少环境影响并优化资源利用。
更严格的环境法规和严格的钻井作业废弃物管理政策的实施是钻井废弃物管理市场的主要驱动力。此外,陆上和海上石油和天然气探勘的增加导致废弃物产生的增加,这推动了对高效管理解决方案的需求并推动了市场发展。目前挖掘废弃物管理市场的一个重要趋势是在碎片处理中实施环保做法。相关人员正致力于尽量减少使用刺激性化学品,并选择生物分解性的添加剂,以减少钻井过程中产生的泥浆和污泥的有害影响。
然而,妥善处理钻井废弃物需要昂贵的资本投入,这对小型企业来说是一个障碍,阻碍了市场的成长。此外,现场废弃物管理需要大量的基础设施,而挖掘现场缺乏足够的空间也限制了市场的发展。相反,废弃物管理解决方案与回收和再利用计划的融合为钻井废弃物管理市场创造了有利可图的机会。根据全球创投创建者和线上培养箱FasterCapital 的案例研究,这种同化消除了新挖掘的需要,并减少了 70% 的废弃物产生。因此,在废弃物管理过程中融入新技术和解决方案将会为钻井废弃物管理市场开闢新的途径。
部分回顾
挖掘废弃物管理市场根据服务类型、应用和地区进行细分。根据服务类型,市场分为废弃物处理、遏制处理和固态管理。依用途不同,分为陆上和海上。按地区分析,涵盖北美、欧洲、亚太地区、拉丁美洲、中东和非洲。
主要发现
按服务类型划分,预计预测期内处置部分将占据市场主导地位。
根据应用,预计海上部门将在 2024 年至 2033 年期间在市场上占据突出地位。
根据地区划分,预计到 2033 年亚太地区将创造最高收益。
在全球挖掘废弃物管理市场营运的主要企业包括 SLB、哈里伯顿、贝克休斯公司、Weatherford、NOV、SECURE ENERGY、GN Solids Control、TWMA、Scomi Group Bhd 和 Clear Environmental Solutions。这些主要企业正在采取各种关键发展策略,如业务扩张、新产品发布和伙伴关係,以巩固其在竞争激烈的市场中的立足点。
本报告中提供的自订功能
- 产品所含原料的分析(以%为单位)
- 装置量分析
- 投资机会
- 新参与企业(按地区)
- 科技趋势分析
- 平均消费支出
- 按产品/细分市场进行市场细分
- 主要企业的新产品开发/产品矩阵
- 国家、地区和全球层面的患者/流行病学资料
- 根据客户兴趣提供额外的公司简介
- 按国家或地区进行的额外分析 - 市场规模和预测
- 扩展公司简介列表
- 历史市场资料
- Excel 格式的主要企业详细资料(包括位置、联络资讯、供应商/供应商网路等)
- 全球/地区/国家层面的公司市场占有率分析
- SWOT 分析
目录
第 1 章 简介
第 2 章执行摘要
第三章 市场状况
- 市场定义和范围
- 主要发现
- 主要投资机会
- 关键成功策略
- 波特五力分析
- 市场动态
- 驱动程式
- 限制因素
- 机会
第四章废弃物管理市场(依服务类型)
- 市场概况
- 处理
- 遏制
- 固态管理
第五废弃物。
- 市场概况
- 土地
- 海上
6. 挖掘废弃物管理市场(按地区)
- 市场概况
- 北美洲
- 主要市场趋势和机会
- 美国钻井废弃物管理市场
- 加拿大钻井废弃物管理市场
- 墨西哥钻井废弃物管理市场
- 欧洲
- 主要市场趋势和机会
- 法国挖掘废弃物管理市场
- 德国钻井废弃物管理市场
- 义大利钻井废弃物管理市场
- 西班牙钻井废弃物管理市场
- 英国挖掘废弃物管理市场
- 其他欧洲国家钻井废弃物管理市场
- 亚太地区
- 主要市场趋势和机会
- 中国挖掘废弃物管理市场
- 日本钻井废弃物管理市场
- 印度挖掘废弃物管理市场
- 韩国钻井废弃物处理市场
- 澳洲钻井废弃物管理市场
- 其他亚太地区钻井废弃物管理市场
- 拉丁美洲、中东和非洲
- 主要市场趋势和机会
- 巴西钻井废弃物管理市场
- 南非钻井废弃物管理市场
- 沙乌地阿拉伯钻井废弃物管理市场
- 其他拉丁美洲、中东和非洲挖掘废弃物管理市场
第七章 竞争格局
- 介绍
- 关键成功策略
- 前 10 家公司的产品映射
- 竞争仪錶板
- 竞争热图
- 主要企业定位(2023年)
第八章 公司简介
- SLB
- Halliburton
- Baker Hughes Company
- Weatherford
- NOV
- SECURE ENERGY
- GN Solids Control
- TWMA
- Scomi Group Bhd
- Clear Environmental Solutions
Drilling Waste Management Market
The drilling waste management market was valued at $4.7 billion in 2023 and is projected to reach $8.2 billion by 2033, growing at a CAGR of 5.9% from 2024 to 2033.
Drilling waste management comprises the technologies and processes that handle, treat, recycle, and dispose of waste materials generated during oil & gas exploration & production. The different types of wastes produced by drilling include cuttings, mud, water, sludge, and other residuals. The primary aim of performing drilling waste management remains to reduce environmental impact and optimize resource utilization.
Increase in the stringency of environmental regulations and enforcement of strict waste management policies regarding drilling operations are the key drivers of the drilling waste management market. In addition, rise in oil & gas explorations at both onshore and offshore locations is resulting in upsurged waste generation, which is fueling the need for efficient management solutions and propelling the development of the market. A significant trend gaining prominence in the drilling waste management market currently is the implementation of eco-friendly practices in disposing of debris. Stakeholders are focusing on minimizing the usage of harsh chemicals and opting for biodegradable additives to reduce the harmful impact of mud & sludge generated during drilling.
However, adequate disposal of drilling waste requires a high capital investment, which acts as a barrier for several small-scale companies and hampers the growth of the market. Moreover, lack of availability of sufficient space at drilling locations restrains the development of the market as onsite waste management requires significant infrastructure. On the contrary, the assimilation of waste management solutions with recycling & reuse programs is presenting remunerative opportunities for the drilling waste management market. According to a case study by FasterCapital-a global venture builder and online incubator-this assimilation eliminates the need for fresh drilling and reduces waste generation by 70%. Therefore, the integration of novel techniques and solutions into the waste management process is poised to open new avenues for the drilling waste management market.
Segment Review
The drilling waste management market is segmented into service type, application, and region. On the basis of service type, the market is divided into treatment & disposal, containment & handling, solids control. Depending on application, it is bifurcated into onshore and offshore. Region wise, it is analyzed across North America, Europe, Asia-Pacific, and LAMEA.
Key Findings
On the basis of service type, the treatment & disposal segment is expected to dominate the market during the forecast period.
Depending on application, the offshore segment is projected to acquire a notable stake in the market from 2024 to 2033.
Region wise, Asia-Pacific is anticipated to be the highest revenue generator by 2033.
Competition Analysis
The leading players operating in the global drilling waste management market include SLB, Halliburton, Baker Hughes Company, Weatherford, NOV, SECURE ENERGY, GN Solids Control, TWMA, Scomi Group Bhd, and Clear Environmental Solutions. These major players have adopted various key development strategies such as business expansion, new product launches, and partnerships to strengthen their foothold in the competitive market.
Additional benefits you will get with this purchase are:
- Quarterly Update and* (only available with a corporate license, on listed price)
- 5 additional Company Profile of client Choice pre- or Post-purchase, as a free update.
- Free Upcoming Version on the Purchase of Five and Enterprise User License.
- 16 analyst hours of support* (post-purchase, if you find additional data requirements upon review of the report, you may receive support amounting to 16 analyst hours to solve questions, and post-sale queries)
- 15% Free Customization* (in case the scope or segment of the report does not match your requirements, 15% is equivalent to 3 working days of free work, applicable once)
- Free data Pack on the Five and Enterprise User License. (Excel version of the report)
- Free Updated report if the report is 6-12 months old or older.
- 24-hour priority response*
- Free Industry updates and white papers.
Possible Customization with this report (with additional cost and timeline, please talk to the sales executive to know more)
- Analysis of raw material in a product (by %)
- Installed Base analysis
- Investment Opportunities
- Upcoming/New Entrant by Regions
- Technology Trend Analysis
- Average Consumer Expenditure
- Market share analysis of players by products/segments
- New Product Development/ Product Matrix of Key Players
- Patient/epidemiology data at country, region, global level
- Additional company profiles with specific to client's interest
- Additional country or region analysis- market size and forecast
- Expanded list for Company Profiles
- Historic market data
- Key player details (including location, contact details, supplier/vendor network etc. in excel format)
- Market share analysis of players at global/region/country level
- SWOT Analysis
Key Market Segments
By Service Type
- Treatment Disposal
- Containment Handling
- Solids Control
By Application
- Onshore
- Offshore
By Region
- North America
- U.S.
- Canada
- Mexico
- Europe
- France
- Germany
- Italy
- Spain
- UK
- Rest of Europe
- Asia-Pacific
- China
- Japan
- India
- South Korea
- Australia
- Rest of Asia-Pacific
- LAMEA
- Brazil
- South Africa
- Saudi Arabia
- Rest of LAMEA
Key Market Players:
- SLB
- Halliburton
- Baker Hughes Company
- Weatherford
- NOV
- SECURE ENERGY
- GN Solids Control
- TWMA
- Scomi Group Bhd
- Clear Environmental Solutions
TABLE OF CONTENTS
CHAPTER 1: INTRODUCTION
- 1.1. Report Description
- 1.2. Key Market Segments
- 1.3. Key Benefits
- 1.4. Research Methodology
- 1.4.1. Primary Research
- 1.4.2. Secondary Research
- 1.4.3. Analyst Tools and Models
CHAPTER 2: EXECUTIVE SUMMARY
- 2.1. CXO Perspective
CHAPTER 3: MARKET LANDSCAPE
- 3.1. Market Definition and Scope
- 3.2. Key Findings
- 3.2.1. Top Investment Pockets
- 3.2.2. Top Winning Strategies
- 3.3. Porter's Five Forces Analysis
- 3.3.1. Bargaining Power of Suppliers
- 3.3.2. Threat of New Entrants
- 3.3.3. Threat of Substitutes
- 3.3.4. Competitive Rivalry
- 3.3.5. Bargaining Power among Buyers
- 3.4. Market Dynamics
- 3.4.1. Drivers
- 3.4.2. Restraints
- 3.4.3. Opportunities
CHAPTER 4: DRILLING WASTE MANAGEMENT MARKET, BY SERVICE TYPE
- 4.1. Market Overview
- 4.1.1 Market Size and Forecast, By Service Type
- 4.2. Treatment Disposal
- 4.2.1. Key Market Trends, Growth Factors and Opportunities
- 4.2.2. Market Size and Forecast, By Region
- 4.2.3. Market Share Analysis, By Country
- 4.3. Containment Handling
- 4.3.1. Key Market Trends, Growth Factors and Opportunities
- 4.3.2. Market Size and Forecast, By Region
- 4.3.3. Market Share Analysis, By Country
- 4.4. Solids Control
- 4.4.1. Key Market Trends, Growth Factors and Opportunities
- 4.4.2. Market Size and Forecast, By Region
- 4.4.3. Market Share Analysis, By Country
CHAPTER 5: DRILLING WASTE MANAGEMENT MARKET, BY APPLICATION
- 5.1. Market Overview
- 5.1.1 Market Size and Forecast, By Application
- 5.2. Onshore
- 5.2.1. Key Market Trends, Growth Factors and Opportunities
- 5.2.2. Market Size and Forecast, By Region
- 5.2.3. Market Share Analysis, By Country
- 5.3. Offshore
- 5.3.1. Key Market Trends, Growth Factors and Opportunities
- 5.3.2. Market Size and Forecast, By Region
- 5.3.3. Market Share Analysis, By Country
CHAPTER 6: DRILLING WASTE MANAGEMENT MARKET, BY REGION
- 6.1. Market Overview
- 6.1.1 Market Size and Forecast, By Region
- 6.2. North America
- 6.2.1. Key Market Trends and Opportunities
- 6.2.2. Market Size and Forecast, By Service Type
- 6.2.3. Market Size and Forecast, By Application
- 6.2.4. Market Size and Forecast, By Country
- 6.2.5. U.S. Drilling Waste Management Market
- 6.2.5.1. Market Size and Forecast, By Service Type
- 6.2.5.2. Market Size and Forecast, By Application
- 6.2.6. Canada Drilling Waste Management Market
- 6.2.6.1. Market Size and Forecast, By Service Type
- 6.2.6.2. Market Size and Forecast, By Application
- 6.2.7. Mexico Drilling Waste Management Market
- 6.2.7.1. Market Size and Forecast, By Service Type
- 6.2.7.2. Market Size and Forecast, By Application
- 6.3. Europe
- 6.3.1. Key Market Trends and Opportunities
- 6.3.2. Market Size and Forecast, By Service Type
- 6.3.3. Market Size and Forecast, By Application
- 6.3.4. Market Size and Forecast, By Country
- 6.3.5. France Drilling Waste Management Market
- 6.3.5.1. Market Size and Forecast, By Service Type
- 6.3.5.2. Market Size and Forecast, By Application
- 6.3.6. Germany Drilling Waste Management Market
- 6.3.6.1. Market Size and Forecast, By Service Type
- 6.3.6.2. Market Size and Forecast, By Application
- 6.3.7. Italy Drilling Waste Management Market
- 6.3.7.1. Market Size and Forecast, By Service Type
- 6.3.7.2. Market Size and Forecast, By Application
- 6.3.8. Spain Drilling Waste Management Market
- 6.3.8.1. Market Size and Forecast, By Service Type
- 6.3.8.2. Market Size and Forecast, By Application
- 6.3.9. UK Drilling Waste Management Market
- 6.3.9.1. Market Size and Forecast, By Service Type
- 6.3.9.2. Market Size and Forecast, By Application
- 6.3.10. Rest Of Europe Drilling Waste Management Market
- 6.3.10.1. Market Size and Forecast, By Service Type
- 6.3.10.2. Market Size and Forecast, By Application
- 6.4. Asia-Pacific
- 6.4.1. Key Market Trends and Opportunities
- 6.4.2. Market Size and Forecast, By Service Type
- 6.4.3. Market Size and Forecast, By Application
- 6.4.4. Market Size and Forecast, By Country
- 6.4.5. China Drilling Waste Management Market
- 6.4.5.1. Market Size and Forecast, By Service Type
- 6.4.5.2. Market Size and Forecast, By Application
- 6.4.6. Japan Drilling Waste Management Market
- 6.4.6.1. Market Size and Forecast, By Service Type
- 6.4.6.2. Market Size and Forecast, By Application
- 6.4.7. India Drilling Waste Management Market
- 6.4.7.1. Market Size and Forecast, By Service Type
- 6.4.7.2. Market Size and Forecast, By Application
- 6.4.8. South Korea Drilling Waste Management Market
- 6.4.8.1. Market Size and Forecast, By Service Type
- 6.4.8.2. Market Size and Forecast, By Application
- 6.4.9. Australia Drilling Waste Management Market
- 6.4.9.1. Market Size and Forecast, By Service Type
- 6.4.9.2. Market Size and Forecast, By Application
- 6.4.10. Rest of Asia-Pacific Drilling Waste Management Market
- 6.4.10.1. Market Size and Forecast, By Service Type
- 6.4.10.2. Market Size and Forecast, By Application
- 6.5. LAMEA
- 6.5.1. Key Market Trends and Opportunities
- 6.5.2. Market Size and Forecast, By Service Type
- 6.5.3. Market Size and Forecast, By Application
- 6.5.4. Market Size and Forecast, By Country
- 6.5.5. Brazil Drilling Waste Management Market
- 6.5.5.1. Market Size and Forecast, By Service Type
- 6.5.5.2. Market Size and Forecast, By Application
- 6.5.6. South Africa Drilling Waste Management Market
- 6.5.6.1. Market Size and Forecast, By Service Type
- 6.5.6.2. Market Size and Forecast, By Application
- 6.5.7. Saudi Arabia Drilling Waste Management Market
- 6.5.7.1. Market Size and Forecast, By Service Type
- 6.5.7.2. Market Size and Forecast, By Application
- 6.5.8. Rest of LAMEA Drilling Waste Management Market
- 6.5.8.1. Market Size and Forecast, By Service Type
- 6.5.8.2. Market Size and Forecast, By Application
CHAPTER 7: COMPETITIVE LANDSCAPE
- 7.1. Introduction
- 7.2. Top Winning Strategies
- 7.3. Product Mapping Of Top 10 Player
- 7.4. Competitive Dashboard
- 7.5. Competitive Heatmap
- 7.6. Top Player Positioning, 2023
CHAPTER 8: COMPANY PROFILES
- 8.1. SLB
- 8.1.1. Company Overview
- 8.1.2. Key Executives
- 8.1.3. Company Snapshot
- 8.1.4. Operating Business Segments
- 8.1.5. Product Portfolio
- 8.1.6. Business Performance
- 8.1.7. Key Strategic Moves and Developments
- 8.2. Halliburton
- 8.2.1. Company Overview
- 8.2.2. Key Executives
- 8.2.3. Company Snapshot
- 8.2.4. Operating Business Segments
- 8.2.5. Product Portfolio
- 8.2.6. Business Performance
- 8.2.7. Key Strategic Moves and Developments
- 8.3. Baker Hughes Company
- 8.3.1. Company Overview
- 8.3.2. Key Executives
- 8.3.3. Company Snapshot
- 8.3.4. Operating Business Segments
- 8.3.5. Product Portfolio
- 8.3.6. Business Performance
- 8.3.7. Key Strategic Moves and Developments
- 8.4. Weatherford
- 8.4.1. Company Overview
- 8.4.2. Key Executives
- 8.4.3. Company Snapshot
- 8.4.4. Operating Business Segments
- 8.4.5. Product Portfolio
- 8.4.6. Business Performance
- 8.4.7. Key Strategic Moves and Developments
- 8.5. NOV
- 8.5.1. Company Overview
- 8.5.2. Key Executives
- 8.5.3. Company Snapshot
- 8.5.4. Operating Business Segments
- 8.5.5. Product Portfolio
- 8.5.6. Business Performance
- 8.5.7. Key Strategic Moves and Developments
- 8.6. SECURE ENERGY
- 8.6.1. Company Overview
- 8.6.2. Key Executives
- 8.6.3. Company Snapshot
- 8.6.4. Operating Business Segments
- 8.6.5. Product Portfolio
- 8.6.6. Business Performance
- 8.6.7. Key Strategic Moves and Developments
- 8.7. GN Solids Control
- 8.7.1. Company Overview
- 8.7.2. Key Executives
- 8.7.3. Company Snapshot
- 8.7.4. Operating Business Segments
- 8.7.5. Product Portfolio
- 8.7.6. Business Performance
- 8.7.7. Key Strategic Moves and Developments
- 8.8. TWMA
- 8.8.1. Company Overview
- 8.8.2. Key Executives
- 8.8.3. Company Snapshot
- 8.8.4. Operating Business Segments
- 8.8.5. Product Portfolio
- 8.8.6. Business Performance
- 8.8.7. Key Strategic Moves and Developments
- 8.9. Scomi Group Bhd
- 8.9.1. Company Overview
- 8.9.2. Key Executives
- 8.9.3. Company Snapshot
- 8.9.4. Operating Business Segments
- 8.9.5. Product Portfolio
- 8.9.6. Business Performance
- 8.9.7. Key Strategic Moves and Developments
- 8.10. Clear Environmental Solutions
- 8.10.1. Company Overview
- 8.10.2. Key Executives
- 8.10.3. Company Snapshot
- 8.10.4. Operating Business Segments
- 8.10.5. Product Portfolio
- 8.10.6. Business Performance
- 8.10.7. Key Strategic Moves and Developments
 挖掘废弃物管理市场规模、份额、成长分析(按类型、废弃物来源、服务、应用、地区)- 2025 年至 2032 年产业预测
 2026 年至 2032 年挖掘废弃物管理市场(按服务、应用、废弃物类型和地区划分)
 钻井废弃物管理市场机会、成长动力、产业趋势分析及 2025 - 2034 年预测
 钻井废弃物管理服务市场 - 全球产业规模、份额、趋势、机会和预测,细分,按服务、按部署位置、按废弃物类型、按地区、按竞争,2020-2030F欠平衡钻井市场规模、份额、趋势分析报告:按技术、应用、地区、细分市场预测,2025-2030 年
 到 2030 年地下水管理市场预测:按服务、技术、应用和地区分類的全球分析
 开采废弃物管理市场:各类服务,各废弃物类型,各用途,各地区,机会,预测,2018年~2032年日本的开采废弃物管理市场:各类服务,各废弃物类型,各用途,各地区,机会,预测,2018年~2032年美国的开采废弃物管理市场:各类服务,各废弃物类型,各用途,各地区,机会,预测,2018年~2032年
 开采废弃物管理市场,规模,占有率,趋势,产业分析报告:各用途,各类服务,各地区 - 市场预测 2025年~2034年