


 |
市场调查报告书
商品编码
1641801
全球压缩机油市场按类型和最终用途行业划分 - 机会分析和行业预测(2024-2033 年)Compressor Oils Market By Type (Synthetic Oil, Mineral Oil) , By End-Use Industry (Construction, Mining, Automotive, Manufacturing Industry, Others) : Global Opportunity Analysis and Industry Forecast, 2024-2033 |
||||||
压缩机油市场
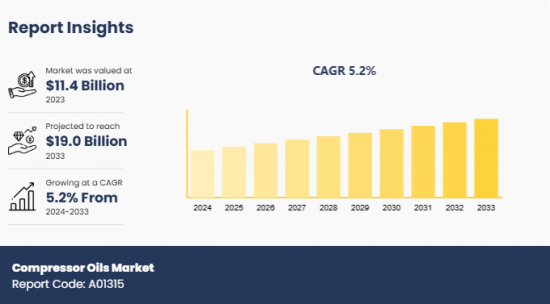
2023 年压缩机油市场价值为 114 亿美元,预计到 2033 年将达到 190 亿美元,2024 年至 2033 年的复合年增长率为 5.2%。
压缩机油是一种高黏度润滑剂,可减少空气压缩机中的摩擦和热量,而空气压缩机是冷冻、空调、汽车和製造业等各种行业使用的设备。在某些类型中,例如螺桿和活塞压缩机,油充当密封剂,以确保运动部件之间的间隙。压缩机油的主要特性是热稳定性、抗泡沫性、抗氧化性和低倾点。
住宅、商业和工业领域的快速成长促进了压缩机油市场的成长。这些行业严重依赖各种机械设备,从而推动了对压缩机油的需求。此外,各行业实施严格的能源效率标准,也促进了压缩机油的使用,因为压缩机油能够透过平稳运行和减少能量损失来最大限度地降低设备的能耗。为了使压缩机油更具永续性,製造商正在开发可再生的植物油。虽然目前生物基油的发展趋势尚处于起步阶段,但随着多个行业专注于采用环保实践和解决方案来实现其环境目标,预计它将成为未来的突出趋势。
然而,压缩机油发展所需的添加剂、原油等原料成本的波动,影响了整体价格结构,阻碍了市场的发展。此外,非石油类润滑油的出现给压缩机油带来了巨大的竞争,抑制了市场的成长。相反,可再生能源基础设施的扩张预计将为压缩机油市场提供有利可图的机会,因为风力发电、太阳能发电和沼气生产主要依靠压缩机来完成各种过程。国际能源总署(IEA)预测,到2030年全球可再生能源装置容量将成长至5,520吉瓦以上。由于为满足可再生能源目标,压缩机需求预计将激增,这有望为压缩机油市场的新成长铺平道路。
部分回顾
压缩机油市场分为类型、最终用途产业和地区。根据类型,市场分为合成油和矿物油。根据最终用途行业,分为建筑、采矿、汽车、製造业和其他。按地区分析,涵盖北美、欧洲、亚太地区、拉丁美洲、中东和非洲。
主要发现
按类型划分,合成油在 2023 年占据最高的市场占有率。
基于最终用途产业,製造业在 2023 年的市场中占有显着地位。
按地区划分,预计亚太地区将在 2023 年创造最高收益。
本报告中提供的自订功能
- 生产能力
- 最终用户的偏好和痛点
- 按地区分類的行业生命週期评估
- 装置量分析
- 投资机会
- 产品基准/产品规格及应用
- 产品生命週期
- 情境分析与成长趋势比较
- 科技趋势分析
- 经销商利润分析
- 打入市场策略
- 按产品/细分市场进行市场细分
- 主要企业的新产品开发/产品矩阵
- 监管指南
- 根据客户兴趣提供额外的公司简介
- 按国家或地区进行的额外分析 - 市场规模和预测
- 品牌占有率分析
- 历史市场资料
- 导入/汇出分析/资料
- Excel 格式的主要企业详细资料(包括位置、联络资讯、供应商/供应商网路等)
- 客户/消费者/原料供应商名单-价值链分析
- 公司市场占有率分析:全球/地区/国家
- 人均消费趋势
- 产品消费分析
- SWOT 分析
目录
第 1 章 简介
第 2 章执行摘要
第三章 市场状况
- 市场定义和范围
- 主要发现
- 主要投资机会
- 关键成功策略
- 波特五力分析
- 市场动态
- 驱动程式
- 限制因素
- 机会
第 4 章 压缩机油市场(按类型)
- 市场概况
- 合成油
- 矿物油
5. 压缩机油市场(依最终用途产业划分)
- 市场概况
- 建造
- 矿业
- 汽车
- 製造业
- 其他的
6. 压缩机油市场(按地区)
- 市场概况
- 北美洲
- 主要市场趋势和机会
- 美国压缩机油市场
- 加拿大压缩机油市场
- 墨西哥压缩机油市场
- 欧洲
- 主要市场趋势和机会
- 法国压缩机油市场
- 德国压缩机油市场
- 义大利压缩机油市场
- 西班牙压缩机油市场
- 英国压缩机油市场
- 其他欧洲国家压缩机油市场
- 亚太地区
- 主要市场趋势和机会
- 中国压缩机油市场
- 日本压缩机油市场
- 印度压缩机油市场
- 韩国压缩机油市场
- 澳洲压缩机油市场
- 亚太地区其他地区压缩机油市场
- 拉丁美洲、中东和非洲 (LAMEA)
- 主要市场趋势和机会
- 巴西压缩机油市场
- 南非压缩机油市场
- 沙乌地阿拉伯压缩机油市场
- 其他LAMEA压缩机油市场
第七章 竞争格局
- 介绍
- 关键成功策略
- 前 10 家公司的产品映射
- 竞争仪錶板
- 竞争热图
- 主要企业定位(2023年)
第八章 公司简介
- Shell Plc,
- ExxonMobil Corporation
- Chevron Corporation
- Total Energies SE
- Indian Oil Corporation Ltd
- The Lubrizol Corporation
- BASF SE
- ENI SpA
- BP PLC
- Atlas Copco Compressors LLC
Compressor Oils Market
The compressor oils market was valued at $11.4 billion in 2023 and is projected to reach $19.0 billion by 2033, growing at a CAGR of 5.2% from 2024 to 2033.
Compressor oil is a high-viscosity lubricant that reduces friction and heat in air compressors, an equipment used in various industries such as refrigeration, air conditioning, automotive, and manufacturing. In certain types, such as screw or piston compressors, the oil acts as a sealant by securing the clearance spaces between moving parts. The major characteristics of compressor oils are their thermal stability, foam resistance, oxidation resistance, and low pour point.
The growth of the compressor oils market is being augmented by rapid surge in the residential, commercial, and industrial sectors. These sectors heavily rely on different machinery and equipment, which fuels the demand for compressor oils. Furthermore, the enforcement of stringent energy efficiency standards for different industries has boosted the usage of compressor oils due to their ability to minimize energy consumption of equipment via smooth operations and reduced energy losses. To enhance the sustainability of compressor oils, manufacturers are exploring the formation of these oils from renewable and plant-based sources. Currently at a nascent stage, the development of bio-based oils is poised to become a prominent trend in the future as several industries are focusing on the adoption of eco-friendly practices and solutions to contribute to environmental goals.
However, fluctuations in the costs of raw materials required to develop compressor oils, such as additives & crude oil, affect the overall pricing structure and hamper the development of the market. Moreover, the availability of non-oil-based lubricants presents significant competition to the compressor oils, thereby restraining the market growth. Contrarily, expansion of the renewable energy infrastructure is anticipated to present lucrative opportunities for the compressor oils market as wind energy, solar power, and biogas production primarily rely on compressors to accomplish different processes. The International Energy Agency anticipates the global renewable capacity to increase to over 5,520 GW by 2030. This is expected to open new avenues for the compressor oils market due to projected surge in requirement for compressors to achieve the renewable targets.
Segment Review
The compressor oils market is segmented into type, end-use industry, and region. On the basis of type, the market is bifurcated into synthetic oil and mineral oil. Depending on end-use industry, it is classified into construction, mining, automotive, manufacturing industry, and others. Region wise, it is analyzed across North America, Europe, Asia-Pacific, and LAMEA.
Key Findings
On the basis of type, the synthetic oil segment held the highest market share in 2023.
Depending on end-use industry, the manufacturing industry segment acquired a notable stake in the market in 2023.
Region wise, Asia-Pacific was the highest revenue generator in 2023.
Competition Analysis
The major players in the global compressor oils market include Shell Plc, ExxonMobil Corporation, Chevron Corporation, Total Energies SE, Indian Oil Corporation Ltd., The Lubrizol Corporation, BASF SE, ENI S.p.A, BP PLC, and Atlas Copco Compressors LLC. These major players have adopted various key development strategies such as business expansion, new product launches, and partnerships to strengthen their foothold in the competitive market.
Additional benefits you will get with this purchase are:
- Quarterly Update and* (only available with a corporate license, on listed price)
- 5 additional Company Profile of client Choice pre- or Post-purchase, as a free update.
- Free Upcoming Version on the Purchase of Five and Enterprise User License.
- 16 analyst hours of support* (post-purchase, if you find additional data requirements upon review of the report, you may receive support amounting to 16 analyst hours to solve questions, and post-sale queries)
- 15% Free Customization* (in case the scope or segment of the report does not match your requirements, 15% is equivalent to 3 working days of free work, applicable once)
- Free data Pack on the Five and Enterprise User License. (Excel version of the report)
- Free Updated report if the report is 6-12 months old or older.
- 24-hour priority response*
- Free Industry updates and white papers.
Possible Customization with this report (with additional cost and timeline, please talk to the sales executive to know more)
- Manufacturing Capacity
- End user preferences and pain points
- Industry life cycle assessment, by region
- Installed Base analysis
- Investment Opportunities
- Product Benchmarking / Product specification and applications
- Product Life Cycles
- Scenario Analysis & Growth Trend Comparison
- Technology Trend Analysis
- Distributor margin Analysis
- Go To Market Strategy
- Market share analysis of players by products/segments
- New Product Development/ Product Matrix of Key Players
- Regulatory Guidelines
- Additional company profiles with specific to client's interest
- Additional country or region analysis- market size and forecast
- Brands Share Analysis
- Historic market data
- Import Export Analysis/Data
- Key player details (including location, contact details, supplier/vendor network etc. in excel format)
- List of customers/consumers/raw material suppliers- value chain analysis
- Market share analysis of players at global/region/country level
- Per Capita Consumption Trends
- Product Consumption Analysis
- SWOT Analysis
Key Market Segments
By Type
- Synthetic Oil
- Mineral Oil
By End-Use Industry
- Construction
- Mining
- Automotive
- Manufacturing Industry
- Others
By Region
- North America
- U.S.
- Canada
- Mexico
- Europe
- France
- Germany
- Italy
- Spain
- UK
- Rest of Europe
- Asia-Pacific
- China
- Japan
- India
- South Korea
- Australia
- Rest of Asia-Pacific
- LAMEA
- Brazil
- South Africa
- Saudi Arabia
- Rest of LAMEA
Key Market Players:
- Shell Plc,
- ExxonMobil Corporation
- Chevron Corporation
- Total Energies SE
- Indian Oil Corporation Ltd
- The Lubrizol Corporation
- BASF SE
- ENI S.p.A
- BP PLC
- Atlas Copco Compressors LLC
TABLE OF CONTENTS
CHAPTER 1: INTRODUCTION
- 1.1. Report Description
- 1.2. Key Market Segments
- 1.3. Key Benefits
- 1.4. Research Methodology
- 1.4.1. Primary Research
- 1.4.2. Secondary Research
- 1.4.3. Analyst Tools and Models
CHAPTER 2: EXECUTIVE SUMMARY
- 2.1. CXO Perspective
CHAPTER 3: MARKET LANDSCAPE
- 3.1. Market Definition and Scope
- 3.2. Key Findings
- 3.2.1. Top Investment Pockets
- 3.2.2. Top Winning Strategies
- 3.3. Porter's Five Forces Analysis
- 3.3.1. Bargaining Power of Suppliers
- 3.3.2. Threat of New Entrants
- 3.3.3. Threat of Substitutes
- 3.3.4. Competitive Rivalry
- 3.3.5. Bargaining Power among Buyers
- 3.4. Market Dynamics
- 3.4.1. Drivers
- 3.4.2. Restraints
- 3.4.3. Opportunities
CHAPTER 4: COMPRESSOR OILS MARKET, BY TYPE
- 4.1. Market Overview
- 4.1.1 Market Size and Forecast, By Type
- 4.2. Synthetic Oil
- 4.2.1. Key Market Trends, Growth Factors and Opportunities
- 4.2.2. Market Size and Forecast, By Region
- 4.2.3. Market Share Analysis, By Country
- 4.3. Mineral Oil
- 4.3.1. Key Market Trends, Growth Factors and Opportunities
- 4.3.2. Market Size and Forecast, By Region
- 4.3.3. Market Share Analysis, By Country
CHAPTER 5: COMPRESSOR OILS MARKET, BY END-USE INDUSTRY
- 5.1. Market Overview
- 5.1.1 Market Size and Forecast, By End-use Industry
- 5.2. Construction
- 5.2.1. Key Market Trends, Growth Factors and Opportunities
- 5.2.2. Market Size and Forecast, By Region
- 5.2.3. Market Share Analysis, By Country
- 5.3. Mining
- 5.3.1. Key Market Trends, Growth Factors and Opportunities
- 5.3.2. Market Size and Forecast, By Region
- 5.3.3. Market Share Analysis, By Country
- 5.4. Automotive
- 5.4.1. Key Market Trends, Growth Factors and Opportunities
- 5.4.2. Market Size and Forecast, By Region
- 5.4.3. Market Share Analysis, By Country
- 5.5. Manufacturing Industry
- 5.5.1. Key Market Trends, Growth Factors and Opportunities
- 5.5.2. Market Size and Forecast, By Region
- 5.5.3. Market Share Analysis, By Country
- 5.6. Others
- 5.6.1. Key Market Trends, Growth Factors and Opportunities
- 5.6.2. Market Size and Forecast, By Region
- 5.6.3. Market Share Analysis, By Country
CHAPTER 6: COMPRESSOR OILS MARKET, BY REGION
- 6.1. Market Overview
- 6.1.1 Market Size and Forecast, By Region
- 6.2. North America
- 6.2.1. Key Market Trends and Opportunities
- 6.2.2. Market Size and Forecast, By Type
- 6.2.3. Market Size and Forecast, By End-use Industry
- 6.2.4. Market Size and Forecast, By Country
- 6.2.5. U.S. Compressor Oils Market
- 6.2.5.1. Market Size and Forecast, By Type
- 6.2.5.2. Market Size and Forecast, By End-use Industry
- 6.2.6. Canada Compressor Oils Market
- 6.2.6.1. Market Size and Forecast, By Type
- 6.2.6.2. Market Size and Forecast, By End-use Industry
- 6.2.7. Mexico Compressor Oils Market
- 6.2.7.1. Market Size and Forecast, By Type
- 6.2.7.2. Market Size and Forecast, By End-use Industry
- 6.3. Europe
- 6.3.1. Key Market Trends and Opportunities
- 6.3.2. Market Size and Forecast, By Type
- 6.3.3. Market Size and Forecast, By End-use Industry
- 6.3.4. Market Size and Forecast, By Country
- 6.3.5. France Compressor Oils Market
- 6.3.5.1. Market Size and Forecast, By Type
- 6.3.5.2. Market Size and Forecast, By End-use Industry
- 6.3.6. Germany Compressor Oils Market
- 6.3.6.1. Market Size and Forecast, By Type
- 6.3.6.2. Market Size and Forecast, By End-use Industry
- 6.3.7. Italy Compressor Oils Market
- 6.3.7.1. Market Size and Forecast, By Type
- 6.3.7.2. Market Size and Forecast, By End-use Industry
- 6.3.8. Spain Compressor Oils Market
- 6.3.8.1. Market Size and Forecast, By Type
- 6.3.8.2. Market Size and Forecast, By End-use Industry
- 6.3.9. UK Compressor Oils Market
- 6.3.9.1. Market Size and Forecast, By Type
- 6.3.9.2. Market Size and Forecast, By End-use Industry
- 6.3.10. Rest Of Europe Compressor Oils Market
- 6.3.10.1. Market Size and Forecast, By Type
- 6.3.10.2. Market Size and Forecast, By End-use Industry
- 6.4. Asia-Pacific
- 6.4.1. Key Market Trends and Opportunities
- 6.4.2. Market Size and Forecast, By Type
- 6.4.3. Market Size and Forecast, By End-use Industry
- 6.4.4. Market Size and Forecast, By Country
- 6.4.5. China Compressor Oils Market
- 6.4.5.1. Market Size and Forecast, By Type
- 6.4.5.2. Market Size and Forecast, By End-use Industry
- 6.4.6. Japan Compressor Oils Market
- 6.4.6.1. Market Size and Forecast, By Type
- 6.4.6.2. Market Size and Forecast, By End-use Industry
- 6.4.7. India Compressor Oils Market
- 6.4.7.1. Market Size and Forecast, By Type
- 6.4.7.2. Market Size and Forecast, By End-use Industry
- 6.4.8. South Korea Compressor Oils Market
- 6.4.8.1. Market Size and Forecast, By Type
- 6.4.8.2. Market Size and Forecast, By End-use Industry
- 6.4.9. Australia Compressor Oils Market
- 6.4.9.1. Market Size and Forecast, By Type
- 6.4.9.2. Market Size and Forecast, By End-use Industry
- 6.4.10. Rest of Asia-Pacific Compressor Oils Market
- 6.4.10.1. Market Size and Forecast, By Type
- 6.4.10.2. Market Size and Forecast, By End-use Industry
- 6.5. LAMEA
- 6.5.1. Key Market Trends and Opportunities
- 6.5.2. Market Size and Forecast, By Type
- 6.5.3. Market Size and Forecast, By End-use Industry
- 6.5.4. Market Size and Forecast, By Country
- 6.5.5. Brazil Compressor Oils Market
- 6.5.5.1. Market Size and Forecast, By Type
- 6.5.5.2. Market Size and Forecast, By End-use Industry
- 6.5.6. South Africa Compressor Oils Market
- 6.5.6.1. Market Size and Forecast, By Type
- 6.5.6.2. Market Size and Forecast, By End-use Industry
- 6.5.7. Saudi Arabia Compressor Oils Market
- 6.5.7.1. Market Size and Forecast, By Type
- 6.5.7.2. Market Size and Forecast, By End-use Industry
- 6.5.8. Rest of LAMEA Compressor Oils Market
- 6.5.8.1. Market Size and Forecast, By Type
- 6.5.8.2. Market Size and Forecast, By End-use Industry
CHAPTER 7: COMPETITIVE LANDSCAPE
- 7.1. Introduction
- 7.2. Top Winning Strategies
- 7.3. Product Mapping Of Top 10 Player
- 7.4. Competitive Dashboard
- 7.5. Competitive Heatmap
- 7.6. Top Player Positioning, 2023
CHAPTER 8: COMPANY PROFILES
- 8.1. Shell Plc,
- 8.1.1. Company Overview
- 8.1.2. Key Executives
- 8.1.3. Company Snapshot
- 8.1.4. Operating Business Segments
- 8.1.5. Product Portfolio
- 8.1.6. Business Performance
- 8.1.7. Key Strategic Moves and Developments
- 8.2. ExxonMobil Corporation
- 8.2.1. Company Overview
- 8.2.2. Key Executives
- 8.2.3. Company Snapshot
- 8.2.4. Operating Business Segments
- 8.2.5. Product Portfolio
- 8.2.6. Business Performance
- 8.2.7. Key Strategic Moves and Developments
- 8.3. Chevron Corporation
- 8.3.1. Company Overview
- 8.3.2. Key Executives
- 8.3.3. Company Snapshot
- 8.3.4. Operating Business Segments
- 8.3.5. Product Portfolio
- 8.3.6. Business Performance
- 8.3.7. Key Strategic Moves and Developments
- 8.4. Total Energies SE
- 8.4.1. Company Overview
- 8.4.2. Key Executives
- 8.4.3. Company Snapshot
- 8.4.4. Operating Business Segments
- 8.4.5. Product Portfolio
- 8.4.6. Business Performance
- 8.4.7. Key Strategic Moves and Developments
- 8.5. Indian Oil Corporation Ltd
- 8.5.1. Company Overview
- 8.5.2. Key Executives
- 8.5.3. Company Snapshot
- 8.5.4. Operating Business Segments
- 8.5.5. Product Portfolio
- 8.5.6. Business Performance
- 8.5.7. Key Strategic Moves and Developments
- 8.6. The Lubrizol Corporation
- 8.6.1. Company Overview
- 8.6.2. Key Executives
- 8.6.3. Company Snapshot
- 8.6.4. Operating Business Segments
- 8.6.5. Product Portfolio
- 8.6.6. Business Performance
- 8.6.7. Key Strategic Moves and Developments
- 8.7. BASF SE
- 8.7.1. Company Overview
- 8.7.2. Key Executives
- 8.7.3. Company Snapshot
- 8.7.4. Operating Business Segments
- 8.7.5. Product Portfolio
- 8.7.6. Business Performance
- 8.7.7. Key Strategic Moves and Developments
- 8.8. ENI S.p.A
- 8.8.1. Company Overview
- 8.8.2. Key Executives
- 8.8.3. Company Snapshot
- 8.8.4. Operating Business Segments
- 8.8.5. Product Portfolio
- 8.8.6. Business Performance
- 8.8.7. Key Strategic Moves and Developments
- 8.9. BP PLC
- 8.9.1. Company Overview
- 8.9.2. Key Executives
- 8.9.3. Company Snapshot
- 8.9.4. Operating Business Segments
- 8.9.5. Product Portfolio
- 8.9.6. Business Performance
- 8.9.7. Key Strategic Moves and Developments
- 8.10. Atlas Copco Compressors LLC
- 8.10.1. Company Overview
- 8.10.2. Key Executives
- 8.10.3. Company Snapshot
- 8.10.4. Operating Business Segments
- 8.10.5. Product Portfolio
- 8.10.6. Business Performance
- 8.10.7. Key Strategic Moves and Developments
 压缩机油市场-全球产业规模、份额、趋势、机会和预测,按基础油、压缩机类型、应用、地区和竞争细分,2020-2030 年预测
 2025-2029年全球压缩机油市场
 压缩机油市场规模、份额、趋势分析报告:按压缩机、基油油、最终用途、地区、细分市场预测,2025-2030 年
 2025 年压缩机油全球市场报告
 压缩机油市场规模、份额、趋势及预测(依压缩机类型、基础油、应用、最终用途产业及地区划分),2025 年至 2033 年PAG 压缩机油市场机会、成长动力、产业趋势分析与预测 2025 - 2034 年
 压缩机油市场:按压缩机类型、基油、应用、最终用途行业划分 - 2025-2030 年全球预测
 压缩机油的全球市场规模:基础油,各压缩机类型,各终端用户产业,各地区,范围及预测
 压缩机油市场报告:2030 年趋势、预测与竞争分析