


 |
市场调查报告书
商品编码
1641813
全球智慧电錶市场(按相位类型和最终用途行业)- 机会分析和行业预测,2024 年至 2033 年Smart Electricity Meter Market By Phase Type (Single Phase, Three Phase) , By End-Use Industry (Residential, Commercial, Industrial) : Global Opportunity Analysis and Industry Forecast, 2024-2033 |
||||||
智慧电錶市场
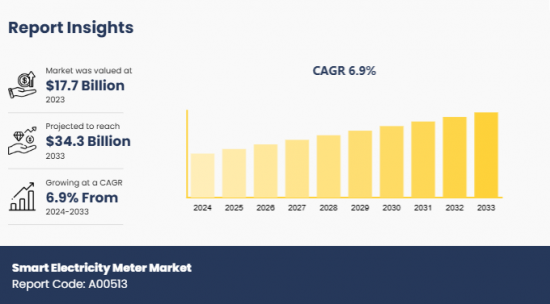
智慧电錶市场规模预计在 2023 年达到 177 亿美元,到 2033 年将达到 343 亿美元,2024 年至 2033 年的复合年增长率为 6.9%。
智慧电錶以数位方式即时测量和记录住宅和商业空间的电力消耗,提供全面的消费模式见解,帮助消费者优化使用并减少电费。智慧电錶的主要功能包括远端双向通讯、自动收费、整合到智慧家庭系统和先进的安全通讯协定。
人们对电力消耗不断增长的担忧日益加剧,这刺激了智慧电錶的采用,因为它们能够透过即时监控来提高能源效率。此外,物联网设备的日益使用使得对电力消耗进行管理的需求成为必要,这反过来又推动了智慧电錶的采用,有助于市场的发展。预计未来几年会流行的一个新兴趋势是将人工智慧功能整合到仪表中,以透过预测性维护来增强公共产业营运。此外,人工智慧将实现智慧电錶与区块链技术的结合,以防止能源盗窃。
然而,智慧电錶相对于传统电錶的成本较高,使得一些精打细算的消费者和组织对于投资智慧电錶犹豫不决,阻碍了市场的发展。此外,将先进的智慧电錶与现有基础设施同步在技术上很复杂,需要大量专业知识。缺乏熟练的技术人员和不当实施的可能性严重限制了智慧电錶市场的成长。相反,越来越多地使用再生能源来源来满足能源需求预计将为智慧电錶市场带来丰厚的机会。这是因为智慧电錶对于管理和分配太阳能板和风力发电机产生的剩余能源至关重要。根据国际能源总署 (IEA) 的数据,到 2030 年,电力、暖气和运输领域的可再生能源消耗预计将增加 60%。这表明在不久的将来对智慧电錶的需求可能会增加。
部分回顾
智慧电錶市场根据相类型、最终使用产业和地区进行细分。根据相位类型,市场分为单相和三相。根据最终用途产业,它们被分为住宅、商业用和工业。按地区分析,涵盖北美、欧洲、亚太、拉丁美洲以及中东和非洲。
主要发现
根据相类型,预计单相部分将在预测期内占据市场主导地位。
根据终端使用产业,预计住宅领域将在 2024 年至 2033 年间占据相当大的份额。
按地区划分,预计到 2033 年北美将创造最高收益。
此报告可进行客製化(可能需要支付额外费用和製定时间表)
- 生产能力
- 产品生命週期
- 新进者(按地区)
- 科技趋势分析
- 打入市场策略
- 按产品/细分市场进行市场细分
- 主要参与者的新产品开发/产品矩阵
- 监管指南
- 根据客户兴趣客製的其他公司简介
- 扩展公司简介列表
- 历史市场资料
- Excel 格式的主要企业详细资料(包括位置、联络资讯、供应商/供应商网路等)
- SWOT 分析
目录
第 1 章 简介
第 2 章执行摘要
第三章 市场状况
- 市场定义和范围
- 主要发现
- 重大投资机会
- 关键成功策略
- 波特五力分析
- 市场动态
- 驱动程式
- 限制因素
- 机会
第电錶章。
- 市场概况
- 单相
- 三相
第电錶章。
- 市场概况
- 住宅
- 商业的
- 工业的
第六章 智慧电錶市场(按区域)
- 市场概况
- 北美洲
- 主要市场趋势和机会
- 美国智慧电錶市场
- 加拿大智慧电錶市场
- 墨西哥智慧电錶市场
- 欧洲
- 主要市场趋势和机会
- 法国智慧电錶市场
- 德国智慧电錶市场
- 义大利智慧电錶市场
- 西班牙智慧电錶市场
- 英国智慧电錶市场
- 其他欧洲国家智慧电錶市场
- 亚太地区
- 主要市场趋势和机会
- 中国智慧电錶市场
- 日本智慧电錶市场
- 印度智慧电錶市场
- 韩国智慧电錶市场
- 澳洲智慧电錶市场
- 亚太地区其他智慧电錶市场
- 拉丁美洲、中东和非洲
- 主要市场趋势和机会
- 巴西智慧电錶市场
- 南非智慧电錶市场
- 沙乌地阿拉伯的智慧电錶市场
- 拉丁美洲其他地区、中东和非洲智慧电錶市场
第七章 竞争格局
- 介绍
- 关键成功策略
- 前 10 家公司的产品映射
- 竞争仪錶板
- 竞争热图
- 2023年主要企业的定位
第八章 公司简介
- Itron Inc
- Xylem Inc.
- Schneider Electric
- Siemens
- Honeywell International Inc
- Hubbell
- Tantalus Systems
- Jiangsu Linyang Energy Co
- Apator SA
Smart Electricity Meter Market
The smart electricity meter market was valued at $17.7 billion in 2023 and is projected to reach $34.3 billion by 2033, growing at a CAGR of 6.9% from 2024 to 2033.
A smart electricity meter digitally measures & records the consumption of electricity in residential and commercial spaces in real time, offering comprehensive insights into consumption patterns and helping consumers to optimize their usage & reduce billing. The key features of smart electricity meters include remote two-way communication, automated billing, integration into smart home systems, and advanced security protocols.
Increase in concerns regarding upsurging electricity consumption has fueled the adoption of smart meters owing to their ability to facilitate energy efficiency through real-time monitoring. Furthermore, rise in the usage of the Internet of Things devices has necessitated the management of electricity consumption, which boosts the usage of smart meters and propels the development of the market. An emerging trend poised to acquire traction in the coming years is the integration of AI capabilities into the meter to enhance utility operations through predictive maintenance. Moreover, AI enables the integration of smart meters with blockchain technology to prevent energy theft.
However, the higher cost of smart electricity meters as compared to the conventional ones deters several budget-sensitive consumers and organizations from investing in them, thereby hampering the development of the market. In addition, synchronizing the advanced smart meters with the existing infrastructure requires significant expertise owing to the technical complexities. Due to lack of skilled technicians and probability of improper implementation the growth of the smart electricity meter market is restrained notably. Contrarily, rise in the usage of renewable sources to meet the energy requirements is projected to present remunerative opportunities for the smart electricity meter market. This is attributed to the essentiality of smart meters for the management and distribution of excess energy generated by solar panels or wind turbines. According to the International Energy Agency, the consumption of renewable energy in the power, heat, and transport sectors is projected to increase by 60% by 2030. This indicates the potential increase in demand for smart meters in the near future.
Segment Review
The smart electricity meter market is segmented into phase type, end-use industry, and region. On the basis of phase type, the market is bifurcated into single phase and three phase. Depending on end-use industry, it is categorized into residential, commercial, and industrial. Region wise, it is analyzed across North America, Europe, Asia-Pacific, and LAMEA.
Key Findings
On the basis of phase type, the single phase segment is expected to dominate the market during the forecast period.
Depending on end-use industry, the residential segment is projected to acquire a notable stake from 2024 to 2033.
Region wise, North America is anticipated to be the highest revenue generator by 2033.
Competition Analysis
The leading players operating in the global smart electricity meter market include Itron Inc., Xylem Inc., Schneider Electric, Siemens, Honeywell International Inc., Hubbell, Tantalus Systems, Jiangsu Linyang Energy Co., and Apator S.A. These major players have adopted various key development strategies such as business expansion, new product launches, and partnerships to strengthen their foothold in the competitive market.
Additional benefits you will get with this purchase are:
- Quarterly Update and* (only available with a corporate license, on listed price)
- 5 additional Company Profile of client Choice pre- or Post-purchase, as a free update.
- Free Upcoming Version on the Purchase of Five and Enterprise User License.
- 16 analyst hours of support* (post-purchase, if you find additional data requirements upon review of the report, you may receive support amounting to 16 analyst hours to solve questions, and post-sale queries)
- 15% Free Customization* (in case the scope or segment of the report does not match your requirements, 15% is equivalent to 3 working days of free work, applicable once)
- Free data Pack on the Five and Enterprise User License. (Excel version of the report)
- Free Updated report if the report is 6-12 months old or older.
- 24-hour priority response*
- Free Industry updates and white papers.
Possible Customization with this report (with additional cost and timeline, please talk to the sales executive to know more)
- Manufacturing Capacity
- Product Life Cycles
- Upcoming/New Entrant by Regions
- Technology Trend Analysis
- Go To Market Strategy
- Market share analysis of players by products/segments
- New Product Development/ Product Matrix of Key Players
- Regulatory Guidelines
- Additional company profiles with specific to client's interest
- Expanded list for Company Profiles
- Historic market data
- Key player details (including location, contact details, supplier/vendor network etc. in excel format)
- SWOT Analysis
Key Market Segments
By Phase Type
- Single Phase
- Three Phase
By End-Use Industry
- Residential
- Commercial
- Industrial
By Region
- North America
- U.S.
- Canada
- Mexico
- Europe
- France
- Germany
- Italy
- Spain
- UK
- Rest of Europe
- Asia-Pacific
- China
- Japan
- India
- South Korea
- Australia
- Rest of Asia-Pacific
- LAMEA
- Brazil
- South Africa
- Saudi Arabia
- Rest of LAMEA
Key Market Players:
- Itron Inc
- Xylem Inc.
- Schneider Electric
- Siemens
- Honeywell International Inc
- Hubbell
- Tantalus Systems
- Jiangsu Linyang Energy Co
- Apator S.A
TABLE OF CONTENTS
CHAPTER 1: INTRODUCTION
- 1.1. Report Description
- 1.2. Key Market Segments
- 1.3. Key Benefits
- 1.4. Research Methodology
- 1.4.1. Primary Research
- 1.4.2. Secondary Research
- 1.4.3. Analyst Tools and Models
CHAPTER 2: EXECUTIVE SUMMARY
- 2.1. CXO Perspective
CHAPTER 3: MARKET LANDSCAPE
- 3.1. Market Definition and Scope
- 3.2. Key Findings
- 3.2.1. Top Investment Pockets
- 3.2.2. Top Winning Strategies
- 3.3. Porter's Five Forces Analysis
- 3.3.1. Bargaining Power of Suppliers
- 3.3.2. Threat of New Entrants
- 3.3.3. Threat of Substitutes
- 3.3.4. Competitive Rivalry
- 3.3.5. Bargaining Power among Buyers
- 3.4. Market Dynamics
- 3.4.1. Drivers
- 3.4.2. Restraints
- 3.4.3. Opportunities
CHAPTER 4: SMART ELECTRICITY METER MARKET, BY PHASE TYPE
- 4.1. Market Overview
- 4.1.1 Market Size and Forecast, By Phase Type
- 4.2. Single Phase
- 4.2.1. Key Market Trends, Growth Factors and Opportunities
- 4.2.2. Market Size and Forecast, By Region
- 4.2.3. Market Share Analysis, By Country
- 4.3. Three Phase
- 4.3.1. Key Market Trends, Growth Factors and Opportunities
- 4.3.2. Market Size and Forecast, By Region
- 4.3.3. Market Share Analysis, By Country
CHAPTER 5: SMART ELECTRICITY METER MARKET, BY END-USE INDUSTRY
- 5.1. Market Overview
- 5.1.1 Market Size and Forecast, By End-use Industry
- 5.2. Residential
- 5.2.1. Key Market Trends, Growth Factors and Opportunities
- 5.2.2. Market Size and Forecast, By Region
- 5.2.3. Market Share Analysis, By Country
- 5.3. Commercial
- 5.3.1. Key Market Trends, Growth Factors and Opportunities
- 5.3.2. Market Size and Forecast, By Region
- 5.3.3. Market Share Analysis, By Country
- 5.4. Industrial
- 5.4.1. Key Market Trends, Growth Factors and Opportunities
- 5.4.2. Market Size and Forecast, By Region
- 5.4.3. Market Share Analysis, By Country
CHAPTER 6: SMART ELECTRICITY METER MARKET, BY REGION
- 6.1. Market Overview
- 6.1.1 Market Size and Forecast, By Region
- 6.2. North America
- 6.2.1. Key Market Trends and Opportunities
- 6.2.2. Market Size and Forecast, By Phase Type
- 6.2.3. Market Size and Forecast, By End-use Industry
- 6.2.4. Market Size and Forecast, By Country
- 6.2.5. U.S. Smart Electricity Meter Market
- 6.2.5.1. Market Size and Forecast, By Phase Type
- 6.2.5.2. Market Size and Forecast, By End-use Industry
- 6.2.6. Canada Smart Electricity Meter Market
- 6.2.6.1. Market Size and Forecast, By Phase Type
- 6.2.6.2. Market Size and Forecast, By End-use Industry
- 6.2.7. Mexico Smart Electricity Meter Market
- 6.2.7.1. Market Size and Forecast, By Phase Type
- 6.2.7.2. Market Size and Forecast, By End-use Industry
- 6.3. Europe
- 6.3.1. Key Market Trends and Opportunities
- 6.3.2. Market Size and Forecast, By Phase Type
- 6.3.3. Market Size and Forecast, By End-use Industry
- 6.3.4. Market Size and Forecast, By Country
- 6.3.5. France Smart Electricity Meter Market
- 6.3.5.1. Market Size and Forecast, By Phase Type
- 6.3.5.2. Market Size and Forecast, By End-use Industry
- 6.3.6. Germany Smart Electricity Meter Market
- 6.3.6.1. Market Size and Forecast, By Phase Type
- 6.3.6.2. Market Size and Forecast, By End-use Industry
- 6.3.7. Italy Smart Electricity Meter Market
- 6.3.7.1. Market Size and Forecast, By Phase Type
- 6.3.7.2. Market Size and Forecast, By End-use Industry
- 6.3.8. Spain Smart Electricity Meter Market
- 6.3.8.1. Market Size and Forecast, By Phase Type
- 6.3.8.2. Market Size and Forecast, By End-use Industry
- 6.3.9. UK Smart Electricity Meter Market
- 6.3.9.1. Market Size and Forecast, By Phase Type
- 6.3.9.2. Market Size and Forecast, By End-use Industry
- 6.3.10. Rest Of Europe Smart Electricity Meter Market
- 6.3.10.1. Market Size and Forecast, By Phase Type
- 6.3.10.2. Market Size and Forecast, By End-use Industry
- 6.4. Asia-Pacific
- 6.4.1. Key Market Trends and Opportunities
- 6.4.2. Market Size and Forecast, By Phase Type
- 6.4.3. Market Size and Forecast, By End-use Industry
- 6.4.4. Market Size and Forecast, By Country
- 6.4.5. China Smart Electricity Meter Market
- 6.4.5.1. Market Size and Forecast, By Phase Type
- 6.4.5.2. Market Size and Forecast, By End-use Industry
- 6.4.6. Japan Smart Electricity Meter Market
- 6.4.6.1. Market Size and Forecast, By Phase Type
- 6.4.6.2. Market Size and Forecast, By End-use Industry
- 6.4.7. India Smart Electricity Meter Market
- 6.4.7.1. Market Size and Forecast, By Phase Type
- 6.4.7.2. Market Size and Forecast, By End-use Industry
- 6.4.8. South Korea Smart Electricity Meter Market
- 6.4.8.1. Market Size and Forecast, By Phase Type
- 6.4.8.2. Market Size and Forecast, By End-use Industry
- 6.4.9. Australia Smart Electricity Meter Market
- 6.4.9.1. Market Size and Forecast, By Phase Type
- 6.4.9.2. Market Size and Forecast, By End-use Industry
- 6.4.10. Rest of Asia-Pacific Smart Electricity Meter Market
- 6.4.10.1. Market Size and Forecast, By Phase Type
- 6.4.10.2. Market Size and Forecast, By End-use Industry
- 6.5. LAMEA
- 6.5.1. Key Market Trends and Opportunities
- 6.5.2. Market Size and Forecast, By Phase Type
- 6.5.3. Market Size and Forecast, By End-use Industry
- 6.5.4. Market Size and Forecast, By Country
- 6.5.5. Brazil Smart Electricity Meter Market
- 6.5.5.1. Market Size and Forecast, By Phase Type
- 6.5.5.2. Market Size and Forecast, By End-use Industry
- 6.5.6. South Africa Smart Electricity Meter Market
- 6.5.6.1. Market Size and Forecast, By Phase Type
- 6.5.6.2. Market Size and Forecast, By End-use Industry
- 6.5.7. Saudi Arabia Smart Electricity Meter Market
- 6.5.7.1. Market Size and Forecast, By Phase Type
- 6.5.7.2. Market Size and Forecast, By End-use Industry
- 6.5.8. Rest of LAMEA Smart Electricity Meter Market
- 6.5.8.1. Market Size and Forecast, By Phase Type
- 6.5.8.2. Market Size and Forecast, By End-use Industry
CHAPTER 7: COMPETITIVE LANDSCAPE
- 7.1. Introduction
- 7.2. Top Winning Strategies
- 7.3. Product Mapping Of Top 10 Player
- 7.4. Competitive Dashboard
- 7.5. Competitive Heatmap
- 7.6. Top Player Positioning, 2023
CHAPTER 8: COMPANY PROFILES
- 8.1. Itron Inc
- 8.1.1. Company Overview
- 8.1.2. Key Executives
- 8.1.3. Company Snapshot
- 8.1.4. Operating Business Segments
- 8.1.5. Product Portfolio
- 8.1.6. Business Performance
- 8.1.7. Key Strategic Moves and Developments
- 8.2. Xylem Inc.
- 8.2.1. Company Overview
- 8.2.2. Key Executives
- 8.2.3. Company Snapshot
- 8.2.4. Operating Business Segments
- 8.2.5. Product Portfolio
- 8.2.6. Business Performance
- 8.2.7. Key Strategic Moves and Developments
- 8.3. Schneider Electric
- 8.3.1. Company Overview
- 8.3.2. Key Executives
- 8.3.3. Company Snapshot
- 8.3.4. Operating Business Segments
- 8.3.5. Product Portfolio
- 8.3.6. Business Performance
- 8.3.7. Key Strategic Moves and Developments
- 8.4. Siemens
- 8.4.1. Company Overview
- 8.4.2. Key Executives
- 8.4.3. Company Snapshot
- 8.4.4. Operating Business Segments
- 8.4.5. Product Portfolio
- 8.4.6. Business Performance
- 8.4.7. Key Strategic Moves and Developments
- 8.5. Honeywell International Inc
- 8.5.1. Company Overview
- 8.5.2. Key Executives
- 8.5.3. Company Snapshot
- 8.5.4. Operating Business Segments
- 8.5.5. Product Portfolio
- 8.5.6. Business Performance
- 8.5.7. Key Strategic Moves and Developments
- 8.6. Hubbell
- 8.6.1. Company Overview
- 8.6.2. Key Executives
- 8.6.3. Company Snapshot
- 8.6.4. Operating Business Segments
- 8.6.5. Product Portfolio
- 8.6.6. Business Performance
- 8.6.7. Key Strategic Moves and Developments
- 8.7. Tantalus Systems
- 8.7.1. Company Overview
- 8.7.2. Key Executives
- 8.7.3. Company Snapshot
- 8.7.4. Operating Business Segments
- 8.7.5. Product Portfolio
- 8.7.6. Business Performance
- 8.7.7. Key Strategic Moves and Developments
- 8.8. Jiangsu Linyang Energy Co
- 8.8.1. Company Overview
- 8.8.2. Key Executives
- 8.8.3. Company Snapshot
- 8.8.4. Operating Business Segments
- 8.8.5. Product Portfolio
- 8.8.6. Business Performance
- 8.8.7. Key Strategic Moves and Developments
- 8.9. Apator S.A
- 8.9.1. Company Overview
- 8.9.2. Key Executives
- 8.9.3. Company Snapshot
- 8.9.4. Operating Business Segments
- 8.9.5. Product Portfolio
- 8.9.6. Business Performance
- 8.9.7. Key Strategic Moves and Developments
 日本智慧电錶市场报告(按类型(高级计量基础设施 (AMI)、自动抄表 (AMR))、相数(单相、三相)、最终用户(工业、商业、住宅)和地区)2025 年至 2033 年
 全球智慧电錶市场规模(按阶段、通讯技术类型、最终用户、区域范围和预测)2025 年至 2033 年智慧电錶市场规模、份额、趋势及预测(按类型、阶段、最终用户和地区)
 商业智慧电錶市场-全球产业规模、份额、趋势、机会与预测(按类型、按阶段、按地区、按竞争细分,2020-2030 年)
 2025年全球三相智慧电錶市场报告
 智慧电表的全球市场 (~2032年):技术·终端用户·阶段·各地区2025 年全球智慧电錶市场报告
 智慧电錶:市场占有率分析、产业趋势与统计、成长预测(2025-2030 年)
 智慧电錶市场规模、份额、成长分析、按类型、按技术、按组件、按最终用户、按通讯、按地区 - 行业预测,2025-2032 年
 AMR 智慧电錶市场机会、成长驱动因素、产业趋势分析与预测 2024 - 2032 年