


 |
市场调查报告书
商品编码
1514356
连接器产业年鑑(2024)2024 Connector Industry Yearbook |
||||||
本报告是连接器产业的年鑑,每年根据上市连接器企业提供的年报编写。利润表和资产负债表合併了过去10年、5年和最近一年的利润表和资产负债表,为行业和上市公司的整体业绩提供了基准。
此外,连接器产业的销售趋势(按地区和最终用途市场,2013-2023年)以及最新的销售和未来趋势预测(按地区和最终用途市场,2024年和2029年)等。
此报告的特点
上市合併历史:
- 主要财务指标(2013-2023 年)
- 资产负债表(金额基础,2013-2023 年)
- 损益表(金额基础,2013-2023 年)
- 资产负债表(%,2013-2023 年)
- 损益表(%,2013-2023 年)
各公司近15年业绩及财务指标产业平均值:
- 销售、一般及管理费用(%,2009-2023 年)
- 净利率(%,2009-2023 年)
- 资产报酬率(2009-2023 年)
- 长期负债/股本比率(2009-2023 年)
- 应收帐款週转率(2009-2023年)
- 库存週转率(2009-2023)
- 销售成本比率(%,2009-2023 年)
- 销售成本 + SG&A 费用率(%,2009-2023 年)
- 流动比率(2009-2023)
- 股本回报率(2009-2023 年)
- 负债比率(2009-2023)
- 平均收款期(2009-2023)
- 库存天数(2009-2023 年)
下表显示了受访上市公司的净利与销售额的比率(2013-2023年)。
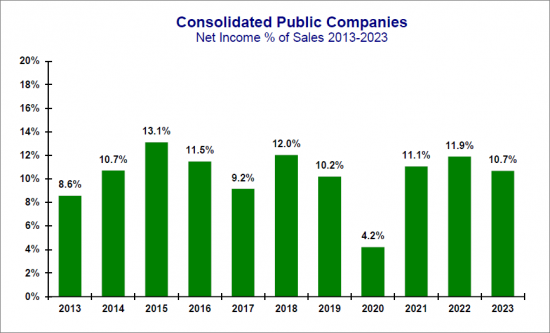
净利
2023年连接器产业平均净利为销售额的10.7%。 2018 年对美国来说是重要的一年,因为这一年《减税与就业法案》获得通过。该法将联邦企业税从 35% 降至 21%。
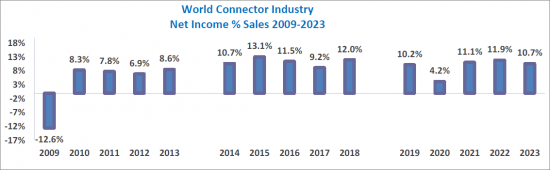
由于2009年全球经济衰退,净利润与销售额的比率达到2009年的最低水平,为-12.6%。这是合併公司首次出现净利负值。 2014年至2018年,净利润占销售额的比例从2014年的10.7%成长至2018年的12.0%。此外,2019年至2023年,净利成长率从2019年的10.2%成长至2023年的10.7%。
下图为连接器产业净利走势(2009-2023年)。
目录
第一章:全球电子连接器产业
- 市场趋势:过去 10 年(2013-2023 年)
- 表格:按地区分列的销售额
- 图:按地区划分的最新情况(2013年)和过去五年(2018-2023年)的趋势变化
- 表格:按地区分列的销售额
- 图:全球连结器产业:年增长率变化(1980-2024)
- 图:北美市场年增率(1980-2024)
- 图:欧洲市场年增率(1980-2024)
- 图:日本市场年增率(1980-2024)
- 图:中国市场年增率(1995-2024)
- 图:亚太市场年增率(1980-2024)
- 图:世界其他地区 (RoW) 市场的年增长率(1980-2024 年)
- 最新情况(2023)
- 表:按地区划分的成长率变化(%,2021 年、2022 年、2023 年)
- 表:按地区划分的市占率(%,2021 年、2022 年、2023 年)
- 设备部门销售额(2021-2023 年)
- 表:按设备产业划分的设备销售额变化率(%,2021-2023 年)
- 图:按设备产业划分的全球连接器销售波动性(%,2021-2023 年)
- 表:全球销售量:依设备类别划分(2023 年)
- 图:全球连接器市场(设备领域)排名前五的企业(2023年)
- 各地区的现况与预测(2024/2029)
- 表:依最终用途市场划分的预测(2024/2029 年)
- 图:未来五年(2024年和2029年)的最终用途市场预测
- 复合年增长率
- 企业併购 (M&A)
- 主要科技趋势
- 交货日期
- 价格趋势
第 2 章:重要事件
第 3 章:综合关键绩效指标
综合关键绩效指标
- 主要财务指标(2013-2023)
- 表:主要财务指标
- 资产负债表(金额基础,2013-2023 年)
- 资产负债表(%,2013-2023 年)
- 损益表(金额基础,2013-2023 年)
- 损益表(%,2013-2023 年)
各公司的业绩历史记录
- 接受调查的连接器製造商
销售成本
- 销售成本(%,2009-2023 年)
销售、一般及管理费用 (SG&A)
- 销售、一般及管理费用(%,2009-2023 年)
销售成本 + 销售、一般及管理费用
- 销售成本 + 销售、一般及管理费用(%,2009-2023 年)
净利趋势
- 净利(%,2009-2023 年)
流动比率
- 流动比率(2009-2023)
资产报酬率
- 资产报酬率(2009-2023 年)
股本报酬率
- 股本回报率(2009-2023 年)
长期负债/股本比率
- 长期负债/股本比率(2009-2023 年)
负债比率
- 负债比率(2009-2023)
应收帐款週转率
- 应收帐款週转率(2009-2023年)
平均收款週期
- 平均收款期(2009-2023)
库存週转率
- 库存週转率(2009-2023)
库存天数
- 库存天数(2009-2023 年)
第四章:受访公司的表现
受访公司的过往绩效
Amphenol Corporation
- 主要财务指标
- 表:主要财务指标
- 资产负债表(金额基础,2013-2023 年)
- 资产负债表(%,2013-2023 年)
- 损益表(金额基础,2013-2023 年)
- 损益表(%,2013-2023 年)
Cheng Uei Precision Co. Ltd. (Foxlink)
FIT Hon Teng Ltd
Hirose Electric Co., Ltd
Hosiden
HUBER+SUHNER
Japan Aviation Electronics Industry (JAE), Limited
Korea Electric Terminal Co. Ltd
SMK
TE Connectivity
Each year, Bishop & Associates prepares the Connector Industry Yearbook based on annual reports provided by publicly traded connector companies. Income statements and balance sheets are consolidated for the past 10 years, five years, and most current year, providing benchmarks on the industry and the overall performance of the public connector companies.
In addition, the report provides a review of the connector industry for the period 2013-2023 for sales by region, end-use equipment sector and our current forecast for 2024 and 2029 by region and end-use equipment sector.
This report features:
Consolidated history of the public companies including:
- Key Financial Measurements (2013-2023)
- Balance Sheet $ (2013-2023)
- Income Statement $ (2013-2023)
- Balance Sheet percent (2013-2023)
- Income Statement percent (2013-2023)
Fifteen-year history of performance by company, with industry averages for the following financial measurements:
- Selling, General, & Administrative percent (2009-2023)
- Net Income percent (2009-2023)
- Return on Assets (2009-2023)
- Long Term Debt/Equity (2009-2023)
- Accounts Receivables Turnover (2009-2023)
- Inventory Turns (2009-2023)
- Cost of Goods Sold percent (2009-2023)
- COGS + SG&A percent (2009-2023)
- Current Ratio (2009-2023)
- Return on Equity (2009-2023)
- Liabilities to Equity (2009-2023)
- Average Collection Period (2009-2023)
- Days Inventory (2009-2023)
The following table provides Net Income as a percent of sales from 2013-2023 for public companies included in the 2024 Connector Industry Yearbook.
Net Income
In 2023 the connector industry had an average net income of 10.7% of sales. 2018 was a significant year in the United States because it was the year the Tax Cuts and Jobs Act was passed. This act reduced the federal corporate income tax from 35% to 21%.
As a result of the worldwide economic downturn in 2009, the lowest net income as a percent of sales occurred in 2009 at -12.6%. This was the first time that net income had been a negative number for the consolidated public companies. Between 2014 and 2018, net income increased from 10.7% of sales in 2014 to 12.0% of sales in 2018. Between 2019 and 2023, net income increased from 10.2% in 2019 to 10.7% in 2023.
The following chart provides a history of net income for the Connector Industry from 2009-2023.
Table of Contents
CHAPTER 1 - THE WORLD ELECTRONIC CONNECTOR INDUSTRY
- The Last Ten Years (2013-2023)
- Table: Sales by Geographic Region
- Graph: Change by Geographic Region 2013 vs The Last Five Years (2018-2023)
- Table: Sales by Geographic Region
- Graph: World Connector Industry - Year-To-Year Percent Change in Growth 1980-2024F
- Graph: North American Market Year-to-Year Growth 1980-2024F
- Graph: European Market Year-to-Year Growth 1980-2024F
- Graph: Japanese Market Year-to-Year Growth 1980-2024F
- Graph: Chinese Market Year-to-Year Growth 1995-2024F
- Graph: Asia Pacific Market Year-to-Year Growth 1980-2024F
- Graph: ROW Market Year-to-Year Growth 1980-2024F
- Last Year - 2023
- Table: 2021, 2022 and 2023 Percent Change in Growth by Region
- Table: 2021, 2022 and 2023 Percent Share of Market by Region
- Equipment Sector Sales - 2021-2023
- Table: 2021-2023 Percent Change in Equipment Sales by Equipment Sector
- Graph: 2022-2023 Percent Change World Connector Sales by Equipment Sector
- Table: 2023 World Sales by Equipment Sector
- Graph: 2023 World Connector Market Top 5 Equipment Sectors
- Forecast 2024 and 2029 by Region
- Table: 2024 and 2029 Forecast by End-Use Market
- Graph: 2024 and 2029 End-Use Market Five-Year
- CAGR
- Mergers and Acquisitions
- Key Technology Trends
- Lead Times
- Price Trends
CHAPTER 2 - SIGNIFICANT EVENTS
CHAPTER 3 - CONSOLIDATED KEY PERFORMANCE MEASURES
Consolidated Key Performance Measures
- Key Financial Measurements (2013-2023)
- Charts: Key Financial Measurements
- Balance Sheet $ (2013-2023)
- Balance Sheet % (2013-2023)
- Income Statement $ (2013-2023)
- Income Statement % (2013-2023)
Performance History by Company
- Selected Connector Manufacturers
Cost-of-Goods Sold
- Cost of Goods Sold % (2009-2023)
Selling, General & Administrative (SG&A)
- Selling, General, & Administrative % (2009-2023)
COGS+SG&A
- COGS + SG&A % (2009-2023)
Net Income History
- Net Income % (2009-2023)
Current Ratio
- Current Ratio (2009-2023)
Return on Assets
- Return on Assets (2009-2023)
Return on Equity
- Return on Equity (2009-2023)
Long Term Debt/Equity
- Long Term Debt/Equity (2009-2023)
Liabilities to Equity
- Liabilities to Equity (2009-2023)
Accounts Receivable Turnover
- Accounts Receivables Turnover (2009-2023)
Average Collection Period
- Average Collection Period (2009-2023)
Inventory Turns
- Inventory Turns (2009-2023)
Days Inventory
- Days Inventory (2009-2023)
CHAPTER 4 - PERFORMANCE HISTORY OF SELECTED COMPANIES
Performance History of Selected Companies
Amphenol Corporation
- Key Financial Measurements
- Charts: Key Financial Measurements
- Balance Sheet $ (2013-2023)
- Balance Sheet % (2013-2023)
- Income Statement $ (2013-2023)
- Income Statement % (2013-2023)
Cheng Uei Precision Co. Ltd. (Foxlink)
- Key Financial Measurements
- Charts: Key Financial Measurements
- Balance Sheet $ (2013-2023)
- Balance Sheet % (2013-2023)
- Income Statement $ (2013-2023)
- Income Statement % (2013-2023)
FIT Hon Teng Ltd
- Key Financial Measurements
- Charts: Key Financial Measurements
- Balance Sheet $ (2013-2023)
- Balance Sheet % (2013-2023)
- Income Statement $ (2013-2023)
- Income Statement % (2013-2023)
Hirose Electric Co., Ltd
- Key Financial Measurements
- Charts: Key Financial Measurements
- Balance Sheet $ (2013-2023)
- Balance Sheet % (2013-2023)
- Income Statement $ (2013-2023)
- Income Statement % (2013-2023)
Hosiden
- Key Financial Measurements
- Charts: Key Financial Measurements
- Balance Sheet $ (2013-2023)
- Balance Sheet % (2013-2023)
- Income Statement $ (2013-2023)
- Income Statement % (2013-2023)
HUBER+SUHNER
- Key Financial Measurements
- Charts: Key Financial Measurements
- Balance Sheet $ (2013-2023)
- Balance Sheet % (2013-2023)
- Income Statement $ (2013-2023)
- Income Statement % (2013-2023)
Japan Aviation Electronics Industry (JAE), Limited
- Key Financial Measurements
- Charts: Key Financial Measurements
- Balance Sheet $ (2013-2023)
- Balance Sheet % (2013-2023)
- Income Statement $ (2013-2023)
- Income Statement % (2013-2023)
Korea Electric Terminal Co. Ltd
- Key Financial Measurements
- Charts: Key Financial Measurements
- Balance Sheet $ (2013-2023)
- Balance Sheet % (2013-2023)
- Income Statement $ (2013-2023)
- Income Statement % (2013-2023)
SMK
- Key Financial Measurements
- Charts: Key Financial Measurements
- Balance Sheet $ (2013-2023)
- Balance Sheet % (2013-2023)
- Income Statement $ (2013-2023)
- Income Statement % (2013-2023)
TE Connectivity
- Key Financial Measurements
- Charts: Key Financial Measurements
- Balance Sheet $ (2013-2023)
- Balance Sheet % (2013-2023)
- Income Statement $ (2013-2023)
- Income Statement % (2013-2023)
 连接器:2025-2029年全球市场
 液体冷却通用快速断开 (UQD) 接头:全球市场规模及 2025 年成长情形
 2025年全球面板机架安装电源连接器市场报告
 连接器市场(按产品、材料、销售管道和最终用户划分)—2025-2030 年全球预测
 全球 PPLN 波导市场:市场占有率和排名、总收入和需求预测(2025-2031 年)
 全球连接器市场:手册
 电缆和连接器市场规模、份额及成长分析(按产品类型、安装类型、最终用户和地区)-2025-2032 年产业预测2025年连接器全球市场报告
 全球液压流体连接器市场研究报告 - 产业分析、规模、份额、成长、趋势和预测 2025 年至 2033 年2025 年高压接线连接器全球市场报告