


 |
市场调查报告书
商品编码
1119094
节能材料全球市场规模研究,按产品类型、应用和地区预测 2022-2028Global Energy Efficient Materials Market Size study, by Product Type by Application and Regional Forecasts 2022-2028 |
||||||
隔热窗户和隔热照明灯具是节能产品的例子。
包括美国和欧盟在内的各个国家/地区都提供退款和税收抵免等奖励措施,以鼓励建筑商和承包商使用这些材料。预计这些原因将在不久的将来刺激节能材料市场的增长。预计产品需求将受到严格的政府和环境法规监管材料质量和规格的阻碍。建筑材料法规 (CPR)、REACH 和废物指令、SVHV 会谈、美国 EPA 法规等都是欧盟立法的例子。预计 LEED 和 ICC 700 国家绿色建筑标准等绿色建筑认证计划将推动未来对绿色建筑项目的需求。美国获得 LEED 认证的项目数量从 2006 年的 296 个增加到 2018 年的 67,200 多个。金砖国家和东南亚新兴经济体消费者可支配收入的提高和生活水平的提高,有望为行业参与者打开新的大门,提供巨大的发展潜力。欧洲节能材料市场的渗透率最高,由于支持使用这些商品的有利监管政策,预计在预测期内将显着增长。英国、德国和瑞士等国家预计将成为该地区最大的消费市场,而罗马尼亚和比利时预计将在不久的将来显着扩张。由于与该地区新产品开发相关的研发支出增加,预计北美将经历显着的行业增长。然而,节能材料的高成本将阻碍整个 2022-2028 年预测期内的市场增长。
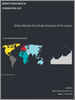
考虑进行能效材料全球市场研究的主要地区包括亚太地区、北美、欧洲、拉丁美洲和世界其他地区。欧洲节能材料市场的渗透率最高,由于支持使用这些商品的有利监管政策,预计在预测期内将显着增长。预计英国、德国和瑞士等国家将成为该地区最大的消费市场,而罗马尼亚和比利时预计将在不久的将来显着扩张。由于与新产品开发相关的研发支出增加,预计北美将经历显着的工业增长。
本报告中包括的主要市场参与者是:
PPG 工业
圣戈班
基石工业矿产公司
澳大利亚珍珠岩私人有限公司
巴斯夫
世界矿产
皇家集团
LG化学
英力士集团
朝日玻璃纤维有限公司
本研究的目的是确定近年来各个细分市场和国家/地区的市场规模,并预测未来 8 年的价值。该报告旨在捕捉所研究的每个地区和国家的行业的定性和定量方面。此外,它还提供了有关关键方面的详细信息,例如定义市场未来增长的驱动因素和挑战。此外,报告还应详细分析主要参与者的竞争格局和产品供应,以及微观市场中可供利益相关者投资的机会。市场的详细细分和子细分如下所述。
按产品类型。
聚异氰尿酸酯
挤塑聚苯乙烯
聚苯乙烯泡沫塑料
玻璃纤维
纤维素
矿棉
用途
住宅
商业
工业
按地区
北美
美国
加拿大
欧洲
英国
德国
法国
西班牙
意大利
其他欧洲
亚太地区
中国
印度
日本
澳大利亚
韩国
其他亚太地区
拉丁美洲
巴西
墨西哥
世界其他地方
此外,本研究考虑的年份是:
实际年份 - 2018 年、2019 年、2020 年
2021 年基准年
预测期 - 2022 年 至 2028 年
本报告的目标受众是全球能效材料市场。
主要咨询公司和顾问
大公司、中型公司、中小企业
风险投资
增值经销商 (VAR)
第三方知识提供者
投资银行家
投资者
内容
第 1 章执行摘要
- 市场快照
- 2020-2028 年全球市场细分的估计和预测
- 节能材料市场:按地区分,2020-2028 年
- 节能材料市场:按产品类型,2020-2028 年
- 2020-2028 年按应用分列的节能材料市场
- 主要趋势
- 调查方法
- 调查先决条件
第 2 章节能材料的全球市场定义和范围
- 调查目的
- 市场定义和范围
- 调查范围
- 工业发展
- 调查年份
- 货币兑换率
第 3 章全球节能材料市场动态
- 节能材料市场影响分析(2020-2028)
- 市场驱动力
- 对节能的需求不断上升
- 加强政府排放政策
- 市场挑战
- 节能材料成本高
- 市场机会
- 新型节能材料的开发
- 市场驱动力
第 4 章全球节能材料市场行业分析
- 波特的 5 力模型
- 供应商的议价能力
- 买家的议价能力
- 新进入者的威胁
- 替代品的威胁
- 竞争公司之间的敌对关係
- 波特 5 力模型的未来方法(2018-2028)
- PEST 分析
- 政治
- 经济
- 社交
- 技术
- 招商引资模式
- 分析师的结论和建议
- 热门投资机会
- 制胜法宝
第 5 章风险评估:COVID-19 的影响
- 评估 COVID-19 对行业的整体影响
- COVID-19 之前和 COVID-19 之后的市场情景
第 6 章全球节能材料市场:按产品类型分类
- 市场快照
- 全球节能材料市场:按产品类型进行的性能潜力分析
- 2018-2028 年全球节能材料市场、按产品类型估算和预测
- 节能材料市场,细分分析
- 聚异氰尿酸酯
- 挤塑聚苯乙烯
- 发泡聚苯乙烯
- 玻璃纤维
- 纤维素
- 矿棉
第 7 章全球节能材料市场:按应用分类
- 市场快照
- 全球节能材料市场:按应用、性能和潜力分析
- 2018-2028 年全球节能材料市场、估计和预测(按应用)
- 全球节能材料市场,细分分析
- 住房部门
- 商业
- 工业
第 8 章全球节能材料市场:区域分析
- 节能材料市场,区域市场快照
- 北美
- 美国
- 按产品类型划分的估计和预测,2018-2028 年
- 按应用划分的估计和预测,2018-2028
- 加拿大
- 美国
- 欧洲能效材料市场概况
- 英国
- 德国
- 法国
- 西班牙
- 意大利
- 其他欧洲地区
- 亚太节能材料市场概况
- 中国
- 印度
- 日本
- 澳大利亚
- 韩国
- 其他亚太地区
- 拉丁美洲节能材料市场概况
- 巴西
- 墨西哥
- 世界其他地区
第 9 章竞争资讯
- 顶级市场策略
- 公司简介
- PPG Industries
- 主要资讯
- 概览
- 财务(如果有数据)
- 产品概览
- 近期发展状况
- Saint-Gobain
- Cornerstone Industrial Mineral Corporation
- Australian Perlite Pty Ltd
- BASF
- World Minerals Inc.
- Loyal Group
- LG Chem
- INEOS Group
- Asahi Fiber Glass Co Ltd.
第 10 章研究过程
- 研究过程
- 数据挖掘
- 分析
- 市场估算
- 验证
- 出版
- 调查属性
- 调查先决条件
- PPG Industries
Global Energy Efficient Materials Market is valued approximately USD XXX billion in 2021 and is anticipated to grow with a healthy growth rate of more than XX% over the forecast period 2022-2028. Effective window insulation and lighting systems that provide thermal isolation are examples of energy-efficient products. Various countries, notably the United States and the European Union, offer refunds, tax credits, and other incentives to encourage the use of these materials by builders and construction businesses. These aforementioned reasons are expected to fuel the growth of the energy-efficient materials market in the near future. Product demand is expected to be hampered by stringent government and environmental restrictions governing material quality and specifications. Construction Products Regulation (CPR), REACH and waste directive, SVHV consultation, and EPA rules in the United States are all examples of EU legislation. Green building certification programmes like LEED and the ICC 700 National Green Building Standard are projected to boost demand for green building projects in the future. The number of LEED-certified projects in the United States climbed from 296 in 2006 to over 67,200 in 2018. Rising consumer disposable income and rising living standards in the BRICS and South East Asian emerging nations are expected to open new doors for industry participants and give enormous development potential. The energy-efficient materials market in Europe has the greatest penetration and is predicted to grow significantly during the forecast period due to favourable regulatory policies supporting the use of these goods. Countries such as the United Kingdom, Germany, and Switzerland are expected to be the region's top consumer markets, with Romania and Belgium indicating significant expansion in the near future. North America is expected to have significant industry growth as a result of increased R&D spending linked with new product development in the area. However, the high cost of Energy Efficient Materials stifles market growth throughout the forecast period of 2022-2028.
The key regions considered for the Global Energy Efficient Materials Market study includes Asia Pacific, North America, Europe, Latin America, and Rest of the World. The energy-efficient materials market in Europe has the greatest penetration and is predicted to grow significantly during the forecast period due to favourable regulatory policies supporting the use of these goods. Countries such as the United Kingdom, Germany, and Switzerland are expected to be the region's top consumer markets, with Romania and Belgium indicating significant expansion in the near future. North America is expected to have significant industry growth as a result of increased R&D spending linked with new product development in the areas.
Major market player included in this report are:
PPG Industries
Saint-Gobain
Cornerstone Industrial Mineral Corporation
Australian Perlite Pty Ltd
BASF
World Minerals Inc.
Loyal Group
LG Chem
INEOS Group
Asahi Fiber Glass Co Ltd.
The objective of the study is to define market sizes of different segments & countries in recent years and to forecast the values to the coming eight years. The report is designed to incorporate both qualitative and quantitative aspects of the industry within each of the regions and countries involved in the study. Furthermore, the report also caters the detailed information about the crucial aspects such as driving factors & challenges which will define the future growth of the market. Additionally, the report shall also incorporate available opportunities in micro markets for stakeholders to invest along with the detailed analysis of competitive landscape and product offerings of key players. The detailed segments and sub-segment of the market are explained below:
By Product Type:
Polyisocyanurate
Extruded polystyrene
Expanded polystyrene
Fiberglass
Cellulose
Mineral wool
By Application
Residential
Commercial
Industrial
By Region:
North America
U.S.
Canada
Europe
UK
Germany
France
Spain
Italy
ROE
Asia Pacific
China
India
Japan
Australia
South Korea
RoAPAC
Latin America
Brazil
Mexico
Rest of the World
Furthermore, years considered for the study are as follows:
Historical year - 2018, 2019, 2020
Base year - 2021
Forecast period - 2022 to 2028
Target Audience of the Global Energy Efficient Materials Market in Market Study:
Key Consulting Companies & Advisors
Large, medium-sized, and small enterprises
Venture capitalists
Value-Added Resellers (VARs)
Third-party knowledge providers
Investment bankers
Investors
Table of Contents
Chapter 1. Executive Summary
- 1.1. Market Snapshot
- 1.2. Global & Segmental Market Estimates & Forecasts, 2020-2028 (USD Billion)
- 1.2.1. Energy Efficient Materials Market, by Region, 2020-2028 (USD Billion)
- 1.2.2. Energy Efficient Materials Market, by Product Type, 2020-2028 (USD Billion)
- 1.2.3. Energy Efficient Materials Market, by Application, 2020-2028 (USD Billion)
- 1.3. Key Trends
- 1.4. Estimation Methodology
- 1.5. Research Assumption
Chapter 2. Global Energy Efficient Materials Market Definition and Scope
- 2.1. Objective of the Study
- 2.2. Market Definition & Scope
- 2.2.1. Scope of the Study
- 2.2.2. Industry Evolution
- 2.3. Years Considered for the Study
- 2.4. Currency Conversion Rates
Chapter 3. Global Energy Efficient Materials Market Dynamics
- 3.1. Energy Efficient Materials Market Impact Analysis (2020-2028)
- 3.1.1. Market Drivers
- 3.1.1.1. Increasing demand for Energy conservation
- 3.1.1.2. Escalating Government Policies for Emissions
- 3.1.2. Market Challenges
- 3.1.2.1. High Cost of Energy Efficient Materials
- 3.1.3. Market Opportunities
- 3.1.3.1. Development of New Energy Efficient Materials
- 3.1.1. Market Drivers
Chapter 4. Global Energy Efficient Materials Market Industry Analysis
- 4.1. Porter's 5 Force Model
- 4.1.1. Bargaining Power of Suppliers
- 4.1.2. Bargaining Power of Buyers
- 4.1.3. Threat of New Entrants
- 4.1.4. Threat of Substitutes
- 4.1.5. Competitive Rivalry
- 4.1.6. Futuristic Approach to Porter's 5 Force Model (2018-2028)
- 4.2. PEST Analysis
- 4.2.1. Political
- 4.2.2. Economical
- 4.2.3. Social
- 4.2.4. Technological
- 4.3. Investment Adoption Model
- 4.4. Analyst Recommendation & Conclusion
- 4.5. Top investment opportunity
- 4.6. Top winning strategies
Chapter 5. Risk Assessment: COVID-19 Impact
- 5.1.1. Assessment of the overall impact of COVID-19 on the industry
- 5.1.2. Pre COVID-19 and post COVID-19 Market scenario
Chapter 6. Global Energy Efficient Materials Market, by Product Type
- 6.1. Market Snapshot
- 6.2. Global Energy Efficient Materials Market by Product Type, Performance - Potential Analysis
- 6.3. Global Energy Efficient Materials Market Estimates & Forecasts by Product Type 2018-2028 (USD Billion)
- 6.4. Energy Efficient Materials Market, Sub Segment Analysis
- 6.4.1. Polyisocyanurate
- 6.4.2. Extruded polystyrene
- 6.4.3. Expanded polystyrene
- 6.4.4. Fiberglass
- 6.4.5. Cellulose
- 6.4.6. Mineral wool
Chapter 7. Global Energy Efficient Materials Market, by Application
- 7.1. Market Snapshot
- 7.2. Global Energy Efficient Materials Market by Application, Performance - Potential Analysis
- 7.3. Global Energy Efficient Materials Market Estimates & Forecasts by Application 2018-2028 (USD Billion)
- 7.4. Energy Efficient Materials Market, Sub Segment Analysis
- 7.4.1. Residential
- 7.4.2. Commercial
- 7.4.3. Industrial
Chapter 8. Global Energy Efficient Materials Market, Regional Analysis
- 8.1. Energy Efficient Materials Market, Regional Market Snapshot
- 8.2. North America Energy Efficient Materials Market
- 8.2.1. U.S. Energy Efficient Materials Market
- 8.2.1.1. Product Type breakdown estimates & forecasts, 2018-2028
- 8.2.1.2. Application breakdown estimates & forecasts, 2018-2028
- 8.2.2. Canada Energy Efficient Materials Market
- 8.2.1. U.S. Energy Efficient Materials Market
- 8.3. Europe Energy Efficient Materials Market Snapshot
- 8.3.1. U.K. Energy Efficient Materials Market
- 8.3.2. Germany Energy Efficient Materials Market
- 8.3.3. France Energy Efficient Materials Market
- 8.3.4. Spain Energy Efficient Materials Market
- 8.3.5. Italy Energy Efficient Materials Market
- 8.3.6. Rest of Europe Energy Efficient Materials Market
- 8.4. Asia-Pacific Energy Efficient Materials Market Snapshot
- 8.4.1. China Energy Efficient Materials Market
- 8.4.2. India Energy Efficient Materials Market
- 8.4.3. Japan Energy Efficient Materials Market
- 8.4.4. Australia Energy Efficient Materials Market
- 8.4.5. South Korea Energy Efficient Materials Market
- 8.4.6. Rest of Asia Pacific Energy Efficient Materials Market
- 8.5. Latin America Energy Efficient Materials Market Snapshot
- 8.5.1. Brazil Energy Efficient Materials Market
- 8.5.2. Mexico Energy Efficient Materials Market
- 8.6. Rest of The World Energy Efficient Materials Market
Chapter 9. Competitive Intelligence
- 9.1. Top Market Strategies
- 9.2. Company Profiles
- 9.2.1. PPG Industries
- 9.2.1.1. Key Information
- 9.2.1.2. Overview
- 9.2.1.3. Financial (Subject to Data Availability)
- 9.2.1.4. Product Summary
- 9.2.1.5. Recent Developments
- 9.2.2. Saint-Gobain
- 9.2.3. Cornerstone Industrial Mineral Corporation
- 9.2.4. Australian Perlite Pty Ltd
- 9.2.5. BASF
- 9.2.6. World Minerals Inc.
- 9.2.7. Loyal Group
- 9.2.8. LG Chem
- 9.2.9. INEOS Group
- 9.2.10. Asahi Fiber Glass Co Ltd.
- 9.2.1. PPG Industries
Chapter 10. Research Process
- 10.1. Research Process
- 10.1.1. Data Mining
- 10.1.2. Analysis
- 10.1.3. Market Estimation
- 10.1.4. Validation
- 10.1.5. Publishing
- 10.2. Research Attributes
- 10.3. Research Assumption
LIST OF TABLES
- TABLE 1. Global Energy Efficient Materials Market, report scope
- TABLE 2. Global Energy Efficient Materials Market estimates & forecasts by Region 2018-2028 (USD Billion)
- TABLE 3. Global Energy Efficient Materials Market estimates & forecasts by Product Type 2018-2028 (USD Billion)
- TABLE 4. Global Energy Efficient Materials Market estimates & forecasts by Application 2018-2028 (USD Billion)
- TABLE 5. Global Energy Efficient Materials Market by segment, estimates & forecasts, 2018-2028 (USD Billion)
- TABLE 6. Global Energy Efficient Materials Market by region, estimates & forecasts, 2018-2028 (USD Billion)
- TABLE 7. Global Energy Efficient Materials Market by segment, estimates & forecasts, 2018-2028 (USD Billion)
- TABLE 8. Global Energy Efficient Materials Market by region, estimates & forecasts, 2018-2028 (USD Billion)
- TABLE 9. Global Energy Efficient Materials Market by segment, estimates & forecasts, 2018-2028 (USD Billion)
- TABLE 10. Global Energy Efficient Materials Market by region, estimates & forecasts, 2018-2028 (USD Billion)
- TABLE 11. Global Energy Efficient Materials Market by segment, estimates & forecasts, 2018-2028 (USD Billion)
- TABLE 12. Global Energy Efficient Materials Market by region, estimates & forecasts, 2018-2028 (USD Billion)
- TABLE 13. Global Energy Efficient Materials Market by segment, estimates & forecasts, 2018-2028 (USD Billion)
- TABLE 14. Global Energy Efficient Materials Market by region, estimates & forecasts, 2018-2028 (USD Billion)
- TABLE 15. U.S. Energy Efficient Materials Market estimates & forecasts, 2018-2028 (USD Billion)
- TABLE 16. U.S. Energy Efficient Materials Market estimates & forecasts by segment 2018-2028 (USD Billion)
- TABLE 17. U.S. Energy Efficient Materials Market estimates & forecasts by segment 2018-2028 (USD Billion)
- TABLE 18. Canada Energy Efficient Materials Market estimates & forecasts, 2018-2028 (USD Billion)
- TABLE 19. Canada Energy Efficient Materials Market estimates & forecasts by segment 2018-2028 (USD Billion)
- TABLE 20. Canada Energy Efficient Materials Market estimates & forecasts by segment 2018-2028 (USD Billion)
- TABLE 21. UK Energy Efficient Materials Market estimates & forecasts, 2018-2028 (USD Billion)
- TABLE 22. UK Energy Efficient Materials Market estimates & forecasts by segment 2018-2028 (USD Billion)
- TABLE 23. UK Energy Efficient Materials Market estimates & forecasts by segment 2018-2028 (USD Billion)
- TABLE 24. Germany Energy Efficient Materials Market estimates & forecasts, 2018-2028 (USD Billion)
- TABLE 25. Germany Energy Efficient Materials Market estimates & forecasts by segment 2018-2028 (USD Billion)
- TABLE 26. Germany Energy Efficient Materials Market estimates & forecasts by segment 2018-2028 (USD Billion)
- TABLE 27. RoE Energy Efficient Materials Market estimates & forecasts, 2018-2028 (USD Billion)
- TABLE 28. RoE Energy Efficient Materials Market estimates & forecasts by segment 2018-2028 (USD Billion)
- TABLE 29. RoE Energy Efficient Materials Market estimates & forecasts by segment 2018-2028 (USD Billion)
- TABLE 30. China Energy Efficient Materials Market estimates & forecasts, 2018-2028 (USD Billion)
- TABLE 31. China Energy Efficient Materials Market estimates & forecasts by segment 2018-2028 (USD Billion)
- TABLE 32. China Energy Efficient Materials Market estimates & forecasts by segment 2018-2028 (USD Billion)
- TABLE 33. India Energy Efficient Materials Market estimates & forecasts, 2018-2028 (USD Billion)
- TABLE 34. India Energy Efficient Materials Market estimates & forecasts by segment 2018-2028 (USD Billion)
- TABLE 35. India Energy Efficient Materials Market estimates & forecasts by segment 2018-2028 (USD Billion)
- TABLE 36. Japan Energy Efficient Materials Market estimates & forecasts, 2018-2028 (USD Billion)
- TABLE 37. Japan Energy Efficient Materials Market estimates & forecasts by segment 2018-2028 (USD Billion)
- TABLE 38. Japan Energy Efficient Materials Market estimates & forecasts by segment 2018-2028 (USD Billion)
- TABLE 39. RoAPAC Energy Efficient Materials Market estimates & forecasts, 2018-2028 (USD Billion)
- TABLE 40. RoAPAC Energy Efficient Materials Market estimates & forecasts by segment 2018-2028 (USD Billion)
- TABLE 41. RoAPAC Energy Efficient Materials Market estimates & forecasts by segment 2018-2028 (USD Billion)
- TABLE 42. Brazil Energy Efficient Materials Market estimates & forecasts, 2018-2028 (USD Billion)
- TABLE 43. Brazil Energy Efficient Materials Market estimates & forecasts by segment 2018-2028 (USD Billion)
- TABLE 44. Brazil Energy Efficient Materials Market estimates & forecasts by segment 2018-2028 (USD Billion)
- TABLE 45. Mexico Energy Efficient Materials Market estimates & forecasts, 2018-2028 (USD Billion)
- TABLE 46. Mexico Energy Efficient Materials Market estimates & forecasts by segment 2018-2028 (USD Billion)
- TABLE 47. Mexico Energy Efficient Materials Market estimates & forecasts by segment 2018-2028 (USD Billion)
- TABLE 48. RoLA Energy Efficient Materials Market estimates & forecasts, 2018-2028 (USD Billion)
- TABLE 49. RoLA Energy Efficient Materials Market estimates & forecasts by segment 2018-2028 (USD Billion)
- TABLE 50. RoLA Energy Efficient Materials Market estimates & forecasts by segment 2018-2028 (USD Billion)
- TABLE 51. Row Energy Efficient Materials Market estimates & forecasts, 2018-2028 (USD Billion)
- TABLE 52. Row Energy Efficient Materials Market estimates & forecasts by segment 2018-2028 (USD Billion)
- TABLE 53. Row Energy Efficient Materials Market estimates & forecasts by segment 2018-2028 (USD Billion)
- TABLE 54. List of secondary sources, used in the study of global Energy Efficient Materials Market
- TABLE 55. List of primary sources, used in the study of global Energy Efficient Materials Market
- TABLE 56. Years considered for the study
- TABLE 57. Exchange rates considered
LIST OF FIGURES
List of figures
- FIG 1. Global Energy Efficient Materials Market, research methodology
- FIG 2. Global Energy Efficient Materials Market, Market estimation techniques
- FIG 3. Global Market size estimates & forecast methods
- FIG 4. Global Energy Efficient Materials Market, key trends 2021
- FIG 5. Global Energy Efficient Materials Market, growth prospects 2022-2028
- FIG 6. Global Energy Efficient Materials Market, porters 5 force model
- FIG 7. Global Energy Efficient Materials Market, pest analysis
- FIG 8. Global Energy Efficient Materials Market, value chain analysis
- FIG 9. Global Energy Efficient Materials Market by segment, 2018 & 2028 (USD Billion)
- FIG 10. Global Energy Efficient Materials Market by segment, 2018 & 2028 (USD Billion)
- FIG 11. Global Energy Efficient Materials Market by segment, 2018 & 2028 (USD Billion)
- FIG 12. Global Energy Efficient Materials Market by segment, 2018 & 2028 (USD Billion)
- FIG 13. Global Energy Efficient Materials Market by segment, 2018 & 2028 (USD Billion)
- FIG 14. Global Energy Efficient Materials Market, regional snapshot 2018 & 2028
- FIG 15. North America Energy Efficient Materials Market 2018 & 2028 (USD Billion)
- FIG 16. Europe Energy Efficient Materials Market 2018 & 2028 (USD Billion)
- FIG 17. Asia pacific Energy Efficient Materials Market 2018 & 2028 (USD Billion)
- FIG 18. Latin America Energy Efficient Materials Market 2018 & 2028 (USD Billion)
- FIG 19. Global Energy Efficient Materials Market, company Market share analysis (2021)
 2024-2032 年按类型、材料、最终用途行业和地区分類的材料测试市场报告
 材料测试市场:材料类型、测试方法和最终用户划分 - 全球预测 2023-2030
 材料特性评估市场(2022年~2027年):市场概要
 材料实验的全球市场