


 |
市场调查报告书
商品编码
1215353
全球超连接市场规模研究与预测:按组件、按产品、按组织规模、按最终用途行业、按地区,2022-2029 年Global Hyperconnectivity Market Size study & Forecast, by Component, by Product, by Organization Size, by End Use Industry and Regional Analysis, 2022-2029 |
||||||
2021 年全球超连接市场价值约为 3109 亿美元,预计在 2022-2029 年预测期内将以超过 22.08% 的健康增长率增长。
超级连接可以定义为使用各种系统和设备与社交网络和其他数字资源保持连接。 超连接是通过互联网相互连接的信息系统、数据和设备之间的交互。 物联网技术的普及、智能手机的普及以及主要市场参与者的战略举措是推动市场增长的主要因素。
越来越多地采用基于物联网 (IoT) 的设备,这有助于全球超连接市场的增长。 例如,根据 Statista 的数据,到 2020 年,全球物联网 (IoT) 市场总额估计为 3890 亿美元,预计到 2030 年将增长到超过 1 万亿美元。 此外,根据 Statista 预测,2020 年全球预计将有 97 亿台物联网 (IoT) 设备,到 2030 年这一数字有望增长到 290 亿台。 此外,新兴国家高速互联网连接的兴起以及组织中越来越多地采用超连接解决方案也有望在预测期内为市场创造良好的增长前景。 然而,数据洩露事件的数量和数据隐私问题将阻碍整个 2022-2029 年预测期内的市场增长。
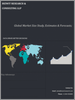
研究的全球超连接市场区域包括亚太地区、北美、欧洲、拉丁美洲和世界其他主要地区。 由于该地区强大的市场参与者和必要的技术基础设施的可用性,北美在收入方面占据了市场主导地位。 另一方面,由于物联网连接设备普及率上升、工业化程度提高以及对 5G 技术的投资增加等因素,预计亚太地区在预测期内将以最高复合年增长率增长。
这项研究的目的是定义近年来各个细分市场和国家/地区的市场规模,并预测它们在未来几年的价值。 本报告旨在捕捉被调查国家行业的定性和定量方面的情况。
它还提供了关键方面的详细信息,例如决定市场未来增长的驱动因素和挑战。 此外,它还包含供利益相关者投资的微观市场潜在机会,以及对主要参与者的竞争格局和产品供应的深入分析。
按组件
解决方案
服务
按产品
企业可穿戴设备
中间件软件
云平台
商业解决方案
按组织规模
中小企业
大企业
最终用户
英国食品安全协会
医疗保健与生命科学
通讯/IT行业
政府/公共机构
製造业
消费品与零售
媒体和娱乐
内容
第 1 章执行摘要
- 市场概况
- 2019-2029 年各细分市场的全球市场估计和预测
- 超连接市场,按地区划分,2019-2029 年
- 超连接市场:按组件分类,2019-2029 年
- 超连接市场:按产品分类,2019-2029 年
- 超连接市场:按组织规模划分,2019 年至 2029 年
- 超连接市场:按最终用途行业分类,2019-2029 年
- 主要趋势
- 调查方法
- 调查先决条件
第 2 章超连接的全球市场定义和范围
- 调查的目的
- 市场定义和范围
- 调查范围
- 工业发展
- 调查年份
- 货币兑换率
第 3 章超连接的全球市场动态
- 超连接市场的影响分析(2019-2029)
- 市场驱动力
- 物联网技术的采用率提高
- 智能手机普及率上升
- 主要市场参与者的战略举措
- 市场挑战
- 数据隐私和安□□全问题
- 市场机会
- 新兴国家/地区高速互联网连接的兴起
- 在组织中更多地采用超级连接解决方案
- 市场驱动力
第 4 章超连接全球市场行业分析
- 波特 5 力模型
- 供应商的议价能力
- 买家的议价能力
- 新进入者的威胁
- 替代品的威胁
- 竞争公司之间的敌对关係
- 波特 5 力模型的未来方法 (2019-2029)
- 害虫分析
- 政治
- 经济的
- 社交
- 技术
- 顶级投资机会
- 关键成功策略
- 行业专家的展望
- 分析师的结论和建议
第 5 章风险评估:COVID-19 的影响
- 评估 COVID-19 对行业的总体影响
- COVID-19 之前和 COVID-19 之后的市场情景
第 6 章全球超连接市场,按组件分类
- 市场概况
- 全球超连接市场:按组件分类的性能潜力分析
- 2019-2029 年全球超连接市场、按组成部分的估计和预测
- 超连接市场、细分市场分析
- 解决方案
- 服务
第 7 章:全球超连接市场:按产品分类
- 市场概况
- 全球超连接市场:按产品、按性能、潜力分析
- 2019-2029 年全球超连接市场、按产品估算和预测
- 超连接市场、细分市场分析
- 适用于企业的可穿戴设备
- 中间件软件
- 云平台
- 业务解决方案
第 8 章全球超连接市场:按组织规模
- 市场概况
- 全球超级连接市场:组织规模、绩效和潜力分析
- 2019-2029 年全球超连接市场、按组织规模估算和预测
- 超连接市场、细分市场分析
- 中小企业
- 大公司
第 9 章全球超级连接市场:按最终用途行业分类
- 市场概况
- 全球超级连接市场:按最终用途行业进行的性能和潜力分析
- 2019-2029 年全球超连接市场、最终用途行业的估计和预测
- 超连接市场、细分市场分析
- BFSI
- 医疗保健与生命科学
- 通信/IT 领域
- 政府/公共机构
- 製造业
- 消费品/零售
- 媒体与娱乐
第 10 章全球超连接市场:区域分析
- 超连接市场的区域市场概况
- 北美
- 美国
- 2019-2029 年各组成部分的估计和预测
- 2019-2029 年按产品估算和预测
- 按组织规模估算和预测,2019 年至 2029 年
- 2019-2029 年终端用户行业的估计和预测
- 加拿大
- 美国
- 欧洲超连接市场概况
- 英国
- 德国
- 法国
- 西班牙
- 意大利
- 其他欧洲地区
- 亚太超级连接市场概况
- 中国
- 印度
- 日本
- 澳大利亚
- 韩国
- 其他亚太地区
- 拉丁美洲超连接市场概况
- 巴西
- 墨西哥
- 其他拉丁美洲地区
- 世界其他地区
第 11 章衝突信息
- 顶级市场策略
- 公司简介
- Avaya Holdings Corp.
- 主要信息
- 概览
- 财务信息(取决于数据可用性)
- 产品概述
- 近期趋势
- Extreme Networks
- Fujitsu Limited
- Iberdrola SA
- International Business Machines Corporation
- Microsoft Corporation
- Orange IT Solutions
- Oracle Corporation
- PathPartner Technology
- Broadcom Inc.
- Avaya Holdings Corp.
第 12 章研究过程
- 研究过程
- 数据挖掘
- 分析
- 市场评估
- 验证
- 出版
- 调查属性
- 调查先决条件
Global Hyperconnectivity Market is valued at approximately USD 310.9 billion in 2021 and is anticipated to grow with a healthy growth rate of more than 22.08% over the forecast period 2022-2029. Hyperconnectivity can be defined as the use of various systems and devices to remain connected to social networks and other digital sources of information. Hyperconnectivity is an interaction between information systems, data, and devices, which are connected to each other through the internet. The increasing adoption of IoT technologies and growing penetration of smartphones as well as strategic initiatives from leading market players are key factors accelerating the market growth.
The increasing adoption of Internet of Things (IoT) based devices is contributing to the growth of the Global Hyperconnectivity Market. For instance, according to Statista - in 2020, the total Internet of Things (IoT) market worldwide was estimated at USD 389 billion, and the market is projected to grow to more than USD 1000 billion by 2030. Moreover, as per Statista estimates - in 2020, globally the number of Internet of Things (IoT) devices was estimated at 9.7 billion, and as per projections, this number would grow to 29 billion by 2030. Also, rising emergence of high-speed internet connectivity in developing nations coupled with increasing adoption of hyperconnectivity solutions in organizations would create a lucrative growth prospectus for the market over the forecast period. However, increasing incidences of data breaches & concerns relating to data privacy impede the market growth throughout the forecast period of 2022-2029.
The key regions considered for the Global Hyperconnectivity Market study include Asia Pacific, North America, Europe, Latin America, and Rest of the World. North America dominated the market in terms of revenue, owing to the presence of leading market players and availability of required technological infrastructure in the region. Whereas Asia Pacific is expected to grow with the highest CAGR during the forecast period, owing to factors such as rising penetration of IoT-connected devices, coupled with growing industrialization and increasing investment in 5G technologies in the region.
Major market players included in this report are:
Avaya Holdings Corp.
Extreme Networks
Fujitsu Limited
Iberdrola SA
International Business Machines Corporation
Microsoft Corporation
Orange IT Solutions
Oracle Corporation
PathPartner Technology
Broadcom Inc.
Recent Developments in the Market:
- In June 2021, KPIT Technologies entered into a definitive agreement to acquire PathPartner Technology. PathPartner is a leading provider of operating system software and low-level software for Automotive, Camera, Radar, and Multimedia devices.
Global Hyperconnectivity Market Report Scope:
Historical Data: 2019-2020-2021
Base Year for Estimation: 2021
Forecast period: 2022-2029
Report Coverage: Revenue forecast, Company Ranking, Competitive Landscape, Growth factors, and Trends
Segments Covered: Component, Product, Organization Size, End-Use Industry, Region
Regional Scope: North America; Europe; Asia Pacific; Latin America; Rest of the World
Customization Scope: Free report customization (equivalent up to 8 analyst's working hours) with purchase. Addition or alteration to country, regional & segment scope*
The objective of the study is to define market sizes of different segments & countries in recent years and to forecast the values to the coming years. The report is designed to incorporate both qualitative and quantitative aspects of the industry within countries involved in the study.
The report also caters detailed information about the crucial aspects such as driving factors & challenges which will define the future growth of the market. Additionally, it also incorporates potential opportunities in micro markets for stakeholders to invest along with the detailed analysis of competitive landscape and product offerings of key players. The detailed segments and sub-segment of the market are explained below:
By Component
Solutions
Services
By Product
Enterprise Wearable Devices
Middleware Software
Cloud Platforms
Business Solutions
By Organization Size
Small-& Medium-sized Enterprises
Large Enterprises
By End Use Industry
BFSI
Healthcare & Life Sciences
Telecommunications & IT
Government & Public Sector
Manufacturing
Consumer Goods & Retail
Media & Entertainment
By Region:
North America
U.S.
Canada
Europe
UK
Germany
France
Spain
Italy
ROE
Asia Pacific
China
India
Japan
Australia
South Korea
RoAPAC
Latin America
Brazil
Mexico
RoLA
Rest of the World
Table of Contents
Chapter 1. Executive Summary
- 1.1. Market Snapshot
- 1.2. Global & Segmental Market Estimates & Forecasts, 2019-2029 (USD Billion)
- 1.2.1. Hyperconnectivity Market, by Region, 2019-2029 (USD Billion)
- 1.2.2. Hyperconnectivity Market, by Component, 2019-2029 (USD Billion)
- 1.2.3. Hyperconnectivity Market, by Product, 2019-2029 (USD Billion)
- 1.2.4. Hyperconnectivity Market, by Organization Size, 2019-2029 (USD Billion)
- 1.2.5. Hyperconnectivity Market, by End-Use Industry, 2019-2029 (USD Billion)
- 1.3. Key Trends
- 1.4. Estimation Methodology
- 1.5. Research Assumption
Chapter 2. Global Hyperconnectivity Market Definition and Scope
- 2.1. Objective of the Study
- 2.2. Market Definition & Scope
- 2.2.1. Scope of the Study
- 2.2.2. Industry Evolution
- 2.3. Years Considered for the Study
- 2.4. Currency Conversion Rates
Chapter 3. Global Hyperconnectivity Market Dynamics
- 3.1. Hyperconnectivity Market Impact Analysis (2019-2029)
- 3.1.1. Market Drivers
- 3.1.1.1. Increasing adoption of IoT technologies
- 3.1.1.2. Growing penetration of smartphones
- 3.1.1.3. Strategic initiatives from leading market players
- 3.1.2. Market Challenges
- 3.1.2.1. Data privacy & Security concerns
- 3.1.3. Market Opportunities
- 3.1.3.1. Rising emergence of high-speed internet connectivity in developing nations
- 3.1.3.2. Increasing adoption of hyperconnectivity solutions in organizations
- 3.1.1. Market Drivers
Chapter 4. Global Hyperconnectivity Market Industry Analysis
- 4.1. Porter's 5 Force Model
- 4.1.1. Bargaining Power of Suppliers
- 4.1.2. Bargaining Power of Buyers
- 4.1.3. Threat of New Entrants
- 4.1.4. Threat of Substitutes
- 4.1.5. Competitive Rivalry
- 4.2. Futuristic Approach to Porter's 5 Force Model (2019-2029)
- 4.3. PEST Analysis
- 4.3.1. Political
- 4.3.2. Economical
- 4.3.3. Social
- 4.3.4. Technological
- 4.4. Top investment opportunity
- 4.5. Top winning strategies
- 4.6. Industry Experts Prospective
- 4.7. Analyst Recommendation & Conclusion
Chapter 5. Risk Assessment: COVID-19 Impact
- 5.1. Assessment of the overall impact of COVID-19 on the industry
- 5.2. Pre COVID-19 and post COVID-19 Market scenario
Chapter 6. Global Hyperconnectivity Market, by Component
- 6.1. Market Snapshot
- 6.2. Global Hyperconnectivity Market by Component, Performance - Potential Analysis
- 6.3. Global Hyperconnectivity Market Estimates & Forecasts by Component 2019-2029 (USD Billion)
- 6.4. Hyperconnectivity Market, Sub Segment Analysis
- 6.4.1. Solutions
- 6.4.2. Services
Chapter 7. Global Hyperconnectivity Market, by Product
- 7.1. Market Snapshot
- 7.2. Global Hyperconnectivity Market by Product, Performance - Potential Analysis
- 7.3. Global Hyperconnectivity Market Estimates & Forecasts by Product 2019-2029 (USD Billion)
- 7.4. Hyperconnectivity Market, Sub Segment Analysis
- 7.4.1. Enterprise Wearable Devices
- 7.4.2. Middleware Software
- 7.4.3. Cloud Platforms
- 7.4.4. Business Solutions
Chapter 8. Global Hyperconnectivity Market, by Organization Size
- 8.1. Market Snapshot
- 8.2. Global Hyperconnectivity Market by Organization Size, Performance - Potential Analysis
- 8.3. Global Hyperconnectivity Market Estimates & Forecasts by Organization Size 2019-2029 (USD Billion)
- 8.4. Hyperconnectivity Market, Sub Segment Analysis
- 8.4.1. Small-& Medium-sized Enterprises
- 8.4.2. Large Enterprises
Chapter 9. Global Hyperconnectivity Market, by End-Use Industry
- 9.1. Market Snapshot
- 9.2. Global Hyperconnectivity Market by End-Use Industry, Performance - Potential Analysis
- 9.3. Global Hyperconnectivity Market Estimates & Forecasts by End-Use Industry 2019-2029 (USD Billion)
- 9.4. Hyperconnectivity Market, Sub Segment Analysis
- 9.4.1. BFSI
- 9.4.2. Healthcare & Life Sciences
- 9.4.3. Telecommunications & IT
- 9.4.4. Government & Public Sector
- 9.4.5. Manufacturing
- 9.4.6. Consumer Goods & Retail
- 9.4.7. Media & Entertainment
Chapter 10. Global Hyperconnectivity Market, Regional Analysis
- 10.1. Hyperconnectivity Market, Regional Market Snapshot
- 10.2. North America Hyperconnectivity Market
- 10.2.1. U.S. Hyperconnectivity Market
- 10.2.1.1. Component breakdown estimates & forecasts, 2019-2029
- 10.2.1.2. Product breakdown estimates & forecasts, 2019-2029
- 10.2.1.3. Organization Size breakdown estimates & forecasts, 2019-2029
- 10.2.1.4. End-Use Industry breakdown estimates & forecasts, 2019-2029
- 10.2.2. Canada Hyperconnectivity Market
- 10.2.1. U.S. Hyperconnectivity Market
- 10.3. Europe Hyperconnectivity Market Snapshot
- 10.3.1. U.K. Hyperconnectivity Market
- 10.3.2. Germany Hyperconnectivity Market
- 10.3.3. France Hyperconnectivity Market
- 10.3.4. Spain Hyperconnectivity Market
- 10.3.5. Italy Hyperconnectivity Market
- 10.3.6. Rest of Europe Hyperconnectivity Market
- 10.4. Asia-Pacific Hyperconnectivity Market Snapshot
- 10.4.1. China Hyperconnectivity Market
- 10.4.2. India Hyperconnectivity Market
- 10.4.3. Japan Hyperconnectivity Market
- 10.4.4. Australia Hyperconnectivity Market
- 10.4.5. South Korea Hyperconnectivity Market
- 10.4.6. Rest of Asia Pacific Hyperconnectivity Market
- 10.5. Latin America Hyperconnectivity Market Snapshot
- 10.5.1. Brazil Hyperconnectivity Market
- 10.5.2. Mexico Hyperconnectivity Market
- 10.5.3. Rest of Latin America Hyperconnectivity Market
- 10.6. Rest of The World Hyperconnectivity Market
Chapter 11. Competitive Intelligence
- 11.1. Top Market Strategies
- 11.2. Company Profiles
- 11.2.1. Avaya Holdings Corp.
- 11.2.1.1. Key Information
- 11.2.1.2. Overview
- 11.2.1.3. Financial (Subject to Data Availability)
- 11.2.1.4. Product Summary
- 11.2.1.5. Recent Developments
- 11.2.2. Extreme Networks
- 11.2.3. Fujitsu Limited
- 11.2.4. Iberdrola SA
- 11.2.5. International Business Machines Corporation
- 11.2.6. Microsoft Corporation
- 11.2.7. Orange IT Solutions
- 11.2.8. Oracle Corporation
- 11.2.9. PathPartner Technology
- 11.2.10. Broadcom Inc.
- 11.2.1. Avaya Holdings Corp.
Chapter 12. Research Process
- 12.1. Research Process
- 12.1.1. Data Mining
- 12.1.2. Analysis
- 12.1.3. Market Estimation
- 12.1.4. Validation
- 12.1.5. Publishing
- 12.2. Research Attributes
- 12.3. Research Assumption
LIST OF TABLES
- TABLE 1. Global Hyperconnectivity Market, report scope
- TABLE 2. Global Hyperconnectivity Market estimates & forecasts by Region 2019-2029 (USD Billion)
- TABLE 3. Global Hyperconnectivity Market estimates & forecasts by Component 2019-2029 (USD Billion)
- TABLE 4. Global Hyperconnectivity Market estimates & forecasts by Product 2019-2029 (USD Billion)
- TABLE 5. Global Hyperconnectivity Market estimates & forecasts by Organization Size 2019-2029 (USD Billion)
- TABLE 6. Global Hyperconnectivity Market estimates & forecasts by End-Use Industry 2019-2029 (USD Billion)
- TABLE 7. Global Hyperconnectivity Market by segment, estimates & forecasts, 2019-2029 (USD Billion)
- TABLE 8. Global Hyperconnectivity Market by region, estimates & forecasts, 2019-2029 (USD Billion)
- TABLE 9. Global Hyperconnectivity Market by segment, estimates & forecasts, 2019-2029 (USD Billion)
- TABLE 10. Global Hyperconnectivity Market by region, estimates & forecasts, 2019-2029 (USD Billion)
- TABLE 11. Global Hyperconnectivity Market by segment, estimates & forecasts, 2019-2029 (USD Billion)
- TABLE 12. Global Hyperconnectivity Market by region, estimates & forecasts, 2019-2029 (USD Billion)
- TABLE 13. Global Hyperconnectivity Market by segment, estimates & forecasts, 2019-2029 (USD Billion)
- TABLE 14. Global Hyperconnectivity Market by region, estimates & forecasts, 2019-2029 (USD Billion)
- TABLE 15. Global Hyperconnectivity Market by segment, estimates & forecasts, 2019-2029 (USD Billion)
- TABLE 16. Global Hyperconnectivity Market by region, estimates & forecasts, 2019-2029 (USD Billion)
- TABLE 17. U.S. Hyperconnectivity Market estimates & forecasts, 2019-2029 (USD Billion)
- TABLE 18. U.S. Hyperconnectivity Market estimates & forecasts by segment 2019-2029 (USD Billion)
- TABLE 19. U.S. Hyperconnectivity Market estimates & forecasts by segment 2019-2029 (USD Billion)
- TABLE 20. Canada Hyperconnectivity Market estimates & forecasts, 2019-2029 (USD Billion)
- TABLE 21. Canada Hyperconnectivity Market estimates & forecasts by segment 2019-2029 (USD Billion)
- TABLE 22. Canada Hyperconnectivity Market estimates & forecasts by segment 2019-2029 (USD Billion)
- TABLE 23. UK Hyperconnectivity Market estimates & forecasts, 2019-2029 (USD Billion)
- TABLE 24. UK Hyperconnectivity Market estimates & forecasts by segment 2019-2029 (USD Billion)
- TABLE 25. UK Hyperconnectivity Market estimates & forecasts by segment 2019-2029 (USD Billion)
- TABLE 26. Germany Hyperconnectivity Market estimates & forecasts, 2019-2029 (USD Billion)
- TABLE 27. Germany Hyperconnectivity Market estimates & forecasts by segment 2019-2029 (USD Billion)
- TABLE 28. Germany Hyperconnectivity Market estimates & forecasts by segment 2019-2029 (USD Billion)
- TABLE 29. France Hyperconnectivity Market estimates & forecasts, 2019-2029 (USD Billion)
- TABLE 30. France Hyperconnectivity Market estimates & forecasts by segment 2019-2029 (USD Billion)
- TABLE 31. France Hyperconnectivity Market estimates & forecasts by segment 2019-2029 (USD Billion)
- TABLE 32. Italy Hyperconnectivity Market estimates & forecasts, 2019-2029 (USD Billion)
- TABLE 33. Italy Hyperconnectivity Market estimates & forecasts by segment 2019-2029 (USD Billion)
- TABLE 34. Italy Hyperconnectivity Market estimates & forecasts by segment 2019-2029 (USD Billion)
- TABLE 35. Spain Hyperconnectivity Market estimates & forecasts, 2019-2029 (USD Billion)
- TABLE 36. Spain Hyperconnectivity Market estimates & forecasts by segment 2019-2029 (USD Billion)
- TABLE 37. Spain Hyperconnectivity Market estimates & forecasts by segment 2019-2029 (USD Billion)
- TABLE 38. RoE Hyperconnectivity Market estimates & forecasts, 2019-2029 (USD Billion)
- TABLE 39. RoE Hyperconnectivity Market estimates & forecasts by segment 2019-2029 (USD Billion)
- TABLE 40. RoE Hyperconnectivity Market estimates & forecasts by segment 2019-2029 (USD Billion)
- TABLE 41. China Hyperconnectivity Market estimates & forecasts, 2019-2029 (USD Billion)
- TABLE 42. China Hyperconnectivity Market estimates & forecasts by segment 2019-2029 (USD Billion)
- TABLE 43. China Hyperconnectivity Market estimates & forecasts by segment 2019-2029 (USD Billion)
- TABLE 44. India Hyperconnectivity Market estimates & forecasts, 2019-2029 (USD Billion)
- TABLE 45. India Hyperconnectivity Market estimates & forecasts by segment 2019-2029 (USD Billion)
- TABLE 46. India Hyperconnectivity Market estimates & forecasts by segment 2019-2029 (USD Billion)
- TABLE 47. Japan Hyperconnectivity Market estimates & forecasts, 2019-2029 (USD Billion)
- TABLE 48. Japan Hyperconnectivity Market estimates & forecasts by segment 2019-2029 (USD Billion)
- TABLE 49. Japan Hyperconnectivity Market estimates & forecasts by segment 2019-2029 (USD Billion)
- TABLE 50. South Korea Hyperconnectivity Market estimates & forecasts, 2019-2029 (USD Billion)
- TABLE 51. South Korea Hyperconnectivity Market estimates & forecasts by segment 2019-2029 (USD Billion)
- TABLE 52. South Korea Hyperconnectivity Market estimates & forecasts by segment 2019-2029 (USD Billion)
- TABLE 53. Australia Hyperconnectivity Market estimates & forecasts, 2019-2029 (USD Billion)
- TABLE 54. Australia Hyperconnectivity Market estimates & forecasts by segment 2019-2029 (USD Billion)
- TABLE 55. Australia Hyperconnectivity Market estimates & forecasts by segment 2019-2029 (USD Billion)
- TABLE 56. RoAPAC Hyperconnectivity Market estimates & forecasts, 2019-2029 (USD Billion)
- TABLE 57. RoAPAC Hyperconnectivity Market estimates & forecasts by segment 2019-2029 (USD Billion)
- TABLE 58. RoAPAC Hyperconnectivity Market estimates & forecasts by segment 2019-2029 (USD Billion)
- TABLE 59. Brazil Hyperconnectivity Market estimates & forecasts, 2019-2029 (USD Billion)
- TABLE 60. Brazil Hyperconnectivity Market estimates & forecasts by segment 2019-2029 (USD Billion)
- TABLE 61. Brazil Hyperconnectivity Market estimates & forecasts by segment 2019-2029 (USD Billion)
- TABLE 62. Mexico Hyperconnectivity Market estimates & forecasts, 2019-2029 (USD Billion)
- TABLE 63. Mexico Hyperconnectivity Market estimates & forecasts by segment 2019-2029 (USD Billion)
- TABLE 64. Mexico Hyperconnectivity Market estimates & forecasts by segment 2019-2029 (USD Billion)
- TABLE 65. RoLA Hyperconnectivity Market estimates & forecasts, 2019-2029 (USD Billion)
- TABLE 66. RoLA Hyperconnectivity Market estimates & forecasts by segment 2019-2029 (USD Billion)
- TABLE 67. RoLA Hyperconnectivity Market estimates & forecasts by segment 2019-2029 (USD Billion)
- TABLE 68. Row Hyperconnectivity Market estimates & forecasts, 2019-2029 (USD Billion)
- TABLE 69. Row Hyperconnectivity Market estimates & forecasts by segment 2019-2029 (USD Billion)
- TABLE 70. Row Hyperconnectivity Market estimates & forecasts by segment 2019-2029 (USD Billion)
- TABLE 71. List of secondary sources, used in the study of global Hyperconnectivity Market
- TABLE 72. List of primary sources, used in the study of global Hyperconnectivity Market
- TABLE 73. Years considered for the study
- TABLE 74. Exchange rates considered
List of tables and figures and dummy in nature, final lists may vary in the final deliverable
LIST OF FIGURES
List of figures
- FIG 1. Global Hyperconnectivity Market, research methodology
- FIG 2. Global Hyperconnectivity Market, Market estimation techniques
- FIG 3. Global Market size estimates & forecast methods
- FIG 4. Global Hyperconnectivity Market, key trends 2021
- FIG 5. Global Hyperconnectivity Market, growth prospects 2022-2029
- FIG 6. Global Hyperconnectivity Market, porters 5 force model
- FIG 7. Global Hyperconnectivity Market, pest analysis
- FIG 8. Global Hyperconnectivity Market, value chain analysis
- FIG 9. Global Hyperconnectivity Market by segment, 2019 & 2029 (USD Billion)
- FIG 10. Global Hyperconnectivity Market by segment, 2019 & 2029 (USD Billion)
- FIG 11. Global Hyperconnectivity Market by segment, 2019 & 2029 (USD Billion)
- FIG 12. Global Hyperconnectivity Market by segment, 2019 & 2029 (USD Billion)
- FIG 13. Global Hyperconnectivity Market by segment, 2019 & 2029 (USD Billion)
- FIG 14. Global Hyperconnectivity Market, regional snapshot 2019 & 2029
- FIG 15. North America Hyperconnectivity Market 2019 & 2029 (USD Billion)
- FIG 16. Europe Hyperconnectivity Market 2019 & 2029 (USD Billion)
- FIG 17. Asia Pacific Hyperconnectivity Market 2019 & 2029 (USD Billion)
- FIG 18. Latin America Hyperconnectivity Market 2019 & 2029 (USD Billion)
- FIG 19. Global Hyperconnectivity Market, company Market share analysis (2021)
List of tables and figures and dummy in nature, final lists may vary in the final deliverable
 超连结市场 - 全球产业规模、份额、趋势、机会和预测,按组件、产品、组织规模、最终用途、地区、竞争细分,2018-2028 年
 超级连接市场:当前分析和预测 (2022-2028)
 超连接市场:按组件、按产品、按组织规模、按行业:2021-2031 年全球机遇分析和行业预测
 全球超连接市场规模、份额、行业趋势分析报告:按组件、按产品、按组织规模(大型企业、中小企业)、按最终用途、按地区、展望和预测,2022-2028 年
 超连接市场规模、份额和趋势分析报告:按组件、按产品、按组织规模、按最终用途、按地区、按细分市场预测,2022-2030 年