


 |
市场调查报告书
商品编码
1258078
威胁建模工俱全球市场规模研究与预测,按组件、平台、组织规模、行业、地区分析,2022-2029Global Threat Modeling Tool Market Size study&Forecast, byComponent by Platform, by Organization Size, by Vertical and Regional Analysis, 2022-2029 |
||||||
到 2021 年,威胁建模工具的全球市场价值约为 7 亿美元,预计在 2022 年至 2029 年的预测期内将以超过 14.9% 的健康增长率增长。
威胁建模工具是用于识别和分析系统或应用程序安全威胁的专业软件。 威胁建模工具为安全团队提供了一种结构化的方法来解决对其係统最重要和最有害的威胁并确定其优先级。 这些工具包括用于常见威胁建模风险的模板,并且可以与其他安全工具集成。 这简化了流程并提高了用户的效率。 此外,越来越多的网络攻击、越来越多地采用云和物联网技术正在推动威胁建模工具的市场。
越来越多的网络攻击也增加了对威胁建模工具的需求。 网络攻击的增长速度增加了保护和保护设备的需求。 到 2021 年,预计几个行业将遭受总网络攻击的 23%,其中製造业占 23%,金融和保险占 22%,专业和商业占 13%。 例如,越来越多地采用云和物联网技术进一步增加了对设备安全和威胁管理的需求。 云应用市场预计将以 4.8% 的复合年增长率增长,到 2025 年将达到 1686 亿美元。 到 2030 年,物联网设备的数量预计将增加约 290 亿,是 2020 年的三倍。 此外,配方的持续进步和研发投资的增加是为威胁建模工具市场创造市场机会的主要因素。 然而,威胁建模工具的复杂工作将阻碍整个 2022-2029 年预测期内的市场增长。
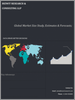
威胁建模工俱全球市场研究中考虑的主要区域包括亚太地区、北美、欧洲、拉丁美洲和世界其他地区。 北美在威胁建模工具市场占据主导地位。 这是因为该地区经历了重大数据洩露和风险,进一步推动了对威胁建模工具的需求。 由于对数据安全的需求不断增长,政府的干预也增加了市场需求。 强制性数据安全措施和政府举措是该地区的主要驱动力。 由于数字化程度不断提高,预计亚太地区将成为增长最快的地区。 快速数字化导致网络攻击激增,进一步增加了对威胁建模工具的需求。
这项研究的目的是揭示近年来各个细分市场和国家/地区的市场规模,并预测未来几年的市场规模。 该报告旨在捕捉被调查国家工业的定性和定量方面的情况。
它还提供了关键方面的详细信息,例如决定市场未来增长的驱动因素和挑战。 此外,它还结合了利益相关者投资微观市场的潜在机会,以及对主要参与者的竞争格局和竞争格局的深入分析。 .
按组件
- 解决方案
- 服务详情
内容
第 1 章执行摘要
- 市场概况
- 2019-2029 年各细分市场的全球市场估计和预测
- 威胁建模工具市场,按地区划分,2019 年至 2029 年
- 威胁建模工具市场,按组件划分,2019 年至 2029 年
- 威胁建模工具市场,按平台划分,2019 年至 2029 年
- 威胁建模工具市场,按组织规模划分,2019 年至 2029 年
- 威胁建模工具市场,按行业划分,2019 年至 2029 年
- 主要趋势
- 调查方法
- 调查先决条件
第 2 章全球威胁建模工具市场定义和范围
- 调查目的
- 市场定义和范围
- 调查范围
- 工业发展
- 本次调查涵盖的年份
- 货币兑换率
第 3 章威胁建模工具的全球市场动态
- 威胁建模工具市场影响分析 (2019-2029)
- 市场驱动力
- 网络攻击发生率增加
- 云和物联网的发展
- 市场挑战
- 威胁建模工具的复杂工作
- 市场机会
- 配方的演变
- 研究与开发
- 市场驱动力
第 4 章威胁建模工具的全球市场行业分析
- 波特 5 力模型
- 供应商的议价能力
- 买家的议价能力
- 新进入者的威胁
- 替代品的威胁
- 竞争公司之间的敌对关係
- 波特 5 力模型的未来方法 (2019-2029)
- 害虫分析
- 政治
- 经济的
- 社交
- 技术
- 投资招聘模式
- 分析师的建议和结论
- 主要投资机会
- 关键成功策略
第 5 章风险评估:COVID-19 的影响
- 评估 COVID-19 对行业的总体影响
- COVID-19 之前和 COVID-19 之后的市场情景
第 6 章威胁建模工具的全球市场:按组件分类
- 市场概况
- 全球威胁建模工具市场:按组件、性能潜力分析
- 2019-2029 年全球威胁建模工具市场估计和预测(按组件)
- 威胁建模工具市场,按细分市场分析
- 解决方案
- 服务详情
第 7 章全球威胁建模工具市场,按平台
- 市场概况
- 威胁建模工具的全球市场:按平台、性能潜力分析
- 2019-2029 年全球威胁建模工具市场平台估计和预测
- 威胁建模工具市场,按细分市场分析
- 基于网络
- 桌麵类型
- 基于云
第 8 章威胁建模工具的全球市场:按组织规模分类
- 市场概况
- 威胁建模工具的全球市场:按组织规模、性能潜力分析
- 2019-2029 年全球威胁建模工具市场组织规模的估计和预测
- 威胁建模工具市场,按细分市场分析
- 大公司
- 中小企业
第 9 章威胁建模工具的全球市场:按行业分类
- 市场概况
- 威胁建模工具的全球市场:按行业、性能潜力分析
- 2019-2029 年全球威胁建模工具市场估计和预测(按行业)
- 威胁建模工具市场,按细分市场分析
- BFSI
- 医疗保健
- 实用程序
- IT□ITeS
- 其他行业
第 10 章威胁建模工具的全球市场:区域分析
- 威胁建模工具市场,按地区划分的市场概况
- 北美
- 美国
- 2019-2029 年各组成部分的估计和预测
- 按平台估算和预测,2019-2029 年
- 按组织规模估算和预测,2019 年至 2029 年
- 2019-2029 年垂直细分的估计和预测
- 加拿大
- 美国
- 欧洲威胁建模工具市场概况
- 英国
- 德国
- 法国
- 西班牙
- 意大利
- 其他欧洲
- 亚太地区威胁建模工具市场概况
- 中国
- 印度
- 日本
- 澳大利亚
- 韩国
- 其他亚太地区
- 拉丁美洲威胁建模工具市场概况
- 巴西
- 墨西哥
- 世界其他地区
第 11 章衝突信息
- 顶级市场策略
- 公司简介
- 克罗尔公司
- 关键信息
- 概览
- 财务(仅当数据可用时)
- 产品概览
- 近期趋势
- CrowdStrike Holdings, Inc.
- Cisco Systems, Inc.,
- International Business Machines Corporation
- Microsoft Corporation
- Varonis Systems
- Sparx Systems India Services Private Limited .
- Mandiant Corporation
- Coalfire Systems, Inc.
- Avocado Systems, Inc.
- 克罗尔公司
第 12 章研究过程
- 研究过程
- 数据挖掘
- 分析
- 市场评估
- 验证
- 出版
- 调查的特点
- 调查先决条件
Global Threat Modeling Tool Market is valued at approximately USD 0.7 billion in 2021 and is anticipated to grow with a healthy growth rate of more than 14.9% over the forecast period 2022-2029.Threat Modeling Tool is software that enables professionals to identify and analyze security threats in a system or application. Threat modeling tool provides a structured approach to security teams to address and prioritize the most critical and harmful threats to the systems. These tools have a built-in template for commonly occurring threat modeling risks and they can also integrate with other security tools. This streamlines their processes and makes them more efficient for their users. Additionally, increasing incidences of cyber-attacks and rising adoption of cloud and IoT technologies are driving the market for threat modeling tools.
The rising incidences of cyber-attacks are also surging the need of threat modeling tool.Cyber-attacks are growing at a speed that raises the need for the protection and safety of devices. In 2021 total cyber-attacks of several industries were projected, manufacturing companies experienced 23% of attacks, finance and insurance 22% and professionals and businesses 13% of total cyber-attacks. The increasing adoption of cloud and IoT technologies is driving the market for threat modeling tools.For instance, the rising deployment of these technologies further raises the need for security and threat management for the devices. The cloud applications market is growing at a CAGR of 4.8% and is anticipated to reach USD 168.6 billion by 2025. The number of IoT devices is to increase in 2030 by around 29 billion, growing three times that of 2020. Moreover, the continuous advancements in formulations and growing investments in Research & Development are major factors creating the market opportunities for Threat Modeling Tool Market..However, the complex working of Threat Modeling Tool stifles market growth throughout the forecast period of 2022-2029.
The key regions considered for the Global Threat Modeling Tool Market study includes Asia Pacific, North America, Europe, Latin America, and Rest of the World. North America dominated the market for threat modeling tools.As major data breaches and risks are accounted from this region which further drives the demand for threat modeling tools. Government intervention due to increasing data security needs is also surging the market demand. Mandatory data security measures and initiatives by the government are major drivers in this region. Asia-Pacific is anticipated to be the fastest-growing region due to increasing digitization in this region. Rapid digitization leads to severalcyber-attacks further boosting the demand for threat modeling tools.
Major market players included in this report are:
- Kroll Inc.
- CrowdStrike Holdings, Inc.
- Cisco Systems, Inc.,
- International Business Machines Corporation
- Microsoft Corporation
- Varonis Systems
- Sparx Systems India Services Private Limited
- Mandiant Corporation
- Coalfire Systems, Inc.
- Avocado Systems, Inc.
Recent Developments in the Market:
- In November 2022, Kroll announced its partnership with CrowdStrike offering its customer the advantage of Kroll's Security Operation Center (SOC) and Crowdstrike falcon platform for faster threat identification, detection, and resolution.
- In July 2021, an acquisition took place by Microsoft with CloudKnox Security to widen its security scope to detect and prevent security threats.
Global Threat Modeling Tool Market Report Scope:
- Historical Data: 2019-2020-2021
- Base Year for Estimation: 2021
- Forecast period: 2022-2029
- Report Coverage: Revenue forecast, Company Ranking, Competitive Landscape, Growth factors, and Trends
- Segments Covered: Component, Platform, Organization Size, Vertical, Region
- Regional Scope: North America; Europe; Asia Pacific; Latin America; Rest of the World
- Customization Scope: Free report customization (equivalent up to 8 analyst's working hours) with purchase. Addition or alteration to country, regional & segment scope*
The objective of the study is to define market sizes of different segments & countries in recent years and to forecast the values to the coming years. The report is designed to incorporate both qualitative and quantitative aspects of the industry within countries involved in the study.
The report also caters detailed information about the crucial aspects such as driving factors & challenges which will define the future growth of the market. Additionally, it also incorporatespotential opportunities in micro markets for stakeholders to invest along with the detailed analysis of competitive landscape and Component offerings of key players. The detailed segments and sub-segment of the market are explained below.
ByComponent:
- Solutions
- Services
By Platform:
- Web-based
- Desktop-based
- Cloud-based
By Organization Size:
- Large enterprises
- Small & medium-sized enterprises
By Vertical:
- BFSI
- Healthcare
- Utilities
- IT &ITeS
- Other verticals
By Region:
- North America
- U.S.
- Canada
- Europe
- UK
- Germany
- France
- Spain
- Italy
- ROE
- Asia Pacific
- China
- India
- Japan
- Australia
- South Korea
- RoAPAC
- Latin America
- Brazil
- Mexico
- Rest of the World
Table of Contents
Chapter 1. Executive Summary
- 1.1. Market Snapshot
- 1.2. Global & Segmental Market Estimates & Forecasts, 2019-2029 (USD Billion)
- 1.2.1. Threat Modeling Tool Market, by Region, 2019-2029 (USD Billion)
- 1.2.2. Threat Modeling Tool Market, by Component,2019-2029 (USD Billion)
- 1.2.3. Threat Modelling Tool Market, by Platform, 2019-2029 (USD Billion)
- 1.2.4. Threat Modeling Tool Market, by Organization Size, 2019-2029 (USD Billion)
- 1.2.5. Threat Modeling Tool Market, by Vertical, 2019-2029 (USD Billion)
- 1.3. Key Trends
- 1.4. Estimation Methodology
- 1.5. Research Assumption
Chapter 2. Global Threat Modeling Tool Market Definition and Scope
- 2.1. Objective of the Study
- 2.2. Market Definition & Scope
- 2.2.1. Scope of the Study
- 2.2.2. Industry Evolution
- 2.3. Years Considered for the Study
- 2.4. Currency Conversion Rates
Chapter 3. Global Threat Modeling Tool Market Dynamics
- 3.1. Threat Modeling Tool Market Impact Analysis (2019-2029)
- 3.1.1. Market Drivers
- 3.1.1.1. Increasing incidence of cyber-attacks.
- 3.1.1.2. Rising Adoption of Cloud and IoT.
- 3.1.2. Market Challenges
- 3.1.2.1. Complex working of Threat Modeling Tool
- 3.1.3. Market Opportunities
- 3.1.3.1. Advancements in Formulation.
- 3.1.3.2. Research &Development.
- 3.1.1. Market Drivers
Chapter 4. Global Threat Modeling Tool Market Industry Analysis
- 4.1. Porter's 5 Force Model
- 4.1.1. Bargaining Power of Suppliers
- 4.1.2. Bargaining Power of Buyers
- 4.1.3. Threat of New Entrants
- 4.1.4. Threat of Substitutes
- 4.1.5. Competitive Rivalry
- 4.2. Futuristic Approach to Porter's 5 Force Model (2019-2029)
- 4.3. PEST Analysis
- 4.3.1. Political
- 4.3.2. Economical
- 4.3.3. Social
- 4.3.4. Technological
- 4.4. Investment Adoption Model
- 4.5. Analyst Recommendation & Conclusion
- 4.6. Top investment opportunity
- 4.7. Top winning strategies
Chapter 5. Risk Assessment: COVID-19 Impact
- 5.1. Assessment of the overall impact of COVID-19 on the industry
- 5.2. Pre COVID-19 and post COVID-19 Market scenario
Chapter 6. Global Threat Modeling Tool Market, by Component
- 6.1. Market Snapshot
- 6.2. Global Threat Modeling Tool Market by Component, Performance - Potential Analysis
- 6.3. Global Threat Modeling Tool Market Estimates & Forecasts by Component2019-2029 (USD Billion)
- 6.4. Threat Modeling Tool Market, Sub Segment Analysis
- 6.4.1. Solutions
- 6.4.2. Services
Chapter 7. Global Threat Modeling Tool Market, by Platform
- 7.1. Market Snapshot
- 7.2. Global Threat Modeling Tool Market by Platform, Performance - Potential Analysis
- 7.3. Global Threat Modeling Tool Market Estimates & Forecasts by Platform2019-2029 (USD Billion)
- 7.4. Threat Modeling Tool Market, Sub Segment Analysis
- 7.4.1. Web-based
- 7.4.2. Desktop-based
- 7.4.3. Cloud-based
Chapter 8. Global Threat Modeling Tool Market, by Organization Size
- 8.1. Market Snapshot
- 8.2. Global Threat Modeling Tool Market by Organization Size, Performance - Potential Analysis
- 8.3. Global Threat Modeling Tool Market Estimates & Forecasts by Organization Size2019-2029 (USD Billion)
- 8.4. Threat Modeling Tool Market, Sub Segment Analysis
- 8.4.1. Large enterprises
- 8.4.2. Small & medium-sized enterprises
Chapter 9. Global Threat Modeling Tool Market, by Vertical
- 9.1. Market Snapshot
- 9.2. Global Threat Modeling Tool Market by Vertical, Performance - Potential Analysis
- 9.3. Global Threat Modeling Tool Market Estimates & Forecasts by Vertical2019-2029 (USD Billion)
- 9.4. Threat Modeling Tool Market, Sub Segment Analysis
- 9.4.1. BFSI
- 9.4.2. Healthcare
- 9.4.3. Utilities
- 9.4.4. IT &ITeS
- 9.4.5. Other verticals
Chapter 10. Global Threat Modeling Tool Market, Regional Analysis
- 10.1. Threat Modeling Tool Market, Regional Market Snapshot
- 10.2. North America Threat Modeling Tool Market
- 10.2.1. U.S. Threat Modeling Tool Market
- 10.2.1.1. Component breakdown estimates & forecasts, 2019-2029
- 10.2.1.2. Platform breakdown estimates & forecasts, 2019-2029
- 10.2.1.3. Organization Size breakdown estimates & forecasts, 2019-2029
- 10.2.1.4. Verticalbreakdown estimates & forecasts, 2019-2029
- 10.2.2. Canada Threat Modeling Tool Market
- 10.2.1. U.S. Threat Modeling Tool Market
- 10.3. Europe Threat Modeling Tool Market Snapshot
- 10.3.1. U.K. Threat Modeling Tool Market
- 10.3.2. Germany Threat Modeling Tool Market
- 10.3.3. France Threat Modeling Tool Market
- 10.3.4. Spain Threat Modeling Tool Market
- 10.3.5. Italy Threat Modeling Tool Market
- 10.3.6. Rest of Europe Threat Modeling Tool Market
- 10.4. Asia-Pacific Threat Modeling Tool Market Snapshot
- 10.4.1. China Threat Modeling Tool Market
- 10.4.2. India Threat Modeling Tool Market
- 10.4.3. Japan Threat Modeling Tool Market
- 10.4.4. Australia Threat Modeling Tool Market
- 10.4.5. South Korea Threat Modeling Tool Market
- 10.4.6. Rest of Asia Pacific Threat Modeling Tool Market
- 10.5. Latin America Threat Modeling Tool Market Snapshot
- 10.5.1. Brazil Threat Modeling Tool Market
- 10.5.2. Mexico Threat Modeling Tool Market
- 10.6. Rest of The World Threat Modeling Tool Market
Chapter 11. Competitive Intelligence
- 11.1. Top Market Strategies
- 11.2. Company Profiles
- 11.2.1. Kroll Inc.
- 11.2.1.1. Key Information
- 11.2.1.2. Overview
- 11.2.1.3. Financial (Subject to Data Availability)
- 11.2.1.4. ProductSummary
- 11.2.1.5. Recent Developments
- 11.2.2. CrowdStrike Holdings, Inc.
- 11.2.3. Cisco Systems, Inc.,
- 11.2.4. International Business Machines Corporation
- 11.2.5. Microsoft Corporation
- 11.2.6. Varonis Systems
- 11.2.7. Sparx Systems India Services Private Limited .
- 11.2.8. Mandiant Corporation
- 11.2.9. Coalfire Systems, Inc.
- 11.2.10. Avocado Systems, Inc.
- 11.2.1. Kroll Inc.
Chapter 12. Research Process
- 12.1. Research Process
- 12.1.1. Data Mining
- 12.1.2. Analysis
- 12.1.3. Market Estimation
- 12.1.4. Validation
- 12.1.5. Publishing
- 12.2. Research Attributes
- 12.3. Research Assumption
LIST OF TABLES
- TABLE 1. Global Threat Modeling Tool Market, report scope
- TABLE 2. Global Threat Modeling Tool Market estimates & forecasts by Region 2019-2029 (USD Billion)
- TABLE 3. Global Threat Modeling Tool Market estimates & forecasts byComponent2019-2029 (USD Billion)
- TABLE 4. Global Threat Modeling Tool Market estimates & forecasts by Platform2019-2029 (USD Billion)
- TABLE 5. Global Threat Modeling Tool Market estimates & forecasts by Organization Size2019-2029 (USD Billion)
- TABLE 6. Global Threat Modeling Tool Market estimates & forecasts by Vertical2019-2029 (USD Billion)
- TABLE 7. Global Threat Modeling Tool Market by segment, estimates & forecasts, 2019-2029 (USD Billion)
- TABLE 8. Global Threat Modeling Tool Market by region, estimates & forecasts, 2019-2029 (USD Billion)
- TABLE 9. Global Threat Modeling Tool Market by segment, estimates & forecasts, 2019-2029 (USD Billion)
- TABLE 10. Global Threat Modeling Tool Market by region, estimates & forecasts, 2019-2029 (USD Billion)
- TABLE 11. Global Threat Modeling Tool Market by segment, estimates & forecasts, 2019-2029 (USD Billion)
- TABLE 12. Global Threat Modeling Tool Market by region, estimates & forecasts, 2019-2029 (USD Billion)
- TABLE 13. Global Threat Modeling Tool Market by segment, estimates & forecasts, 2019-2029 (USD Billion)
- TABLE 14. Global Threat Modeling Tool Market by region, estimates & forecasts, 2019-2029 (USD Billion)
- TABLE 15. Global Threat Modeling Tool Market by segment, estimates & forecasts, 2019-2029 (USD Billion)
- TABLE 16. Global Threat Modeling Tool Market by region, estimates & forecasts, 2019-2029 (USD Billion)
- TABLE 17. U.S. Threat Modeling Tool Market estimates & forecasts, 2019-2029 (USD Billion)
- TABLE 18. U.S. Threat Modeling Tool Market estimates & forecasts by segment 2019-2029 (USD Billion)
- TABLE 19. U.S. Threat Modeling Tool Market estimates & forecasts by segment 2019-2029 (USD Billion)
- TABLE 20. Canada Threat Modeling Tool Market estimates & forecasts, 2019-2029 (USD Billion)
- TABLE 21. Canada Threat Modeling Tool Market estimates & forecasts by segment 2019-2029 (USD Billion)
- TABLE 22. Canada Threat Modeling Tool Market estimates & forecasts by segment 2019-2029 (USD Billion)
- TABLE 23. UK Threat Modeling Tool Market estimates & forecasts, 2019-2029 (USD Billion)
- TABLE 24. UK Threat Modeling Tool Market estimates & forecasts by segment 2019-2029 (USD Billion)
- TABLE 25. UK Threat Modeling Tool Market estimates & forecasts by segment 2019-2029 (USD Billion)
- TABLE 26. Germany Threat Modeling Tool Market estimates & forecasts, 2019-2029 (USD Billion)
- TABLE 27. Germany Threat Modeling Tool Market estimates & forecasts by segment 2019-2029 (USD Billion)
- TABLE 28. Germany Threat Modeling Tool Market estimates & forecasts by segment 2019-2029 (USD Billion)
- TABLE 29. France Threat Modeling Tool Market estimates & forecasts, 2019-2029 (USD Billion)
- TABLE 30. France Threat Modeling Tool Market estimates & forecasts by segment 2019-2029 (USD Billion)
- TABLE 31. France Threat Modeling Tool Market estimates & forecasts by segment 2019-2029 (USD Billion)
- TABLE 32. Italy Threat Modeling Tool Market estimates & forecasts, 2019-2029 (USD Billion)
- TABLE 33. Italy Threat Modeling Tool Market estimates & forecasts by segment 2019-2029 (USD Billion)
- TABLE 34. Italy Threat Modeling Tool Market estimates & forecasts by segment 2019-2029 (USD Billion)
- TABLE 35. Spain Threat Modeling Tool Market estimates & forecasts, 2019-2029 (USD Billion)
- TABLE 36. Spain Threat Modeling Tool Market estimates & forecasts by segment 2019-2029 (USD Billion)
- TABLE 37. Spain Threat Modeling Tool Market estimates & forecasts by segment 2019-2029 (USD Billion)
- TABLE 38. RoE Threat Modeling Tool Market estimates & forecasts, 2019-2029 (USD Billion)
- TABLE 39. RoE Threat Modeling Tool Market estimates & forecasts by segment 2019-2029 (USD Billion)
- TABLE 40. RoE Threat Modeling Tool Market estimates & forecasts by segment 2019-2029 (USD Billion)
- TABLE 41. China Threat Modeling Tool Market estimates & forecasts, 2019-2029 (USD Billion)
- TABLE 42. China Threat Modeling Tool Market estimates & forecasts by segment 2019-2029 (USD Billion)
- TABLE 43. China Threat Modeling Tool Market estimates & forecasts by segment 2019-2029 (USD Billion)
- TABLE 44. India Threat Modeling Tool Market estimates & forecasts, 2019-2029 (USD Billion)
- TABLE 45. India Threat Modeling Tool Market estimates & forecasts by segment 2019-2029 (USD Billion)
- TABLE 46. India Threat Modeling Tool Market estimates & forecasts by segment 2019-2029 (USD Billion)
- TABLE 47. Japan Threat Modeling Tool Market estimates & forecasts, 2019-2029 (USD Billion)
- TABLE 48. Japan Threat Modeling Tool Market estimates & forecasts by segment 2019-2029 (USD Billion)
- TABLE 49. Japan Threat Modeling Tool Market estimates & forecasts by segment 2019-2029 (USD Billion)
- TABLE 50. South Korea Threat Modeling Tool Market estimates & forecasts, 2019-2029 (USD Billion)
- TABLE 51. South Korea Threat Modeling Tool Market estimates & forecasts by segment 2019-2029 (USD Billion)
- TABLE 52. South Korea Threat Modeling Tool Market estimates & forecasts by segment 2019-2029 (USD Billion)
- TABLE 53. Australia Threat Modeling Tool Market estimates & forecasts, 2019-2029 (USD Billion)
- TABLE 54. Australia Threat Modeling Tool Market estimates & forecasts by segment 2019-2029 (USD Billion)
- TABLE 55. Australia Threat Modeling Tool Market estimates & forecasts by segment 2019-2029 (USD Billion)
- TABLE 56. RoAPAC Threat Modeling Tool Market estimates & forecasts, 2019-2029 (USD Billion)
- TABLE 57. RoAPAC Threat Modeling Tool Market estimates & forecasts by segment 2019-2029 (USD Billion)
- TABLE 58. RoAPAC Threat Modeling Tool Market estimates & forecasts by segment 2019-2029 (USD Billion)
- TABLE 59. Brazil Threat Modeling Tool Market estimates & forecasts, 2019-2029 (USD Billion)
- TABLE 60. Brazil Threat Modeling Tool Market estimates & forecasts by segment 2019-2029 (USD Billion)
- TABLE 61. Brazil Threat Modeling Tool Market estimates & forecasts by segment 2019-2029 (USD Billion)
- TABLE 62. Mexico Threat Modeling Tool Market estimates & forecasts, 2019-2029 (USD Billion)
- TABLE 63. Mexico Threat Modeling Tool Market estimates & forecasts by segment 2019-2029 (USD Billion)
- TABLE 64. Mexico Threat Modeling Tool Market estimates & forecasts by segment 2019-2029 (USD Billion)
- TABLE 65. RoLA Threat Modeling Tool Market estimates & forecasts, 2019-2029 (USD Billion)
- TABLE 66. RoLA Threat Modeling Tool Market estimates & forecasts by segment 2019-2029 (USD Billion)
- TABLE 67. RoLA Threat Modeling Tool Market estimates & forecasts by segment 2019-2029 (USD Billion)
- TABLE 68. Row Threat Modeling Tool Market estimates & forecasts, 2019-2029 (USD Billion)
- TABLE 69. Row Threat Modeling Tool Market estimates & forecasts by segment 2019-2029 (USD Billion)
- TABLE 70. Row Threat Modeling Tool Market estimates & forecasts by segment 2019-2029 (USD Billion)
- TABLE 71. List of secondary sources, used in the study of global Threat Modeling Tool Market
- TABLE 72. List of primary sources, used in the study of global Threat Modeling Tool Market
- TABLE 73. Years considered for the study
- TABLE 74. Exchange rates considered
List of tables and figures and dummy in nature, final lists may vary in the final deliverable
LIST OF FIGURES
List of figures
- FIG 1. Global Threat Modeling Tool Market, research methodology
- FIG 2. Global Threat Modeling Tool Market, Market estimation techniques
- FIG 3. Global Market size estimates & forecast methods
- FIG 4. Global Threat Modeling Tool Market, key trends 2021
- FIG 5. Global Threat Modeling Tool Market, growth prospects 2022-2029
- FIG 6. Global Threat Modeling Tool Market, porters 5 force model
- FIG 7. Global Threat Modeling Tool Market, pest analysis
- FIG 8. Global Threat Modeling Tool Market, value chain analysis
- FIG 9. Global Threat Modeling Tool Market by segment, 2019 & 2029 (USD Billion)
- FIG 10. Global Threat Modeling Tool Market by segment, 2019 & 2029 (USD Billion)
- FIG 11. Global Threat Modeling Tool Market by segment, 2019 & 2029 (USD Billion)
- FIG 12. Global Threat Modeling Tool Market by segment, 2019 & 2029 (USD Billion)
- FIG 13. Global Threat Modeling Tool Market by segment, 2019 & 2029 (USD Billion)
- FIG 14. Global Threat Modeling Tool Market, regional snapshot 2019 & 2029
- FIG 15. North America Threat Modeling Tool Market2019 & 2029 (USD Billion)
- FIG 16. Europe Threat Modeling Tool Market2019 & 2029 (USD Billion)
- FIG 17. Asia pacific Threat Modeling Tool Market2019 & 2029 (USD Billion)
- FIG 18. Latin America Threat Modeling Tool Market2019 & 2029 (USD Billion)
- FIG 19. Global Threat Modeling Tool Market, company Market share analysis (2021)
List of tables and figures and dummy in nature, final lists may vary in the final deliverable
 2024 年威胁情报全球市场报告
 威胁情报 - 市场占有率分析、产业趋势与统计、成长预测(2024 - 2029)
 第三方风险管理市场规模 - 按组件(解决方案、服务)、应用程式(供应链管理、IT 和网路安全、金融服务、BPO)、产业、成长前景、区域展望和全球预测,2024 年至 2032 年
 威胁情报市场报告:2030 年趋势、预测与竞争分析
 全球威胁情报市场
 威胁情报的全球市场(2023年~2033年)
 威胁建模工具市场:按类型、方法、部署、组织规模、最终用户 - 2023-2030 年全球预测
 威胁情报市场:按解决方案、服务、部署和用途划分 - COVID-19、俄罗斯-乌克兰衝突和高通膨的累积影响 - 2023-2030 年全球预测
 威胁建模工具市场:各零件,各平台,不同企业规模,各业界:全球机会分析与产业预测,2023年~2032年
 到2028年的威胁情报市场预测—按服务、解决方案、部署模式、组织规模、应用程序、最终用户和地区进行的全球分析