


 |
市场调查报告书
商品编码
1334629
全球数字电力公用事业市场规模研究与预测,按技术(硬件、软件和服务)、部门(发电、输电和配电、电力消耗)和区域分析,2023-2030 年Global Digital Power Utility Market Size study & Forecast, by Technology (Hardware, Software & Service), by Sector (Power Generation, Transmission & Distribution, Power Consumption) and Regional Analysis, 2023-2030 |
||||||
数字电力公司是指将先进的数字技术集成到电力公司的运营和管理中。在数字技术、数据分析和自动化快速发展的推动下,传统电力行业一直在经历转型。目的是提高效率、可靠性和可持续性,同时为客户提供更好的服务。推动市场增长的关键因素是可再生能源项目资本投资的增加、智能电网的不断实施以及各行业对能源需求的不断增长,预计将促进数字化的采用,从而在 2023 年预测期内支持市场增长-2030 。
此外,对智能电网不断增长的需求是支持数字电力公用事业市场增长的重要因素。随着世界转向更清洁、更可持续的能源结构,太阳能、风能和水力发电等可再生能源的整合日益增多。智能电网在将这些间歇性能源有效整合到电网方面发挥着至关重要的作用。数字电力公用事业解决方案能够实时监测和控制可再生能源发电,确保其顺利整合併优化其使用。据 Statista 称,2022 年全球智能电网技术市场价值为 497 亿美元,预计到 2028 年将达到 1302 亿美元。此外,政府的一致倡议预计将在预测期内为市场创造利润丰厚的机会。然而,改造现有基础设施的高昂运营成本抑制了 2023-2030 年预测期内的市场增长。
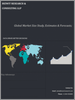
全球数字电力公用事业市场研究考虑的关键区域包括亚太地区、北美、欧洲、拉丁美洲以及中东和非洲。由于该地区各个行业的足迹增加,导致输配电行业扩张,北美将在 2022 年占据市场主导地位。此外,对智能建筑和楼宇自动化的需求不断增长,促进了该地区智能计量和传感器的安装,这也支持了市场的增长。然而,由于政府支持力度加大、绿色建筑趋势的采用以及可再生能源投资等因素是推动市场扩张的关键因素,预计亚太地区在预测期内将以最高的复合年增长率增长。预计中国和印度等国家化石燃料发电的扩大将扩大该地区的市场。
该研究的目的是确定近年来不同细分市场和国家的市场规模,并预测未来几年的价值。该报告旨在纳入参与研究的国家内该行业的定性和定量方面。
该报告还提供了有关驱动因素和挑战等关键方面的详细信息,这些因素将决定市场的未来增长。此外,它还纳入了利益相关者投资的微观市场的潜在机会,以及对主要参与者的竞争格局和产品供应的详细分析。 。
目录
第 1 章:执行摘要
- 市场概况
- 2020-2030 年全球和细分市场估计与预测
- 2020-2030 年数字电力公用事业市场(按地区)
- 数字电力公用事业市场,按技术划分,2020-2030 年
- 数字电力公用事业市场,按行业划分,2020-2030 年
- 主要趋势
- 估算方法
- 研究假设
第 2 章:全球数字电力公用事业市场定义和范围
- 研究目的
- 市场定义和范围
- 行业演变
- 研究范围
- 研究考虑的年份
- 货币兑换率
第 3 章:全球数字电力公用事业市场动态
- 数字电力公用事业市场影响分析(2020-2030)
- 市场驱动因素
- 可再生能源项目的资本投资不断增加
- 智能电网的不断实施
- 各行业对能源的需求不断增长
- 市场挑战
- 改造现有基础设施运营成本高昂
- 市场机会
- 具有凝聚力的政府倡议
- 不断增长的电力消耗
- 市场驱动因素
第 4 章:全球数字电力公用事业市场行业分析
- 波特的五力模型
- 供应商的议价能力
- 买家的议价能力
- 新进入者的威胁
- 替代品的威胁
- 竞争竞争
- 波特的五力影响分析
- PEST分析
- 政治的
- 经济
- 社会的
- 技术性
- 环境的
- 合法的
- 顶级投资机会
- 最佳制胜策略
- COVID-19 影响分析
- 颠覆性趋势
- 行业专家视角
- 分析师推荐与结论
第 5 章:按技术分類的全球数字电力公用事业市场
- 市场概况
- 全球数字电力公用事业市场(按技术、性能)-潜力分析
- 2020-2030 年全球数字电力公用事业市场估计和技术预测
- 数字电力公用事业市场細項分析
- 硬件
- 软件与服务
第 6 章:全球数字电力公用事业市场(按行业)
- 市场概况
- 全球数字电力公用事业市场(按行业、绩效 - 潜力分析)
- 2020-2030 年按行业分類的全球数字电力公用事业市场估计和预测
- 数字电力公用事业市场細項分析
- 发电
- 输配电
- 能量消耗
第 7 章:全球数字电力公用事业市场,区域分析
- 领先国家
- 顶级新兴国家
- 数字电力公用事业市场,区域市场概况
- 北美
- 我们
- 2020-2030 年技术细分估计和预测
- 2020-2030 年行业细分估计和预测
- 加拿大
- 我们
- 欧洲数字电力公用事业市场概况
- 英国
- 德国
- 法国
- 西班牙
- 意大利
- 欧洲其他地区
- 亚太数字电力公用事业市场概况
- 中国
- 印度
- 日本
- 澳大利亚
- 韩国
- 亚太地区其他地区
- 拉丁美洲数字电力公用事业市场概况
- 巴西
- 墨西哥
- 中东和非洲
- 沙特阿拉伯
- 南非
- 中东和非洲其他地区
第 8 章:竞争情报
- 重点企业SWOT分析
- 公司1
- 公司2
- 公司3
- 顶级市场策略
- 公司简介
- ABB Ltd (Switzerland)
- 关键信息
- 概述
- 财务(视数据可用性而定)
- 产品概要
- 最近的发展
- General Electric Company (US)
- Siemens (Germany)
- Accenture Plc (Ireland)
- Capgemini Ltd (France)
- SAP SE (Germany)
- International Business Machines Corporation (US)
- Microsoft Corporation (US)
- Oracle Corporation (US)
- Wipro Ltd (India)
第 9 章:研究过程
- 研究过程
- 资料探勘
- 分析
- 市场预测
- 验证
- 出版
- 研究属性
- 研究假设
A Digital Power Utility refers to the integration of advanced digital technologies into the operations and management of a power utility. The traditional power utility industry has been undergoing a transformation driven by rapid advancements in digital technologies, data analytics, and automation. The aim is to enhance efficiency, reliability, and sustainability while providing better services to customers. The key factors driving the market growth are growing capital investment in renewable energy projects, rising implementation of smart grid, and rising demand for energy in various sectors is anticipated to promote the adoption of digitalization that anticipated to support the market growth during the forecast period 2023-2030.
Moreover, the growing demand for smart grids is a significant factor supporting the growth of the digital power utility market. As the world shifts towards a cleaner and more sustainable energy mix, there is increasing integration of renewable energy sources such as solar, wind, and hydroelectric power. Smart grids play a crucial role in efficiently integrating these intermittent energy sources into the grid. Digital power utility solutions enable real-time monitoring and control of renewable energy generation, ensuring its smooth integration and optimizing its use. According to Statista, in 2022, the global Smart grid technology market was valued at USD 49.7 billion, and it is anticipated to reach USD 130.2 billion by 2028. Additionally, cohesive government initiatives are anticipated to create lucrative opportunities for the market during the forecast period. However, the high operating cost to transform the existing infrastructure stifles market growth throughout the forecast period of 2023-2030.
The key regions considered for the Global Digital Power Utility Market study includes Asia Pacific, North America, Europe, Latin America, and Middle East & Africa. North America dominated the market in 2022 owing to the rise in the footprint of various sectors in the region, which has led to the expansion of the power transmission & distribution industry. Also, the increasing need for intelligent buildings and building automation contributed to the installation of smart metering and sensors in the area, and that also supported the market growth. Whereas, the Asia Pacific is expected to grow with the highest CAGR during the forecast period, owing to factors such as the rising government backing, adoption of green building trends, and investment in renewable energy are the key factors contributing to the market's expansion. It is anticipated that the expansion of fossil fuel power generation in countries such as China and India would expand the region's market.
Major market player included in this report are:
- ABB Ltd. (Switzerland)
- General Electric Company (U.S.)
- Siemens (Germany)
- Accenture Plc (Ireland)
- Capgemini Ltd (France)
- SAP SE (Germany)
- International Business Machines Corporation (U.S.)
- Microsoft Corporation (U.S.)
- Oracle Corporation (U.S.)
- Wipro Ltd (India)
Recent Developments in the Market:
- In October 2021, Wipro Limited, an Indian multinational corporation, has entered into a multi-year worldwide strategic IT and digital agreement with National Grid, a British multinational electricity and gas utility company, to accelerate its digital innovation journey.
Global Digital Power Utility Market Report Scope:
- Historical Data: 2020 - 2021
- Base Year for Estimation: 2022
- Forecast period: 2023-2030
- Report Coverage: Revenue forecast, Company Ranking, Competitive Landscape, Growth factors, and Trends
- Segments Covered: Technology, Sector, Region
- Regional Scope: North America; Europe; Asia Pacific; Latin America; Middle East & Africa
- Customization Scope: Free report customization (equivalent up to 8 analyst's working hours) with purchase. Addition or alteration to country, regional & segment scope*
The objective of the study is to define market sizes of different segments & countries in recent years and to forecast the values to the coming years. The report is designed to incorporate both qualitative and quantitative aspects of the industry within countries involved in the study.
The report also caters detailed information about the crucial aspects such as driving factors & challenges which will define the future growth of the market. Additionally, it also incorporates potential opportunities in micro markets for stakeholders to invest along with the detailed analysis of competitive landscape and product offerings of key players. The detailed segments and sub-segment of the market are explained below.
By Technology:
- Hardware
- Software & Service
By Sector:
- Power Generation
- Transmission & Distribution
- Power Consumption
By Region:
- North America
- U.S.
- Canada
- Europe
- UK
- Germany
- France
- Spain
- Italy
- ROE
- Asia Pacific
- China
- India
- Japan
- Australia
- South Korea
- RoAPAC
- Latin America
- Brazil
- Mexico
- Middle East & Africa
- Saudi Arabia
- South Africa
- Rest of Middle East & Africa
Table of Contents
Chapter 1. Executive Summary
- 1.1. Market Snapshot
- 1.2. Global & Segmental Market Estimates & Forecasts, 2020-2030 (USD Billion)
- 1.2.1. Digital Power Utility Market, by Region, 2020-2030 (USD Billion)
- 1.2.2. Digital Power Utility Market, by Technology, 2020-2030 (USD Billion)
- 1.2.3. Digital Power Utility Market, by Sector, 2020-2030 (USD Billion)
- 1.3. Key Trends
- 1.4. Estimation Methodology
- 1.5. Research Assumption
Chapter 2. Global Digital Power Utility Market Definition and Scope
- 2.1. Objective of the Study
- 2.2. Market Definition & Scope
- 2.2.1. Industry Evolution
- 2.2.2. Scope of the Study
- 2.3. Years Considered for the Study
- 2.4. Currency Conversion Rates
Chapter 3. Global Digital Power Utility Market Dynamics
- 3.1. Digital Power Utility Market Impact Analysis (2020-2030)
- 3.1.1. Market Drivers
- 3.1.1.1. Growing capital investment in renewable energy projects
- 3.1.1.2. Rising implementation of smart grid
- 3.1.1.3. Rising demand for energy in various sectors
- 3.1.2. Market Challenges
- 3.1.2.1. High operating cost to transform the existing infrastructure
- 3.1.3. Market Opportunities
- 3.1.3.1. Cohesive government initiatives
- 3.1.3.2. Growing power Consumption
- 3.1.1. Market Drivers
Chapter 4. Global Digital Power Utility Market Industry Analysis
- 4.1. Porter's 5 Force Model
- 4.1.1. Bargaining Power of Suppliers
- 4.1.2. Bargaining Power of Buyers
- 4.1.3. Threat of New Entrants
- 4.1.4. Threat of Substitutes
- 4.1.5. Competitive Rivalry
- 4.2. Porter's 5 Force Impact Analysis
- 4.3. PEST Analysis
- 4.3.1. Political
- 4.3.2. Economical
- 4.3.3. Social
- 4.3.4. Technological
- 4.3.5. Environmental
- 4.3.6. Legal
- 4.4. Top investment opportunity
- 4.5. Top winning strategies
- 4.6. COVID-19 Impact Analysis
- 4.7. Disruptive Trends
- 4.8. Industry Expert Perspective
- 4.9. Analyst Recommendation & Conclusion
Chapter 5. Global Digital Power Utility Market, by Technology
- 5.1. Market Snapshot
- 5.2. Global Digital Power Utility Market by Technology, Performance - Potential Analysis
- 5.3. Global Digital Power Utility Market Estimates & Forecasts by Technology 2020-2030 (USD Billion)
- 5.4. Digital Power Utility Market, Sub Segment Analysis
- 5.4.1. Hardware
- 5.4.2. Software & Service
Chapter 6. Global Digital Power Utility Market, by Sector
- 6.1. Market Snapshot
- 6.2. Global Digital Power Utility Market by Sector, Performance - Potential Analysis
- 6.3. Global Digital Power Utility Market Estimates & Forecasts by Sector 2020-2030 (USD Billion)
- 6.4. Digital Power Utility Market, Sub Segment Analysis
- 6.4.1. Power Generation
- 6.4.2. Transmission & Distribution
- 6.4.3. Power Consumption
Chapter 7. Global Digital Power Utility Market, Regional Analysis
- 7.1. Top Leading Countries
- 7.2. Top Emerging Countries
- 7.3. Digital Power Utility Market, Regional Market Snapshot
- 7.4. North America Digital Power Utility Market
- 7.4.1. U.S. Digital Power Utility Market
- 7.4.1.1. Technology breakdown estimates & forecasts, 2020-2030
- 7.4.1.2. Sector breakdown estimates & forecasts, 2020-2030
- 7.4.2. Canada Digital Power Utility Market
- 7.4.1. U.S. Digital Power Utility Market
- 7.5. Europe Digital Power Utility Market Snapshot
- 7.5.1. U.K. Digital Power Utility Market
- 7.5.2. Germany Digital Power Utility Market
- 7.5.3. France Digital Power Utility Market
- 7.5.4. Spain Digital Power Utility Market
- 7.5.5. Italy Digital Power Utility Market
- 7.5.6. Rest of Europe Digital Power Utility Market
- 7.6. Asia-Pacific Digital Power Utility Market Snapshot
- 7.6.1. China Digital Power Utility Market
- 7.6.2. India Digital Power Utility Market
- 7.6.3. Japan Digital Power Utility Market
- 7.6.4. Australia Digital Power Utility Market
- 7.6.5. South Korea Digital Power Utility Market
- 7.6.6. Rest of Asia Pacific Digital Power Utility Market
- 7.7. Latin America Digital Power Utility Market Snapshot
- 7.7.1. Brazil Digital Power Utility Market
- 7.7.2. Mexico Digital Power Utility Market
- 7.8. Middle East & Africa Digital Power Utility Market
- 7.8.1. Saudi Arabia Digital Power Utility Market
- 7.8.2. South Africa Digital Power Utility Market
- 7.8.3. Rest of Middle East & Africa Digital Power Utility Market
Chapter 8. Competitive Intelligence
- 8.1. Key Company SWOT Analysis
- 8.1.1. Company 1
- 8.1.2. Company 2
- 8.1.3. Company 3
- 8.2. Top Market Strategies
- 8.3. Company Profiles
- 8.3.1. ABB Ltd (Switzerland)
- 8.3.1.1. Key Information
- 8.3.1.2. Overview
- 8.3.1.3. Financial (Subject to Data Availability)
- 8.3.1.4. Product Summary
- 8.3.1.5. Recent Developments
- 8.3.2. General Electric Company (U.S.)
- 8.3.3. Siemens (Germany)
- 8.3.4. Accenture Plc (Ireland)
- 8.3.5. Capgemini Ltd (France)
- 8.3.6. SAP SE (Germany)
- 8.3.7. International Business Machines Corporation (U.S.)
- 8.3.8. Microsoft Corporation (U.S.)
- 8.3.9. Oracle Corporation (U.S.)
- 8.3.10. Wipro Ltd (India)
- 8.3.1. ABB Ltd (Switzerland)
Chapter 9. Research Process
- 9.1. Research Process
- 9.1.1. Data Mining
- 9.1.2. Analysis
- 9.1.3. Market Estimation
- 9.1.4. Validation
- 9.1.5. Publishing
- 9.2. Research Attributes
- 9.3. Research Assumption
LIST OF TABLES
- TABLE 1. Global Digital Power Utility Market, report scope
- TABLE 2. Global Digital Power Utility Market estimates & forecasts by region 2020-2030 (USD Billion)
- TABLE 3. Global Digital Power Utility Market estimates & forecasts by Technology 2020-2030 (USD Billion)
- TABLE 4. Global Digital Power Utility Market estimates & forecasts by Sector 2020-2030 (USD Billion)
- TABLE 5. Global Digital Power Utility Market by segment, estimates & forecasts, 2020-2030 (USD Billion)
- TABLE 6. Global Digital Power Utility Market by region, estimates & forecasts, 2020-2030 (USD Billion)
- TABLE 7. Global Digital Power Utility Market by segment, estimates & forecasts, 2020-2030 (USD Billion)
- TABLE 8. Global Digital Power Utility Market by region, estimates & forecasts, 2020-2030 (USD Billion)
- TABLE 9. Global Digital Power Utility Market by segment, estimates & forecasts, 2020-2030 (USD Billion)
- TABLE 10. Global Digital Power Utility Market by region, estimates & forecasts, 2020-2030 (USD Billion)
- TABLE 11. Global Digital Power Utility Market by segment, estimates & forecasts, 2020-2030 (USD Billion)
- TABLE 12. Global Digital Power Utility Market by region, estimates & forecasts, 2020-2030 (USD Billion)
- TABLE 13. Global Digital Power Utility Market by segment, estimates & forecasts, 2020-2030 (USD Billion)
- TABLE 14. Global Digital Power Utility Market by region, estimates & forecasts, 2020-2030 (USD Billion)
- TABLE 15. U.S. Digital Power Utility Market estimates & forecasts, 2020-2030 (USD Billion)
- TABLE 16. U.S. Digital Power Utility Market estimates & forecasts by segment 2020-2030 (USD Billion)
- TABLE 17. U.S. Digital Power Utility Market estimates & forecasts by segment 2020-2030 (USD Billion)
- TABLE 18. Canada Digital Power Utility Market estimates & forecasts, 2020-2030 (USD Billion)
- TABLE 19. Canada Digital Power Utility Market estimates & forecasts by segment 2020-2030 (USD Billion)
- TABLE 20. Canada Digital Power Utility Market estimates & forecasts by segment 2020-2030 (USD Billion)
- TABLE 21. UK Digital Power Utility Market estimates & forecasts, 2020-2030 (USD Billion)
- TABLE 22. UK Digital Power Utility Market estimates & forecasts by segment 2020-2030 (USD Billion)
- TABLE 23. UK Digital Power Utility Market estimates & forecasts by segment 2020-2030 (USD Billion)
- TABLE 24. Germany Digital Power Utility Market estimates & forecasts, 2020-2030 (USD Billion)
- TABLE 25. Germany Digital Power Utility Market estimates & forecasts by segment 2020-2030 (USD Billion)
- TABLE 26. Germany Digital Power Utility Market estimates & forecasts by segment 2020-2030 (USD Billion)
- TABLE 27. France Digital Power Utility Market estimates & forecasts, 2020-2030 (USD Billion)
- TABLE 28. France Digital Power Utility Market estimates & forecasts by segment 2020-2030 (USD Billion)
- TABLE 29. France Digital Power Utility Market estimates & forecasts by segment 2020-2030 (USD Billion)
- TABLE 30. Italy Digital Power Utility Market estimates & forecasts, 2020-2030 (USD Billion)
- TABLE 31. Italy Digital Power Utility Market estimates & forecasts by segment 2020-2030 (USD Billion)
- TABLE 32. Italy Digital Power Utility Market estimates & forecasts by segment 2020-2030 (USD Billion)
- TABLE 33. Spain Digital Power Utility Market estimates & forecasts, 2020-2030 (USD Billion)
- TABLE 34. Spain Digital Power Utility Market estimates & forecasts by segment 2020-2030 (USD Billion)
- TABLE 35. Spain Digital Power Utility Market estimates & forecasts by segment 2020-2030 (USD Billion)
- TABLE 36. RoE Digital Power Utility Market estimates & forecasts, 2020-2030 (USD Billion)
- TABLE 37. RoE Digital Power Utility Market estimates & forecasts by segment 2020-2030 (USD Billion)
- TABLE 38. RoE Digital Power Utility Market estimates & forecasts by segment 2020-2030 (USD Billion)
- TABLE 39. China Digital Power Utility Market estimates & forecasts, 2020-2030 (USD Billion)
- TABLE 40. China Digital Power Utility Market estimates & forecasts by segment 2020-2030 (USD Billion)
- TABLE 41. China Digital Power Utility Market estimates & forecasts by segment 2020-2030 (USD Billion)
- TABLE 42. India Digital Power Utility Market estimates & forecasts, 2020-2030 (USD Billion)
- TABLE 43. India Digital Power Utility Market estimates & forecasts by segment 2020-2030 (USD Billion)
- TABLE 44. India Digital Power Utility Market estimates & forecasts by segment 2020-2030 (USD Billion)
- TABLE 45. Japan Digital Power Utility Market estimates & forecasts, 2020-2030 (USD Billion)
- TABLE 46. Japan Digital Power Utility Market estimates & forecasts by segment 2020-2030 (USD Billion)
- TABLE 47. Japan Digital Power Utility Market estimates & forecasts by segment 2020-2030 (USD Billion)
- TABLE 48. South Korea Digital Power Utility Market estimates & forecasts, 2020-2030 (USD Billion)
- TABLE 49. South Korea Digital Power Utility Market estimates & forecasts by segment 2020-2030 (USD Billion)
- TABLE 50. South Korea Digital Power Utility Market estimates & forecasts by segment 2020-2030 (USD Billion)
- TABLE 51. Australia Digital Power Utility Market estimates & forecasts, 2020-2030 (USD Billion)
- TABLE 52. Australia Digital Power Utility Market estimates & forecasts by segment 2020-2030 (USD Billion)
- TABLE 53. Australia Digital Power Utility Market estimates & forecasts by segment 2020-2030 (USD Billion)
- TABLE 54. RoAPAC Digital Power Utility Market estimates & forecasts, 2020-2030 (USD Billion)
- TABLE 55. RoAPAC Digital Power Utility Market estimates & forecasts by segment 2020-2030 (USD Billion)
- TABLE 56. RoAPAC Digital Power Utility Market estimates & forecasts by segment 2020-2030 (USD Billion)
- TABLE 57. Brazil Digital Power Utility Market estimates & forecasts, 2020-2030 (USD Billion)
- TABLE 58. Brazil Digital Power Utility Market estimates & forecasts by segment 2020-2030 (USD Billion)
- TABLE 59. Brazil Digital Power Utility Market estimates & forecasts by segment 2020-2030 (USD Billion)
- TABLE 60. Mexico Digital Power Utility Market estimates & forecasts, 2020-2030 (USD Billion)
- TABLE 61. Mexico Digital Power Utility Market estimates & forecasts by segment 2020-2030 (USD Billion)
- TABLE 62. Mexico Digital Power Utility Market estimates & forecasts by segment 2020-2030 (USD Billion)
- TABLE 63. RoLA Digital Power Utility Market estimates & forecasts, 2020-2030 (USD Billion)
- TABLE 64. RoLA Digital Power Utility Market estimates & forecasts by segment 2020-2030 (USD Billion)
- TABLE 65. RoLA Digital Power Utility Market estimates & forecasts by segment 2020-2030 (USD Billion)
- TABLE 66. Saudi Arabia Digital Power Utility Market estimates & forecasts, 2020-2030 (USD Billion)
- TABLE 67. South Africa Digital Power Utility Market estimates & forecasts by segment 2020-2030 (USD Billion)
- TABLE 68. RoMEA Digital Power Utility Market estimates & forecasts by segment 2020-2030 (USD Billion)
- TABLE 69. List of secondary sources, used in the study of global Digital Power Utility Market
- TABLE 70. List of primary sources, used in the study of global Digital Power Utility Market
- TABLE 71. Years considered for the study
- TABLE 72. Exchange rates considered
List of tables and figures and dummy in nature, final lists may vary in the final deliverable
LIST OF FIGURES
- FIG 1. Global Digital Power Utility Market, research methodology
- FIG 2. Global Digital Power Utility Market, Market estimation techniques
- FIG 3. Global Market size estimates & forecast methods
- FIG 4. Global Digital Power Utility Market, key trends 2022
- FIG 5. Global Digital Power Utility Market, growth prospects 2023-2030
- FIG 6. Global Digital Power Utility Market, porters 5 force model
- FIG 7. Global Digital Power Utility Market, pest analysis
- FIG 8. Global Digital Power Utility Market, value chain analysis
- FIG 9. Global Digital Power Utility Market by segment, 2020 & 2030 (USD Billion)
- FIG 10. Global Digital Power Utility Market by segment, 2020 & 2030 (USD Billion)
- FIG 11. Global Digital Power Utility Market by segment, 2020 & 2030 (USD Billion)
- FIG 12. Global Digital Power Utility Market by segment, 2020 & 2030 (USD Billion)
- FIG 13. Global Digital Power Utility Market by segment, 2020 & 2030 (USD Billion)
- FIG 14. Global Digital Power Utility Market, regional snapshot 2020 & 2030
- FIG 15. North America Digital Power Utility Market 2020 & 2030 (USD Billion)
- FIG 16. Europe Digital Power Utility Market 2020 & 2030 (USD Billion)
- FIG 17. Asia pacific Digital Power Utility Market 2020 & 2030 (USD Billion)
- FIG 18. Latin America Digital Power Utility Market 2020 & 2030 (USD Billion)
- FIG 19. Middle East & Africa Digital Power Utility Market 2020 & 2030 (USD Billion)
List of tables and figures and dummy in nature, final lists may vary in the final deliverable


