


 |
市场调查报告书
商品编码
1392131
备用电源市场:按类型、按应用、按最终用户、按地区Backup Power Market, By Type (Diesel generators, Gas generators, Solar generators, Others ), By Application, By End-user, By Geography |
||||||
全球备用电源市场规模预计将从2023年的26.6亿美元成长到2030年的43.3亿美元,预测期间(2023-2030年)复合年增长率为7.2%。
| 报告范围 | 报告详情 | ||
|---|---|---|---|
| 基准年 | 2022年 | 2023年市场规模 | 26.6亿美元 |
| 实绩资料 | 2018-2021 | 预测期 | 2023-2030 |
| 预测期复合年增长率 | 7.20% | 2030年市场规模预测 | 43.3亿美元 |
备用电源被定义为提供瞬时、不断电系统的设备。这是一种在输入电源或主电源故障时向负载提供紧急电源的电气装置。最有效的备用电源计划是固定发电机,交流负载、电器产品和基本照明通过它运作。如果主电源故障,则由备用电源系统提供电力。所有业务都依赖不断电系统,因此备用电源必不可少。
市场动态:
与天气相关的灾害强度/频率不断增加、全球停电次数不断增加、备用电源需求不断增加、不断电系统需求不断增加以及有利的政府倡议将促进预测期内全球备用电源市场的增长这是我们预计会看到的一些主要因素。
备用电源市场受到多种因素的推动,包括资料中心、医院和工业设施等关键应用对可靠电源的需求不断增长。此外,随着太阳能光伏发电和风能等再生能源来源的使用不断增加,对备用电力系统的需求也在增加,以确保在可再生能源发电低或无发电期间的供电连续性。
推动备用电源市场成长的其他因素包括飓风、地震和野火等自然灾害的频率和严重程度不断增加,这些灾害可能导致停电和电力中断。此外,许多国家老化的电力基础设施导致停电风险增加,推动了备用电力系统的需求。
本研究的主要特点
- 本报告对全球备用电源市场进行了详细分析,并提供了以2021年为基准年的预测期(2022-2030年)的市场规模和年复合成长率(CAGR%)。
- 它还揭示了各个细分市场的潜在商机,并为该市场说明了一系列有吸引力的投资提案。
- 它还提供了有关市场驱动因素、抑制因素、机会、新产品发布和核准、市场趋势、区域前景、主要企业采取的竞争策略等的重要考察。
- 它根据以下参数(例如公司亮点、产品系列、主要亮点、财务实绩和策略)对全球备用电源市场的主要企业进行了介绍。
- 该报告的见解使行销人员和公司负责人能够就未来的经营团队发布、类型升级、市场扩张和行销策略做出明智的资讯。
- 全球备用电源市场报告迎合了该行业的各种相关人员,如投资者、供应商、产品製造商、经销商、新进业者和财务分析师。
- 透过分析全球备用电源市场时所使用的各种策略矩阵,将有助于相关人员做出决策。
目录:
第1章研究目的与前提
- 研究目标
- 假设
- 简称
第2章市场展望
- 报告说明
- 市场定义和范围
- 执行摘要
- Coherent Opportunity Map(COM)
第3章市场动态、法规及趋势分析
- 市场动态
- 影响分析
- 主要亮点
- 监管场景
- 产品发布/核准
- PEST分析
- 波特的分析
- 併购场景
第4章备用电源市场-冠状病毒(COVID-19)大流行的影响
- 新型冠状病毒感染疾病(COVID-19)的流行病学
- 供需面分析
- 经济影响
第5章2019-2030 年备用电源市场(按类型)
- 柴油发电机
- 气体发生器
- 太阳能发电机
- 其他的
第6章备用电源市场,依应用划分,2019-2030
- 储备电源
- 主电源
- 调峰
第7章备用电源市场,按最终用户划分,2019-2030 年
- 住宅
- 商业的
- 工业
- 其他的
第8章2019-2030 年备用电源市场(按地区)
- 北美洲
- 美国
- 加拿大
- 欧洲
- 德国
- 英国
- 西班牙
- 法国
- 义大利
- 俄罗斯
- 其他欧洲国家
- 亚太地区
- 中国
- 印度
- 日本
- 澳洲
- 韩国
- ASEAN
- 其他亚太地区
- 拉丁美洲
- 巴西
- 阿根廷
- 墨西哥
- 其他拉丁美洲
- 中东和非洲
- 海湾合作委员会国家
- 以色列
- 南非
- 北非
- 中部非洲
- 其他中东地区
第9章竞争形势
- Doosan Corporation
- Yanmar Co. Ltd.
- Wartsila Corporation
- Aggreko plc
- Eaton Corporation
- Schneider Electric SE
- Atlas Copco AB
- Himoinsa SL
- Kohler Co.
- Cummins Inc.
- Caterpillar Inc.
- Mitsubishi Heavy Industries Ltd.
- Generac Power Systems Inc.
- Briggs & Stratton Corporation
- MTU Onsite Energy Corporation
第10章章
- 调查方法
- 关于出版商
The Global Backup Power Market size is expected to grow from US$ 2.66 billion in 2023 to US$ 4.33 billion by 2030, at a CAGR of 7.2% during the forecast period (2023-2030).
| Report Coverage | Report Details | ||
|---|---|---|---|
| Base Year: | 2022 | Market Size in 2023: | US$ 2.66 Bn |
| Historical Data for: | 2018 to 2021 | Forecast Period: | 2023 - 2030 |
| Forecast Period 2023 to 2030 CAGR: | 7.20% | 2030 Value Projection: | US$ 4.33 Bn |
Backup power is defined as any device that provides instantaneous, uninterruptible power. It is an electrical apparatus that provides emergency power to a load when the input power source or mains power fails. The most efficient power backup plan is the fixed generator through which AC loads, electrical appliances, and essential lights can work. When the main source of energy fails, a backup power system is employed to supply electricity. It is essential since every operation depends on an uninterruptible power source.
Market Dynamics:
Increasing intensity/frequency of weather-related disasters, increase in power outages worldwide, rising demand for standby power sources, increasing demand for uninterrupted power supply, and favorable government initiatives are some major factors expected to augment the growth of the global backup power market during the forecast period.
The market for backup power is driven by a number of factors, including the increasing demand for reliable power supply in critical applications such as data centers, hospitals, and industrial facilities. In addition, the growing use of renewable energy sources such as solar and wind power has increased the need for backup power systems to ensure continuity of power supply during periods of low or no renewable energy generation.
Other factors driving the growth of the backup power market include the increasing frequency and severity of natural disasters such as hurricanes, earthquakes, and wildfires, which can cause power outages and disruptions. In addition, the aging power infrastructure in many countries is leading to an increased risk of power outages, which is driving demand for backup power systems.
Key features of the study:
- This report provides an in-depth analysis of the global backup power market, and provides market size (US$ Bn) and compound annual growth rate (CAGR %) for the forecast period (2022-2030), considering 2021 as the base year.
- It elucidates potential revenue opportunities across different segments and explains attractive investment proposition matrices for this market.
- This study also provides key insights about market drivers, restraints, opportunities, new product launches or approval, market trends, regional outlook, and competitive strategies adopted by key players.
- It profiles key players in the global backup power market based on the following parameters such as company highlights, products portfolio, key highlights, financial performance, and strategies.
- Key companies covered as a part of this study include Doosan Corporation, Yanmar Co. Ltd., Wartsila Corporation, Aggreko plc, Eaton Corporation, Schneider Electric SE, Atlas Copco AB, Himoinsa S.L., Kohler Co., Cummins Inc., Caterpillar Inc., Mitsubishi Heavy Industries Ltd., Generac Power Systems Inc., Briggs & Stratton Corporation, and MTU Onsite Energy Corporation, among others.
- Insights from this report would allow marketers and the management authorities of the companies to make informed decisions regarding their future product launches, type up-gradation, market expansion, and marketing tactics.
- The global backup power market report caters to various stakeholders in this industry including investors, suppliers, product manufacturers, distributors, new entrants, and financial analysts.
- Stakeholders would have ease in decision-making through various strategy matrices used in analyzing the global backup power market.
Backup Power Market Detailed Segmentation:
- By Type:
- Diesel Generators
- Gas Generators
- Solar Generators
- Others
- By Application:
- Standby Power
- Prime Power
- Peak Shaving
- By End User:
- Residential
- Commercial
- Industrial
- Others
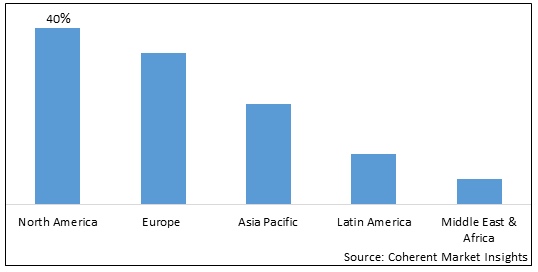
- By Region:
- North America
- Europe
- Asia Pacific
- Latin America
- Middle East and Africa
- Company Profiles:
- Doosan Corporation
- Yanmar Co. Ltd.
- Wartsila Corporation
- Aggreko plc
- Eaton Corporation
- Schneider Electric SE
- Atlas Copco AB
- Himoinsa S.L.
- Kohler Co.
- Cummins Inc.
- Caterpillar Inc.
- Mitsubishi Heavy Industries Ltd.
- Generac Power Systems Inc.
- Briggs & Stratton Corporation
- MTU Onsite Energy Corporation
Table of Contents:
1. Research Objectives and Assumptions
- Research Objectives
- Assumptions
- Abbreviations
2. Market Purview
- Report Description
- Market Definition and Scope
- Executive Summary
- Backup Power Market, By Type
- Backup Power Market, By Application
- Backup Power Market, By End User
- Backup Power Market, By Region
- Coherent Opportunity Map (COM)
3. Market Dynamics, Regulations, and Trends Analysis
- Market Dynamics
- Increase in power outages around the world
- Increasing adoption of renewable power sources
- Growing demand for uninterrupted power supply
- Impact Analysis
- Key Highlights
- Regulatory Scenario
- Product launch/Approvals
- PEST Analysis
- PORTER's Analysis
- Merger and Acquisition Scenario
4. Backup Power Market - Impact of Coronavirus (COVID-19) Pandemic
- COVID-19 Epidemiology
- Supply Side and Demand Side Analysis
- Economic Impact
5. Backup Power Market, By Type, 2019-2030, (US$ Bn)
- Introduction
- Market Share Analysis, 2023 and 2030 (%)
- Y-o-Y Growth Analysis, 2019 - 2030
- Segment Trends
- Diesel Generators
- Introduction
- Market Size and Forecast, and Y-o-Y Growth, 2019-2030, (US$ Bn)
- Gas Generators
- Introduction
- Market Size and Forecast, and Y-o-Y Growth, 2019-2030, (US$ Bn)
- Solar Generators
- Introduction
- Market Size and Forecast, and Y-o-Y Growth, 2019-2030, (US$ Bn)
- Others
- Introduction
- Market Size and Forecast, and Y-o-Y Growth, 2019-2030, (US$ Bn)
6. Backup Power Market, By Application, 2019-2030, (US$ Bn)
- Introduction
- Market Share Analysis, 2022 and 2030 (%)
- Y-o-Y Growth Analysis, 2023 - 2030
- Segment Trends
- Standby Power
- Introduction
- Market Size and Forecast, and Y-o-Y Growth, 2019-2030, (US$ Bn)
- Prime Power
- Introduction
- Market Size and Forecast, and Y-o-Y Growth, 2019-2030, (US$ Bn)
- Peak Shaving
- Introduction
- Market Size and Forecast, and Y-o-Y Growth, 2019-2030, (US$ Bn)
7. Backup Power Market, By End User, 2019-2030, (US$ Bn)
- Introduction
- Market Share Analysis, 2022 and 2030 (%)
- Y-o-Y Growth Analysis, 2023 - 2030
- Segment Trends
- Residential
- Introduction
- Market Size and Forecast, and Y-o-Y Growth, 2019-2030, (US$ Bn)
- Commercial
- Introduction
- Market Size and Forecast, and Y-o-Y Growth, 2019-2030, (US$ Bn)
- Industrial
- Introduction
- Market Size and Forecast, and Y-o-Y Growth, 2019-2030, (US$ Bn)
- Others
- Introduction
- Market Size and Forecast, and Y-o-Y Growth, 2019-2030, (US$ Bn)
8. Backup Power Market, By Region, 2019-2030, (US$ Bn)
- Introduction
- Market Share Analysis, 2022 and 2030 (%)
- Y-o-Y Growth Analysis, 2023 - 2030
- Segment Trends
- North America
- Introduction
- Market Size and Forecast, and Y-o-Y Growth, By Type, 2019-2030, (US$ Bn)
- Market Size and Forecast, and Y-o-Y Growth, By Application, 2019-2030, (US$ Bn)
- Market Size and Forecast, and Y-o-Y Growth, By End User, 2019-2030, (US$ Bn)
- Market Size and Forecast, and Y-o-Y Growth, By Country, 2018-2030,(US$ Bn)
- U.S.
- Canada
- Europe
- Introduction
- Market Size and Forecast, and Y-o-Y Growth, By Type, 2019-2030, (US$ Bn)
- Market Size and Forecast, and Y-o-Y Growth, By Application, 2019-2030, (US$ Bn)
- Market Size and Forecast, and Y-o-Y Growth, By End User, 2019-2030, (US$ Bn)
- Market Size and Forecast, and Y-o-Y Growth, By Country, 2018 - 2030, (US$ Bn)
- Germany
- U.K
- Spain
- France
- Italy
- Russia
- Rest of Europe
- Asia Pacific
- Introduction
- Market Size and Forecast, and Y-o-Y Growth, By Type, 2019-2030, (US$ Bn)
- Market Size and Forecast, and Y-o-Y Growth, By Application, 2019-2030, (US$ Bn)
- Market Size and Forecast, and Y-o-Y Growth, By End User, 2019-2030, (US$ Bn)
- Market Size and Forecast, and Y-o-Y Growth, By Country, 2018 - 2030, (US$ Bn)
- China
- India
- Japan
- Australia
- South Korea
- ASEAN
- Rest of Asia Pacific
- Latin America
- Introduction
- Market Size and Forecast, and Y-o-Y Growth, By Type, 2019-2030, (US$ Bn)
- Market Size and Forecast, and Y-o-Y Growth, By Application, 2019-2030, (US$ Bn)
- Market Size and Forecast, and Y-o-Y Growth, By End User, 2019-2030, (US$ Bn)
- Market Size and Forecast, and Y-o-Y Growth, By Country, 2018 - 2030, (US$ Bn)
- Brazil
- Argentina
- Mexico
- Rest of Latin America
- Middle East & Africa
- Introduction
- Market Size and Forecast, and Y-o-Y Growth, By Type, 2019-2030, (US$ Bn)
- Market Size and Forecast, and Y-o-Y Growth, By Application, 2019-2030, (US$ Bn)
- Market Size and Forecast, and Y-o-Y Growth, By End User, 2019-2030, (US$ Bn)
- Market Size and Forecast, and Y-o-Y Growth, By Country, 2018 - 2030, (US$ Bn)
- GCC Countries
- Israel
- South Africa
- North Africa
- Central Africa
- Rest of Middle East
9. Competitive Landscape
- Doosan Corporation
- Company Highlights
- Product Portfolio
- Key Developments
- Financial Performance
- Strategies
- Yanmar Co. Ltd.
- Company Highlights
- Product Portfolio
- Key Developments
- Financial Performance
- Strategies
- Wartsila Corporation
- Company Highlights
- Product Portfolio
- Key Developments
- Financial Performance
- Strategies
- Aggreko plc
- Company Highlights
- Product Portfolio
- Key Developments
- Financial Performance
- Strategies
- Eaton Corporation
- Company Highlights
- Product Portfolio
- Key Developments
- Financial Performance
- Strategies
- Schneider Electric SE
- Company Highlights
- Product Portfolio
- Key Developments
- Financial Performance
- Strategies
- Atlas Copco AB
- Company Highlights
- Product Portfolio
- Key Developments
- Financial Performance
- Strategies
- Himoinsa S.L.
- Company Highlights
- Product Portfolio
- Key Developments
- Financial Performance
- Strategies
- Kohler Co.
- Company Highlights
- Product Portfolio
- Key Developments
- Financial Performance
- Strategies
- Cummins Inc.
- Company Highlights
- Product Portfolio
- Key Developments
- Financial Performance
- Strategies
- Caterpillar Inc.
- Company Highlights
- Product Portfolio
- Key Developments
- Financial Performance
- Strategies
- Mitsubishi Heavy Industries Ltd.
- Company Highlights
- Product Portfolio
- Key Developments
- Financial Performance
- Strategies
- Generac Power Systems Inc.
- Company Highlights
- Product Portfolio
- Key Developments
- Financial Performance
- Strategies
- Briggs & Stratton Corporation
- Company Highlights
- Product Portfolio
- Key Developments
- Financial Performance
- Strategies
- MTU Onsite Energy Corporation
- Company Highlights
- Product Portfolio
- Key Developments
- Financial Performance
- Strategies
- Analyst Views
10. Section
- Research Methodology
- About us
 住宅备用电源市场规模、份额、成长分析,按发电技术、能源储存技术、按最终用户、按应用、按地区 - 行业预测,2025 年至 2032 年
 备用电源系统-市场占有率分析、产业趋势与统计、成长预测(2025-2030 年)
 备用电源系统市场:按技术、应用和最终用户划分 - 2025-2030 年全球预测到 2030 年备用电源系统市场预测:按类型、燃料类型、额定功率、技术、应用、最终用户和地区进行的全球分析
 2024-2028年全球住宅备用电源市场
 全球备用电源系统市场规模研究与预测,按技术(备用发电机、不间断电源 (UPS))、最终用户(住宅、商业、工业)和区域分析,2023-2030 年
 备用电源市场报告:2030 年趋势、预测与竞争分析