


 |
市场调查报告书
商品编码
1699465
按显示类型、应用程式和地区分類的数位互动服务市场Digital Interactive Service Market, By Display Type, By Application, By Geography |
||||||
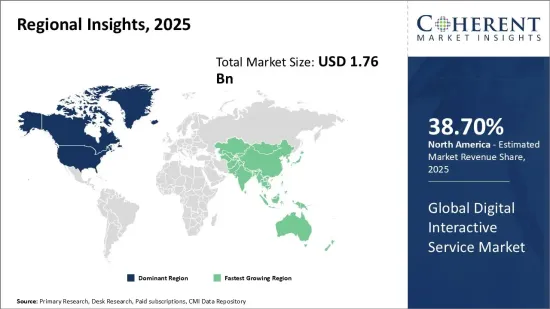
预计 2025 年全球数位互动服务市场规模将达到 17.6 亿美元,到 2032 年将达到 26.8 亿美元,2025 年至 2032 年的年复合成长率(CAGR)为 6.2%。
| 报告范围 | 报告详细信息 | ||
|---|---|---|---|
| 基准年 | 2024 | 2025年的市场规模 | 17.6亿美元 |
| 效能数据 | 从2020年到2024年 | 预测期 | 2025年至2032年 |
| 预测期:2025-2032年复合年增长率: | 6.20% | 2032年价值预测 | 26.8亿美元 |
各行各业的数位化和自动化趋势正在推动透过数位平台提供的互动式服务的采用率不断提高。我们的互动服务让您能够进行互动交流并获得客製化的个人化体验。人工智慧、物联网、云端和分析等技术的进步使服务供应商能够为用户提供高度客製化和引人入胜的数位体验。网路和智慧型手机普及率的提高以及消费者对数位和自动化服务的偏好的改变是推动全球数位互动服务市场向前发展的一些关键因素。然而,与数位资料的收集和使用相关的安全和隐私问题可能会在一定程度上抑制市场成长。
市场动态:
推动全球数位互动服务市场成长的关键因素包括各行业数位化和自动化趋势的不断增长、互联网和智慧型手机普及率的提高以及消费者对数位服务的偏好的改变。然而,与数位资料的收集和使用相关的资料隐私和安全问题给市场带来了重大挑战。然而,人工智慧、区块链、扩增实境(AR) 和虚拟实境 (VR) 等新兴技术的发展预计将在未来几年为服务供应商创造新的机会。教育、医疗保健、电子商务、BFSI、製造、媒体和娱乐等领域对数位互动式服务的采用正在增加。基于视讯和音讯的互动式工具的日益普及也推动了市场的成长。然而,这些服务的高实施和维护成本是一个障碍,尤其是在新兴市场。
本研究的主要特点
本报告对全球数位互动服务市场进行了详细分析,并以 2024 年为基准年,展示了预测期(2025-2032 年)的市场规模和年复合成长率(CAGR%)。
它还强调了各个领域的潜在商机,并说明了该市场的有吸引力的投资提案矩阵。
它还提供了有关市场驱动因素、限制因素、机会、新产品发布和核准、市场趋势、区域前景和主要企业采用的竞争策略的重要见解。
全球数位互动服务市场的主要企业是根据公司亮点、产品系列、关键亮点、绩效和策略等参数进行的分析。
主要企业包括三星电子、LG 电子、微软公司、Google有限责任公司、夏普公司、明基电通公司、Elo Touch Solutions、NEC Display Solutions、优派公司、SMART Technologies、Promethean World、富视觉公司、松下公司、思科系统公司和宏碁公司。
本报告的见解将使负责人和公司经营团队能够就未来的产品发布、类型升级、市场扩张和行销策略做出明智的决策。
本研究报告针对该产业的各个相关人员,包括投资者、供应商、产品製造商、经销商、新进业者和财务分析师。
相关人员可以透过用于分析全球数位互动服务市场的各种策略矩阵更轻鬆地做出决策。
目录
第一章 调查目的与前提条件
- 研究目标
- 先决条件
- 简称
第二章 市场展望
- 报告描述
- 市场定义和范围
- 执行摘要
第三章市场动态、法规与趋势分析
- 市场动态
- 影响分析
- 主要亮点
- 监管情景
- 产品发布/核准
- PEST分析
- 波特分析
- 市场机会
- 监管情景
- 主要进展
- 产业趋势
4. 2020 年至 2032 年全球数位互动服务市场(按显示类型)
- 互动式自助服务终端
- 互动式电视墙
- 互动桌
- 互动式监视器
- 互动式白板
5. 2020 年至 2032 年全球数位互动服务市场(按应用划分)
- 零售
- 饭店业
- 卫生保健
- 运输
- 银行、金融服务和保险(BFSI)
- 企业
- 娱乐
- 教育
6. 2020 年至 2032 年全球数位互动服务市场(按地区)
- 北美洲
- 拉丁美洲
- 欧洲
- 亚太地区
- 中东
- 非洲
第七章竞争格局
- Samsung Electronics
- LG Electronics
- Microsoft Corporation
- Google LLC
- Sharp Corporation
- BenQ Corporation
- Elo Touch Solutions
- NEC Display Solutions
- ViewSonic Corporation
- SMART Technologies
- Promethean World
- InFocus Corporation
- Panasonic Corporation
- Cisco Systems, Inc.
- Acer Inc.
第 8 章分析师建议
- 命运之轮
- 分析师观点
- 一致的机会图
第九章参考文献与调查方法
- 参考
- 调查方法
- 关于出版商
Global Digital Interactive Service Market is estimated to be valued at US$ 1.76 Bn in 2025 and is expected to reach US$ 2.68 Bn by 2032, growing at a compound annual growth rate (CAGR) of 6.2% from 2025 to 2032.
| Report Coverage | Report Details | ||
|---|---|---|---|
| Base Year: | 2024 | Market Size in 2025: | USD 1.76 Bn |
| Historical Data for: | 2020 To 2024 | Forecast Period: | 2025 To 2032 |
| Forecast Period 2025 to 2032 CAGR: | 6.20% | 2032 Value Projection: | USD 2.68 Bn |
Digitalization and automation trends across various industry verticals have increased the adoption of interactive services which are offered through digital platforms. Interactive services allow users to engage in two-way communication and receive customized and personalized experience. Advancements in technologies, such as AI, IoT, cloud, and analytics, have enabled service providers to offer highly customized and engaging digital experiences to users. The growth of internet and smartphone penetration coupled with changing consumer preferences for digital and automated services are some of the key factors driving the global digital interactive service market forward. However, security and privacy concerns associated with digital data collection and usage may restrain the market growth to a certain extent.
Market Dynamics:
The key drivers propelling the growth of the global digital interactive service market include growing digitization and automation trends across industries, rising internet and smartphone penetration, and changing consumer preferences towards digital services. However, data privacy and security concerns associated with digital data collection and usage pose as major challenges for the market. But development of advanced technologies such as AI, Blockchain, augmented reality, and virtual reality are expected to create new opportunities for service providers in the coming years. Adoption of digital interactive services is increasing across sectors like education, healthcare, e-commerce, BFSI, manufacturing, media, and entertainment, among others. Rising popularity of video and audio based interactive tools is another factor boosting the market growth. However, high implementation and maintenance costs associated with these services hamper the market particularly in under developed regions.
Key Features of the Study:
This report provides in-depth analysis of the global digital interactive service market, and provides market size (US$ Billion) and compound annual growth rate (CAGR%) for the forecast period (2025-2032), considering 2024 as the base year
It elucidates potential revenue opportunities across different segments and explains attractive investment proposition matrices for this market
This study also provides key insights about market drivers, restraints, opportunities, new product launches or approvals, market trends, regional outlook, and competitive strategies adopted by key players
It profiles key players in the global digital interactive service market based on the following parameters - company highlights, products portfolio, key highlights, financial performance, and strategies
Key companies covered as a part of this study include Samsung Electronics, LG Electronics, Microsoft Corporation, Google LLC, Sharp Corporation, BenQ Corporation, Elo Touch Solutions, NEC Display Solutions, ViewSonic Corporation, SMART Technologies, Promethean World, InFocus Corporation, Panasonic Corporation, Cisco Systems, Inc., and Acer Inc.
Insights from this report would allow marketers and the management authorities of the companies to make informed decisions regarding their future product launches, type up-gradation, market expansion, and marketing tactics
The global digital interactive service market report caters to various stakeholders in this industry including investors, suppliers, product manufacturers, distributors, new entrants, and financial analysts
Stakeholders would have ease in decision-making through various strategy matrices used in analyzing the global digital interactive service market
Market Segmentation
- Display Type Insights (Revenue, USD Bn, 2020 - 2032)
- Interactive Kiosk
- Interactive Video Wall
- Interactive Table
- Interactive Monitor
- Interactive Whiteboard
- Application Insights (Revenue, USD Bn, 2020 - 2032)
- Retail
- Hospitality
- Healthcare
- Transportation
- Banking, Financial Services, and Insurance (BFSI)
- Corporate
- Entertainment
- Education
- Regional Insights (Revenue, USD Bn, 2020 - 2032)
- North America
- U.S.
- Canada
- Latin America
- Brazil
- Argentina
- Mexico
- Rest of Latin America
- Europe
- Germany
- U.K.
- Spain
- France
- Italy
- Russia
- Rest of Europe
- Asia Pacific
- China
- India
- Japan
- Australia
- South Korea
- ASEAN
- Rest of Asia Pacific
- Middle East
- GCC Countries
- Israel
- Rest of Middle East
- Africa
- South Africa
- North Africa
- Central Africa
- Key Players Insights
- Samsung Electronics
- LG Electronics
- Microsoft Corporation
- Google LLC
- Sharp Corporation
- BenQ Corporation
- Elo Touch Solutions
- NEC Display Solutions
- ViewSonic Corporation
- SMART Technologies
- Promethean World
- InFocus Corporation
- Panasonic Corporation
- Cisco Systems, Inc.
- Acer Inc.
Table of Contents
1. Research Objectives and Assumptions
- Research Objectives
- Assumptions
- Abbreviations
2. Market Purview
- Report Description
- Market Definition and Scope
- Executive Summary
- Global Digital Interactive Service Market, By Display Type
- Global Digital Interactive Service Market, By Application
- Global Digital Interactive Service Market, By Region
3. Market Dynamics, Regulations, and Trends Analysis
- Market Dynamics
- Impact Analysis
- Key Highlights
- Regulatory Scenario
- Product Launches/Approvals
- PEST Analysis
- PORTER's Analysis
- Market Opportunities
- Regulatory Scenario
- Key Developments
- Industry Trends
4. Global Digital Interactive Service Market, By Display Type, 2020-2032, (USD Bn)
- Introduction
- Market Share Analysis, 2025 and 2032 (%)
- Y-o-Y Growth Analysis, 2021 - 2032
- Segment Trends
- Interactive Kiosk
- Introduction
- Market Size and Forecast, and Y-o-Y Growth, 2020-2032, (USD Bn)
- Interactive Video Wall
- Introduction
- Market Size and Forecast, and Y-o-Y Growth, 2020-2032, (USD Bn)
- Interactive Table
- Introduction
- Market Size and Forecast, and Y-o-Y Growth, 2020-2032, (USD Bn)
- Interactive Monitor
- Introduction
- Market Size and Forecast, and Y-o-Y Growth, 2020-2032, (USD Bn)
- Interactive Whiteboard
- Introduction
- Market Size and Forecast, and Y-o-Y Growth, 2020-2032, (USD Bn)
5. Global Digital Interactive Service Market, By Application, 2020-2032, (USD Bn)
- Introduction
- Market Share Analysis, 2025 and 2032 (%)
- Y-o-Y Growth Analysis, 2021 - 2032
- Segment Trends
- Retail
- Introduction
- Market Size and Forecast, and Y-o-Y Growth, 2020-2032, (USD Bn)
- Hospitality
- Introduction
- Market Size and Forecast, and Y-o-Y Growth, 2020-2032, (USD Bn)
- Healthcare
- Introduction
- Market Size and Forecast, and Y-o-Y Growth, 2020-2032, (USD Bn)
- Transportation
- Introduction
- Market Size and Forecast, and Y-o-Y Growth, 2020-2032, (USD Bn)
- Banking, Financial Services, and Insurance (BFSI)
- Introduction
- Market Size and Forecast, and Y-o-Y Growth, 2020-2032, (USD Bn)
- Corporate
- Introduction
- Market Size and Forecast, and Y-o-Y Growth, 2020-2032, (USD Bn)
- Entertainment
- Introduction
- Market Size and Forecast, and Y-o-Y Growth, 2020-2032, (USD Bn)
- Education
- Introduction
- Market Size and Forecast, and Y-o-Y Growth, 2020-2032, (USD Bn)
6. Global Digital Interactive Service Market, By Region, 2020 - 2032, Value (USD Bn)
- Introduction
- Market Share (%) Analysis, 2025,2028 & 2032, Value (USD Bn)
- Market Y-o-Y Growth Analysis (%), 2021 - 2032, Value (USD Bn)
- Regional Trends
- North America
- Introduction
- Market Size and Forecast, By Display Type, 2020 - 2032, Value (USD Bn)
- Market Size and Forecast, By Application, 2020 - 2032, Value (USD Bn)
- Market Size and Forecast, By Country, 2020 - 2032, Value (USD Bn)
- U.S.
- Canada
- Latin America
- Introduction
- Market Size and Forecast, By Display Type, 2020 - 2032, Value (USD Bn)
- Market Size and Forecast, By Application, 2020 - 2032, Value (USD Bn)
- Market Size and Forecast, By Country, 2020 - 2032, Value (USD Bn)
- Brazil
- Argentina
- Mexico
- Rest of Latin America
- Europe
- Introduction
- Market Size and Forecast, By Display Type, 2020 - 2032, Value (USD Bn)
- Market Size and Forecast, By Application, 2020 - 2032, Value (USD Bn)
- Market Size and Forecast, By Country, 2020 - 2032, Value (USD Bn)
- Germany
- U.K.
- Spain
- France
- Italy
- Russia
- Rest of Europe
- Asia Pacific
- Introduction
- Market Size and Forecast, By Display Type, 2020 - 2032, Value (USD Bn)
- Market Size and Forecast, By Application, 2020 - 2032, Value (USD Bn)
- Market Size and Forecast, By Country, 2020 - 2032, Value (USD Bn)
- China
- India
- Japan
- Australia
- South Korea
- ASEAN
- Rest of Asia Pacific
- Middle East
- Introduction
- Market Size and Forecast, By Display Type, 2020 - 2032, Value (USD Bn)
- Market Size and Forecast, By Application, 2020 - 2032, Value (USD Bn)
- Market Size and Forecast, By Country, 2020 - 2032, Value (USD Bn)
- GCC Countries
- Israel
- Rest of Middle East
- Africa
- Introduction
- Market Size and Forecast, By Display Type, 2020 - 2032, Value (USD Bn)
- Market Size and Forecast, By Application, 2020 - 2032, Value (USD Bn)
- Market Size and Forecast, By Country/Region, 2020 - 2032, Value (USD Bn)
- South Africa
- North Africa
- Central Africa
7. Competitive Landscape
- Samsung Electronics
- Company Highlights
- Product Portfolio
- Key Developments
- Financial Performance
- Strategies
- LG Electronics
- Company Highlights
- Product Portfolio
- Key Developments
- Financial Performance
- Strategies
- Microsoft Corporation
- Company Highlights
- Product Portfolio
- Key Developments
- Financial Performance
- Strategies
- Google LLC
- Company Highlights
- Product Portfolio
- Key Developments
- Financial Performance
- Strategies
- Sharp Corporation
- Company Highlights
- Product Portfolio
- Key Developments
- Financial Performance
- Strategies
- BenQ Corporation
- Company Highlights
- Product Portfolio
- Key Developments
- Financial Performance
- Strategies
- Elo Touch Solutions
- Company Highlights
- Product Portfolio
- Key Developments
- Financial Performance
- Strategies
- NEC Display Solutions
- Company Highlights
- Product Portfolio
- Key Developments
- Financial Performance
- Strategies
- ViewSonic Corporation
- Company Highlights
- Product Portfolio
- Key Developments
- Financial Performance
- Strategies
- SMART Technologies
- Company Highlights
- Product Portfolio
- Key Developments
- Financial Performance
- Strategies
- Promethean World
- Company Highlights
- Product Portfolio
- Key Developments
- Financial Performance
- Strategies
- InFocus Corporation
- Company Highlights
- Product Portfolio
- Key Developments
- Financial Performance
- Strategies
- Panasonic Corporation
- Company Highlights
- Product Portfolio
- Key Developments
- Financial Performance
- Strategies
- Cisco Systems, Inc.
- Company Highlights
- Product Portfolio
- Key Developments
- Financial Performance
- Strategies
- Acer Inc.
- Company Highlights
- Product Portfolio
- Key Developments
- Financial Performance
- Strategies
8. Analyst Recommendations
- Wheel of Fortune
- Analyst View
- Coherent Opportunity Map
9. References and Research Methodology
- References
- Research Methodology
- About us
