


 |
市场调查报告书
商品编码
1729668
电视网络市场:依服务、收益模式和地区划分Television Network Market, By Service, By Revenue Model, By Geography |
||||||
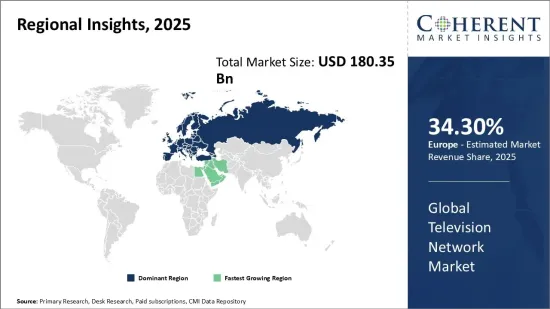
预计 2025 年全球电视网络市场规模将达到 1,803.5 亿美元,到 2032 年将达到 2,765.9 亿美元,2025 年至 2032 年的年复合成长率(CAGR)为 6.3%。
| 报告范围 | 报告详细信息 | ||
|---|---|---|---|
| 基准年 | 2024 | 2025年的市场规模 | 1803.5亿美元 |
| 效能数据 | 从2020年到2024年 | 预测期 | 2025年至2032年 |
| 预测期:2025-2032年复合年增长率: | 6.30% | 2032年价值预测 | 2765.9亿美元 |
过去几十年来,受娱乐和资讯内容需求不断增长的推动,全球电视网络市场稳步增长。电视是最受欢迎且消费范围最广的媒体之一,不仅对个人观众如此,对广告商也是如此。全球领先的广播公司继续大力投资开发高品质节目,同时扩展其分发基础设施,以便在多个平台和设备上提供内容。科技创新使得观众除了传统电视外,还可以透过任何萤幕(包括智慧型手机、平板电脑和笔记型电脑)观看直播电视和随选视讯。这导致全球媒体消费的增加。
市场动态:
全球电视网络市场的成长受到观众对多样化内容的强烈需求、全球互联网普及率的提高以及智慧互联设备的出现所推动。然而,由于观众越来越青睐线上串流媒体而非传统付费电视,有线电视用户「剪线」现像日益严重,加上数媒体播放机的竞争日益激烈,这些因素都有可能扰乱市场。同时,电视广播公司正在扩大其在Over-The-Top(OTT) 平台上的业务,并利用与通讯业者合作提供全面服务的机会。人工智慧、虚拟实境和区块链等领域的进步也为未来改善电视观看体验提供了潜力。
本研究的主要特点
本报告对全球电视网络市场进行了详细分析,并以 2024 年为基准年,给出了预测期(2025-2032 年)的市场规模和年复合成长率(CAGR%)。
它还强调了各个领域的潜在商机,并说明了该市场有吸引力的投资提案矩阵。
它还提供了有关市场驱动因素、限制因素、机会、新产品发布和核准、市场趋势、区域前景和主要企业采用的竞争策略的重要见解。
全球电视网络市场的主要企业是根据公司亮点、产品系列、关键亮点、财务绩效和策略等参数进行的分析。
本报告的见解将使负责人和公司经营团队能够就未来的产品发布、类型升级、市场扩张和行销策略做出明智的决策。
本研究报告针对该产业的各个相关人员,包括投资者、供应商、产品製造商、经销商、新进业者和财务分析师。
相关人员将透过用于分析全球电视网络市场的各种策略矩阵更轻鬆地做出决策。
目录
第一章 调查目的与前提条件
- 研究目标
- 先决条件
- 简称
第二章 市场展望
- 报告描述
- 市场定义和范围
- 执行摘要
第三章市场动态、法规与趋势分析
- 市场动态
- 影响分析
- 主要亮点
- 监管情景
- 产品发布/核准
- PEST分析
- 波特分析
- 市场机会
- 监管情景
- 主要进展
- 产业趋势
4. 2020-2032 年全球电视网络市场(按服务划分)
- 直接广播卫星(DBS)服务
- 有线电视和其他付费服务
- 订阅频道服务
- 卫星主天线系统服务(SMATV)
- 多点分布系统服务(MDS)
- 闭路电视(监视录影机)
5. 2020-2032 年全球电视网络市场收益模式
- 订阅
- 广告
6. 2020-2032 年全球电视网络市场(按地区)
- 北美洲
- 美国
- 加拿大
- 拉丁美洲
- 巴西
- 阿根廷
- 墨西哥
- 其他拉丁美洲
- 欧洲
- 德国
- 英国
- 西班牙
- 法国
- 义大利
- 俄罗斯
- 其他欧洲国家
- 亚太地区
- 中国
- 印度
- 日本
- 澳洲
- 韩国
- ASEAN
- 其他亚太地区
- 中东
- 海湾合作委员会国家
- 以色列
- 其他中东地区
- 非洲
- 南非
- 北非
- 中部非洲
第七章 竞争态势
- Samsung Electronics
- LG Display
- Sony Corporation
- Hisense Group
- Foxconn Technology Group
- Dixon Technologies
- Kathrein-Werke KG
- Comcast Corporation
- The Walt Disney Company
- Warner Bros. Discovery
- Netflix Inc.
- Paramount Global
- Apple Inc.
- AT&T Inc.
- Charter Communications
第 8 章分析师建议
- 命运之轮
- 分析师观点
- 一致的机会图
第九章参考文献与调查方法
- 参考
- 调查方法
- 关于出版商
Global Television Network Market is estimated to be valued at USD 180.35 Bn in 2025 and is expected to reach USD 276.59 Bn by 2032, growing at a compound annual growth rate (CAGR) of 6.3% from 2025 to 2032.
| Report Coverage | Report Details | ||
|---|---|---|---|
| Base Year: | 2024 | Market Size in 2025: | USD 180.35 Bn |
| Historical Data for: | 2020 To 2024 | Forecast Period: | 2025 To 2032 |
| Forecast Period 2025 to 2032 CAGR: | 6.30% | 2032 Value Projection: | USD 276.59 Bn |
The global television network market has been growing steadily over the past few decades driven by rising demand for entertainment and information content. Television remains one of the most popular and widely used media for both individual viewers as well as advertisers. Major broadcasters across the world continue to invest heavily in developing high quality programming as well as expanding their distribution infrastructure to deliver content across various platforms and devices. Innovation in technology has enabled viewers to access live television and on-demand video on any screen of their choice including smartphones, tablets, and laptops besides traditional television sets. This has boosted media consumption globally.
Market Dynamics:
The global television network market growth is driven by strong demand for diversified content from viewers, growing internet penetration worldwide, and advent of smart connected devices. However, factors such as rising cord-cutting trend wherein viewers prefer online streaming over conventional pay television and increasing competition from digital media players threatens to disrupt the market. Meanwhile, television broadcasters are capitalizing on opportunities to expand their over-the-top (OTT) platform presence and partnerships with telecom operators to deliver integrated services. Advancements in areas such as artificial intelligence, virtual reality and Blockchain also offer potential to enhance television viewing experience going forward.
Key Features of the Study:
This report provides in-depth analysis of the global television network market, and provides market size (US$ Billion) and compound annual growth rate (CAGR%) for the forecast period (2025-2032), considering 2024 as the base year
It elucidates potential revenue opportunities across different segments and explains attractive investment proposition matrices for this market
This study also provides key insights about market drivers, restraints, opportunities, new product launches or approvals, market trends, regional outlook, and competitive strategies adopted by key players
It profiles key players in the global television network market based on the following parameters - company highlights, products portfolio, key highlights, financial performance, and strategies
Key companies covered as a part of this study include Samsung Electronics, LG Display, Sony Corporation, Hisense Group, Foxconn Technology Group, Dixon Technologies, Kathrein-Werke KG, Comcast Corporation, The Walt Disney Company, Warner Bros. Discovery, Netflix Inc., Paramount Global, Apple Inc., AT&T Inc., and Charter Communications
Insights from this report would allow marketers and the management authorities of the companies to make informed decisions regarding their future product launches, type up-gradation, market expansion, and marketing tactics
The global television network market report caters to various stakeholders in this industry including investors, suppliers, product manufacturers, distributors, new entrants, and financial analysts
Stakeholders would have ease in decision-making through various strategy matrices used in analyzing the global television network market
Market Segmentation
- Service Insights (Revenue, USD Bn, 2020 - 2032)
- Direct Broadcast Satellite (DBS) Services
- Cable and Other Pay Services
- Subscription Channel Services
- Satellite Master Antenna Systems Services (SMATV)
- Multipoint Distribution System Services (MDS)
- Closed Circuit Television Circuits
- Revenue Model Insights (Revenue, USD Bn, 2020 - 2032)
- Subscription
- Advertisement
- Regional Insights (Revenue, USD Bn, 2020 - 2032)
- North America
- U.S.
- Canada
- Latin America
- Brazil
- Argentina
- Mexico
- Rest of Latin America
- Europe
- Germany
- U.K.
- Spain
- France
- Italy
- Russia
- Rest of Europe
- Asia Pacific
- China
- India
- Japan
- Australia
- South Korea
- ASEAN
- Rest of Asia Pacific
- Middle East
- GCC Countries
- Israel
- Rest of Middle East
- Africa
- South Africa
- North Africa
- Central Africa
- Company Profiles:
- Samsung Electronics
- LG Display
- Sony Corporation
- Hisense Group
- Foxconn Technology Group
- Dixon Technologies
- Kathrein-Werke KG
- Comcast Corporation
- The Walt Disney Company
- Warner Bros. Discovery
- Netflix Inc.
- Paramount Global
- Apple Inc.
- AT&T Inc.
- Charter Communications
Table of Contents
1. Research Objectives and Assumptions
- Research Objectives
- Assumptions
- Abbreviations
2. Market Purview
- Report Description
- Market Definition and Scope
- Executive Summary
- Global Television Network Market, By Service
- Global Television Network Market, By Revenue Model
- Global Television Network Market, By Region
3. Market Dynamics, Regulations, and Trends Analysis
- Market Dynamics
- Impact Analysis
- Key Highlights
- Regulatory Scenario
- Product Launches/Approvals
- PEST Analysis
- PORTER's Analysis
- Market Opportunities
- Regulatory Scenario
- Key Developments
- Industry Trends
4. Global Television Network Market, By Service, 2020-2032, (USD Bn)
- Introduction
- Market Share Analysis, 2025 and 2032 (%)
- Y-o-Y Growth Analysis, 2021 - 2032
- Segment Trends
- Direct Broadcast Satellite (DBS) Services
- Introduction
- Market Size and Forecast, and Y-o-Y Growth, 2020-2032, (USD Bn)
- Cable and Other Pay Services
- Introduction
- Market Size and Forecast, and Y-o-Y Growth, 2020-2032, (USD Bn)
- Subscription Channel Services
- Introduction
- Market Size and Forecast, and Y-o-Y Growth, 2020-2032, (USD Bn)
- Satellite Master Antenna Systems Services (SMATV)
- Introduction
- Market Size and Forecast, and Y-o-Y Growth, 2020-2032, (USD Bn)
- Multipoint Distribution System Services (MDS)
- Introduction
- Market Size and Forecast, and Y-o-Y Growth, 2020-2032, (USD Bn)
- Closed Circuit Television Circuits
- Introduction
- Market Size and Forecast, and Y-o-Y Growth, 2020-2032, (USD Bn)
5. Global Television Network Market, By Revenue Model, 2020-2032, (USD Bn)
- Introduction
- Market Share Analysis, 2025 and 2032 (%)
- Y-o-Y Growth Analysis, 2021 - 2032
- Segment Trends
- Subscription
- Introduction
- Market Size and Forecast, and Y-o-Y Growth, 2020-2032, (USD Bn)
- Advertisement
- Introduction
- Market Size and Forecast, and Y-o-Y Growth, 2020-2032, (USD Bn)
6. Global Television Network Market, By Region, 2020 - 2032, Value (USD Bn)
- Introduction
- Market Share (%) Analysis, 2025, 2028 & 2032, Value (USD Bn)
- Market Y-o-Y Growth Analysis (%), 2021 - 2032, Value (USD Bn)
- Regional Trends
- North America
- Introduction
- Market Size and Forecast, By Service, 2020 - 2032, Value (USD Bn)
- Market Size and Forecast, By Revenue Model, 2020 - 2032, Value (USD Bn)
- Market Size and Forecast, By Country, 2020 - 2032, Value (USD Bn)
- U.S.
- Canada
- Latin America
- Introduction
- Market Size and Forecast, By Service, 2020 - 2032, Value (USD Bn)
- Market Size and Forecast, By Revenue Model, 2020 - 2032, Value (USD Bn)
- Market Size and Forecast, By Country, 2020 - 2032, Value (USD Bn)
- Brazil
- Argentina
- Mexico
- Rest of Latin America
- Europe
- Introduction
- Market Size and Forecast, By Service, 2020 - 2032, Value (USD Bn)
- Market Size and Forecast, By Revenue Model, 2020 - 2032, Value (USD Bn)
- Market Size and Forecast, By Country, 2020 - 2032, Value (USD Bn)
- Germany
- U.K.
- Spain
- France
- Italy
- Russia
- Rest of Europe
- Asia Pacific
- Introduction
- Market Size and Forecast, By Service, 2020 - 2032, Value (USD Bn)
- Market Size and Forecast, By Revenue Model, 2020 - 2032, Value (USD Bn)
- Market Size and Forecast, By Country, 2020 - 2032, Value (USD Bn)
- China
- India
- Japan
- Australia
- South Korea
- ASEAN
- Rest of Asia Pacific
- Middle East
- Introduction
- Market Size and Forecast, By Service, 2020 - 2032, Value (USD Bn)
- Market Size and Forecast, By Revenue Model, 2020 - 2032, Value (USD Bn)
- Market Size and Forecast, By Country, 2020 - 2032, Value (USD Bn)
- GCC Countries
- Israel
- Rest of Middle East
- Africa
- Introduction
- Market Size and Forecast, By Service, 2020 - 2032, Value (USD Bn)
- Market Size and Forecast, By Revenue Model, 2020 - 2032, Value (USD Bn)
- Market Size and Forecast, By Country/Region, 2020 - 2032, Value (USD Bn)
- South Africa
- North Africa
- Central Africa
7. Competitive Landscape
- Samsung Electronics
- Company Highlights
- Product Portfolio
- Key Developments
- Financial Performance
- Strategies
- LG Display
- Company Highlights
- Product Portfolio
- Key Developments
- Financial Performance
- Strategies
- Sony Corporation
- Company Highlights
- Product Portfolio
- Key Developments
- Financial Performance
- Strategies
- Hisense Group
- Company Highlights
- Product Portfolio
- Key Developments
- Financial Performance
- Strategies
- Foxconn Technology Group
- Company Highlights
- Product Portfolio
- Key Developments
- Financial Performance
- Strategies
- Dixon Technologies
- Company Highlights
- Product Portfolio
- Key Developments
- Financial Performance
- Strategies
- Kathrein-Werke KG
- Company Highlights
- Product Portfolio
- Key Developments
- Financial Performance
- Strategies
- Comcast Corporation
- Company Highlights
- Product Portfolio
- Key Developments
- Financial Performance
- Strategies
- The Walt Disney Company
- Company Highlights
- Product Portfolio
- Key Developments
- Financial Performance
- Strategies
- Warner Bros. Discovery
- Company Highlights
- Product Portfolio
- Key Developments
- Financial Performance
- Strategies
- Netflix Inc.
- Company Highlights
- Product Portfolio
- Key Developments
- Financial Performance
- Strategies
- Paramount Global
- Company Highlights
- Product Portfolio
- Key Developments
- Financial Performance
- Strategies
- Apple Inc.
- Company Highlights
- Product Portfolio
- Key Developments
- Financial Performance
- Strategies
- AT&T Inc.
- Company Highlights
- Product Portfolio
- Key Developments
- Financial Performance
- Strategies
- Charter Communications
- Company Highlights
- Product Portfolio
- Key Developments
- Financial Performance
- Strategies
8. Analyst Recommendations
- Wheel of Fortune
- Analyst View
- Coherent Opportunity Map
9. References and Research Methodology
- References
- Research Methodology
- About us

